Cacti windows server template

Cacti windows server template

The real strength of Cacti is unleashed by using templates. There are three different types of templates with the basic Cacti installation: Data Templates , Graph Templates and Host Templates . While it is perfectly fine to define all data sources and graphs without using Templates at all, the burden of this approach is high. In most installations, there are lots of devices of the same kind. And there are lots of data of the same kind, e.g. traffic information is needed for almost every device. Therefor, the parameters needed to create a traffic rrd file are defined by a Data Template , in this case known as «Interface — Traffic». These definitions are used by all Traffic-related rrd files.

The same approach is used for defining Graph Templates . This is done only once. And all parameters defined within such a Graph Template are copied to all Graphs that are created using this Template.

The last type of Templates are the Host Templates . They are not related to some rrdtool stuff. The purpose of Host Templates is to group all Graph Templates and Data Queries (these are explained later) for a given device type. So you will make up a Host Template e.g. for a specific type of router, switch, host and the like. By assigning the correct Host Template to each new Device, you’ll never forget to create all needed Graphs.

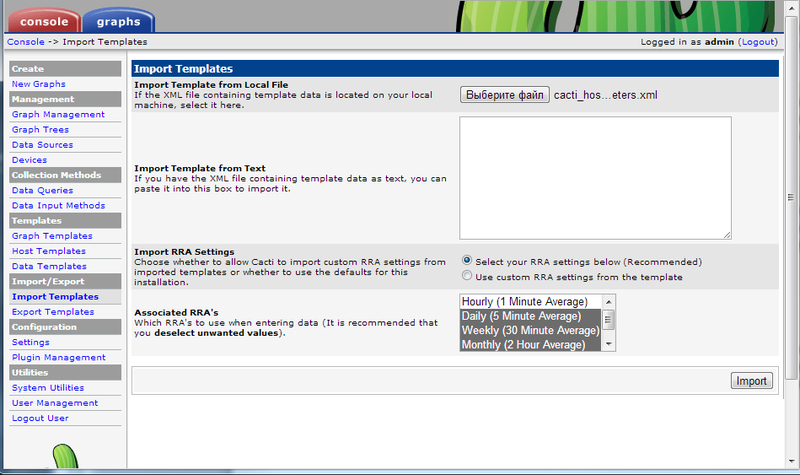
There’s no need to create all Templates on your own! Apart from the fact, that many common templates are provided out-of-the-box, there’s a very simple machnism to Import Templates and to Export Templates .

In Cacti, a data template provides a skeleton for an actual data source. If you have many data sources that share most of their characteristics, using a data template would probably make sense. No change of a Data Template is propagated to already existing rrd files. But most of them may be changed by using rrdtool tune from command line. Pay attention to not append new Data Source Items to already existing rrd files. There’s no rrdtool command to achieve this!

To create a new data template, select Data Templates under the Templates heading and click Add .

The first thing you must do is give the template a name. This name has nothing to do with the data source name, but is what you will use to identify the template throughout Cacti.

Second, you will notice a list of data source/data source item field names with Use Per-Data Source Value checkboxes next to each one. The nice thing about templates in Cacti is that you can choose whether to template each field on a per-field basis. If you leave the checkbox unchecked, every data source attached to the template will inherit its value from the template. If the checkbox is checked, every data source attached to the template will contain its own value for that particular field. When generating a real data source, you will be prompted to fill those non-templated fields.

Table 13-1. Data Templates: Field Description of the Data Source Section

Name Description
Name The name of the Data Source that will be created by using this Template. You can use the keyword |host_description| in this field, which will be automatically substituted with the current host description.
Data Input Method Here is where you tell cacti how it is supposed to fetch data for this data source. There are several data input sources that come with cacti, and you can add your own by going to Data Input Methods. If this RRD file is being populated outside of cacti, make sure to leave this field set to «None».
Associated RRAs You need to associate the data source with at least one RRA so RRDTool knows how often and for how long to keep its data. You will almost always want to select all of these values however so you can render daily, weekly, monthly, and yearly graphs.
Step This tells RRDTool how many seconds there will be between updates. The default is 300 seconds (5 minutes), and is sufficient for most installations.
Data Source Active This is a quick and easy to tell Cacti to stop gathering data for this data source. The data source can still be used on graphs, but no data will be fed to it until it is made active again.

Note: For most data templates, you will want to check the Use Per-Graph Value checkbox for the name field so each data source using this template has its own unique name. It also makes sense to enter an inital value in this field that includes the variable |host_description| for organizational purposes.

When you are finished filling in values for the data template, click Create and you will be presented with a screen similar to the data source edit screen.

Figure 13-1. Adding a Data Template

Like a graph, a data source can have more than one items. This is useful in situations where a script returns more than piece of data at one time. This also applies to data queries, so you can have a single data template that contains both inbound and outbound traffic, rather than having to create a separate data template for each.

Table 13-2. Data Templates: Field Description of the Data Source Items Section

Here is where you specify the maximum value that is expected for this data source in the RRD file. If a value higher than the maximum is given, it will be stored as Unknown (U).

Note: It often makes sense to define a reasonable maximum value here to avoid spikes in case of a COUNTER wrap

Cacti currently supports four types of data that RRDTool can represent for any given data source:

COUNTER: is for continuous incrementing counters like the ifInOctets counter in a router. The COUNTER data source assumes that the counter never decreases, except when a counter overflows. It is always a whole INTEGER, floating point numbers are invalid. The update function takes the overflow into account. The counter is stored as a per-second rate. When the counter overflows, RRDTool checks if the overflow happened at the 32bit or 64bit border and acts accordingly by adding an appropriate value to the result.

GAUGE: numbers that are not continuously incrementing, e.g. a temperature reading. Floating point numbers are accepted.

ABSOLUTE: counters that are reset upon reading

DERIVE: like COUNTER but without overflow checks

Name Description
Internal Data Source Name This is the name used by RRDTool to identify this particular data source within the RRD file. RRDTool places a limit of 19 alphanumeric characters (plus ‘_’ and ‘-‘) on this field.
Minimum Value Here is where you specify the minimum value that is expected for this data source in the RRD file. If a value lower than the minimum is given, it will be stored as Unknown (U).
Maximum Value
Heartbeat As defined by RRDTool : «The maximum amount of time that can pass before data is entered as «unknown». This field is usually ‘600’ or 2 data gathering intervals» .

Assuming you selected a data input source on the previous screen, you should now be presented with a Custom Data box. It will show a single line for every single parameter required for that very data input method. This is how the Data Source glues together with the data input method to provide all run time parameters.

Each custom data field is per-field templatable as all of the other data source fields are. Even if you select the Use Per-Data Source Value checkbox, it might be useful to specify a value that will be used as an «inital value» for any data source using this data template.

Applying a data template to a data source is a very simple process. The first thing you must do is select the data source you want to apply the template to under Data Sources . Under the Data Template Selection box, select the data template that you want to apply to the data source and click Save .

Once the template is applied to the data source, you will notice that you can only change values for the fields that you checked Use Per-Data Source Value for.

Now any time a change is made to the data template, it will be automatically propagated to the data sources attached to it.

When changing parameters of a Data Template, existing rrd files will never be changed. If this is required, you will have to apply rrdtool tune commands to any related rrd file manually.

Cacti data queries

Немногим больше года назад потребовалось решать задачу получения и отображения множества однотипных показателей с нескольких серверов, при этом количество серверов и количество снимаемых с них показателей с течением времени могло меняться. На узлы был установлен zabbix_agent , настроены пользовательские параметры, сделаны шаблоны, данные успешно попадали в Zabbix. Для второй системы — Cacti, на скорую руку был переделан найденный где-то скрипт, который собирал данные zabbix_get и использовал Data Queries. Но что-то в этом скрипте скоро сломалось и в качестве единственной рабочего решения был оставлен Zabbix.

Понять что же такое Data Queries и как сделать так чтобы всё заработало, нашлось время только на новогодних каникулах.

Повторю расхожее выражение про ленность сисадминов, которым хочется чтобы всё работало само по себе. В моём случае, чтобы для каждого контролируемого узла можно было сразу добавить все необходимые графики и при изменении количества снимаемых показателей нужная информация добавлялась, если не автоматически, то максимально просто. Хотелось иметь механизм который не только получает и обрабатывает данные, но и знает какие данные можно получить. Именно так и работает метод Data Queries, позволяющий собирать значения как Data Input и дополнительно возвращать список всех возможных параметров.

В Cacti такой подход встроен, что называется, из коробки. Для узлов использующих шаблон Generic SNMP можно видеть список всех сетевых интерфейсов, выбрать нужные и строить по ним необходимые графики связанным с ним Data Queries SNMP — Interface Statistics. Казалось бы, что проще, посмотреть как это устроено, почитать документацию здесь и здесь и переделать под себя. Но уж больно, на мой взгляд, неудачный и сложный пример скрипта выбран для описания, в котором я разобрался уже после того как всё сделал. Хотя пользовательская составляющая, куда что нажать в интерфейсе чтобы заработало вопросов не вызывает.

Итак, Data Queries представлен тремя разновидностями: Get SNMP Data, Get Script Server Data, Get Script Data

  1. Get SNMP Data представлен только XML шаблоном, задающим какие параметры снимать и откуда, конечно, используя протокол SNMP;
  2. Методы Get Script Server Data и Get Script Data, определяются XML шаблоном и связанным с ним скриптом. Только в случае Get Script Server Data была произведена оптимизация скорости выполнения, за счёт использования общего PHP процесса, что требует использовать PHP. Get Script Data самый общий подход, далее будем рассматривать только его.

Со стороны Cacti это выглядит так. Из XML шаблона считываются параметры работы скрипта и аргументы которые надо будет отображать. После привязки Data Queries к узлу, у скрипта будет запрошен и запомнен список всех возможных элементов (индексов) для которых он будет возвращать значения. Если данные поменяются, необходимо заново их перечитать выполнив из интерфейса Reload Data Query для привязанного метода. Во время очередного опроса, тот же скрипт должен будет вернуть запрашиваемые данные для указанного индекса и аргумента. Каждый раз это будет разный вызов скрипта, по всем запомненным индексам и каждому из отображаемых аргументов. После этого сохранить в Data Source и нарисовать на графике.

Cacti: Мониторинг SMART

Восстановление данных в результате «физической смерти» носителя информации не самое приятное времяпрепровождение в жизни любого системного администратора. Следовательно, чем долгие часы исправлять ситуацию, а данных у нас очень много, лучше её предотвратить — организовав мониторинг.

У жестких и твердотельных накопителей есть встроенная технология, которая позволяет производить самостоятельную самодиагностику — S.M.A.R.T., к ней мы и будем работать.
S.M.A.R.T. — технология оценки состояния жёсткого диска встроенной аппаратурой самодиагностики, а также механизм предсказания времени выхода его из строя.

SMART не является панацеей от всех бед, но определенные сведения и некое планирование, посредством полученных данных, можно осуществить вовремя, тем самым чуть-чуть облегчить себе жизнь.

В качестве исходного сервера выступает Linux CentOS 6, работающий, в роли файлового хранилища.

Linux содержит группу пакетов под названием «Smartmontools», которые представляют собой набор утилит для проверки состояния дисков. Непосредственно конфигурация демона smartd для регулярного тестирования и мониторинга SMART, выходит за рамки данной статьи, интересующиеся могут самостоятельно найти примеры настройки в Интернете.

Нас же интересует графическое отображение ключевых параметров, аномальное изменение которых можно увидеть порой только визуально. И в этом нам поможет Cacti.

1) Для начала ставим пакет smartmontools:

После установки, можно проверить параметры дисков:

Как правило, вместо «DEVICE» будет что-то вроде /dev/sda (первый диск), /dev/sdb (второй).
Иногда необходимо принудительно включить SMART на диске:

В настоящее время технология SMART недоступна для USB дисков, несмотря на то, что диск внутри бокса может отдать необходимую информацию.

Получение SMART требует определенных привилегии, у демона SNMPd они как правило отсутствуют, поэтому основная работа по сбору промежуточных данных будет происходить через CRON скрипт:

Не забываем создать дирректорию /tmp/snmp и поместить запуск в CRON

Этот код ищет устройства «/dev/sd?» (/dev/sda, /dev/sdb и т.д.) и пытается записать их SMART данные в файл.

Все SMART параметры имеют порядковый номер. Соответствующая нумерация будет использоваться в PERL скрипте, вместо того, чтобы рассматривать каждый параметр сам по себе.

Выставляем скрипту права на выполнение:

Этот скрипт принимает номер SMART параметра и выводит разницу между текущим значением и трешхолдом (порогом) для этого параметра.

Стоит отметить, что в зависимости от производителя, модели или версии прошивки, трешхолды могут быть разными. Поэтому само значение не представляет собой большого интереса, а вот необычные колебания или тенденции к снижению, стоит принимать во внимание. Для температуры, как правило, необходимо получить мгновенное значение.

Добавляем snmpd.conf строки (или другие, если вы хотите контролировать «свои» показатели. Общее представление о параметрах можно получить в Википедии):

Рестартуем демона и проверяем выдачу (необходимо подставить свои «SNMP_Community» и «host_name»):

2. Cacti Templates

В архиве основной шаблон, содержащий все параметры на одном графике. В отдельный график выведена температура.

Для работы необходимо переместить файл сопоставления disk_smart.xml в /resource/snmp_queries/
И импортировать cacti_host_template_smart_parameters.xml в кактус.

Если все правильно настроено, то при добавлении «Disk SMART Parameters» в Associated Data Queries устройства должен появиться статус опрошенных объектов.

Не забываем выбрать правильный шаблон при непосредственном создании графиков. По умолчанию графики строятся для SSD дисков (AGILITY3), что не совсем правильно.

3. Примеры графиков:

Статья подготовлена на основе материала SMART stats on Cacti (via SNMP)

Читайте также:  Vmware tools для mac os high sierra
Оцените статью
No change of existing rrd files