- Анализ аварийных дампов Windows
- Содержание
- Анализ аварийного дампа утилитой BlueScreenView
- Анализ аварийного дампа отладчиком WinDbg
- Установка Debugging Tools for Windows (WinDbg)
- Настройка отладочных символов
- Анализ аварийного дампа
- Получение информации о проблемном драйвере
- Аппаратные причины возникновения критических ошибок
- Диагностика неисправностей диска
- Диагностика неисправностей памяти
- Настройка параметров сохранения аварийного дампа
- Generate a kernel or complete crash dump
- Set up page files
- Enable memory dump setting
- Tips to generate memory dumps
- Manually generate a memory dump file
- Use the NotMyFault tool
- Use NMI
- Collecting User-Mode Dumps
- Синий экран с сообщением «Collecting data for crash dump»
- Решение
Анализ аварийных дампов Windows
В случае критической ошибки система останавливает свою работу, отображает синий экран смерти (BSOD), информация об ошибке и содержимое памяти сохраняется в файле подкачки. При последующей загрузке системы, на основе сохраненных данных, создается аварийный дамп c отладочной информацией. В системном журнале событий создается запись о критической ошибке.
Если критическая ошибка возникла на ранней стадии загрузки системы или в результате ошибки произошел отказ дисковой подсистемы, аварийный дамп сохранен не будет.
Аварийный дамп может быть проанализирован с помощью утилиты BlueScreenView или системного отладчика WinDbg (Debugging Tools for Windows).
Содержание
Анализ аварийного дампа утилитой BlueScreenView
Простейшим инструментом для анализа аварийных дампов является утилита BlueScreenView от NirSoft.
BlueScreenView сканирует папку с минидампами и отображает информацию по найденным отказам.
По каждому отказу отображается дата, данные об ошибке и драйвер, который предположительно вызвал отказ.
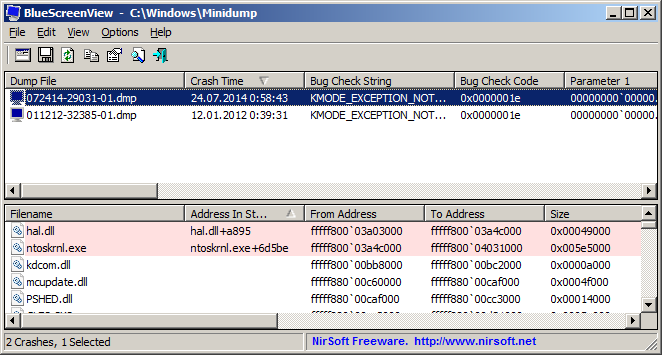
В нижней части окна отображается список загруженных в системе драйверов. Модули, к которым выполнялось обращение в момент отказа, выделены цветом, на них следует обратить особое внимание, они могут быть причиной отказа.
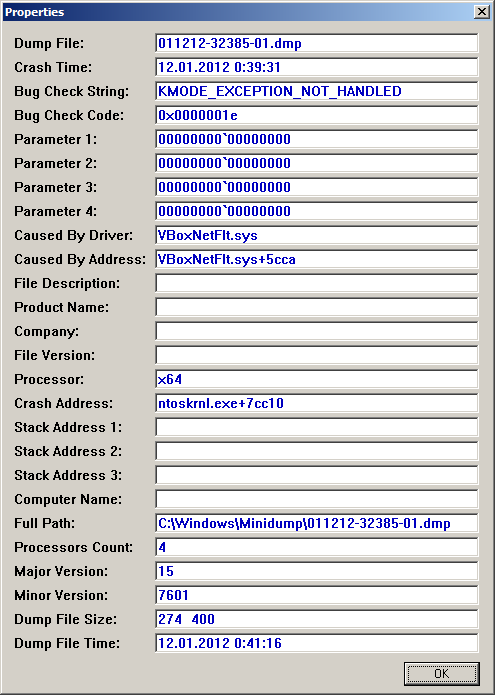
По двойному клику отображается дополнительная информация.
Анализ аварийного дампа отладчиком WinDbg
С помощью WinDbg из аварийного дампа можно вытащить более детальную информацию, включая расшифровку стека.
Установка Debugging Tools for Windows (WinDbg)
Microsoft распространяет WinDbg только в составе SDK, загрузить веб-установщик можно на странице загрузки.
Для анализа аварийных дампов установка SDK не требуется. Скачать Debugging Tools for Windows (WinDbg) отдельным пакетом можно здесь.
После установки, корректируем ярлык для запуска WinDbg. В свойствах ярлыка, устанавливаем флажок запуска от имени администратора. Также, в качестве рабочей папки, задаем: %SystemRoot%\Minidump.
Настройка отладочных символов
Отладочные символы содержат символические имена функций из исходного кода. Они необходимы для расшифровки и интерпретации аварийного дампа.
При первом запуске WinDbg, необходимо указать путь к отладочным символам, для этого открываем меню File, Symbol File Path, или используем комбинацию Ctrl+S.
Следующей строкой включаем загрузку отладочных символов из сети, задаем локальный путь для сохранения файлов и адрес для загрузки из интернета:
Анализ аварийного дампа
В меню выбираем File, Open Crash Dump, или нажимаем Ctrl+D.
Указываем путь к дампу %SystemRoot%\MEMORY.DMP или %SystemRoot%\Minidump\файл.dmp.
Загрузка отладочных символов из интернета может занять некоторое время.
Для получения детальной информации выполняем команду:
Дебаггер сам вам предложит ее выполнить, достаточно навести указатель мыши на ссылку и кликнуть.
В результате получаем следующий вывод:
Получение информации о проблемном драйвере
Если удалось обнаружить драйвер, в котором возникла ошибка, имя драйвера будет отображено в полях MODULE_NAME и IMAGE_NAME.
Чтобы получить путь к файлу и прочую информацию, щелкаем по ссылке на модуль:
Если полный путь к драйверу не указан, по умолчанию используется папка %SystemRoot%\system32\drivers.
Находим указанный файл, и изучаем его свойства.
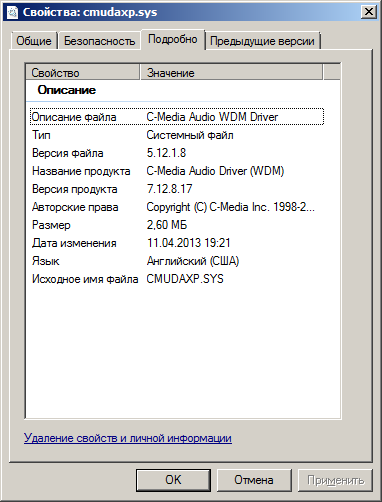
Обновляем проблемный драйвер.
Аппаратные причины возникновения критических ошибок
Источником критических ошибок нередко бывают неисправности в дисковой подсистеме, или в подсистеме памяти.
Диагностика неисправностей диска
В случае ошибок дисковой подсистемы, аварийный дамп может не сохраняться.
Чтобы исключить проблемы с диском, проверяем системный журнал событий на наличие ошибок чтения и записи на диск.
Проверяем параметры S.M.A.R.T жесткого диска, получить их можно, например, с помощью программы SpeedFan.
Особое внимание обращаем на параметры: «Current Pending Sector Count» и «Uncorrectable Sector Count», ненулевые значения этих параметров сигнализируют о неисправности диска.
Ненулевое значение параметра: «UltraDMA CRC Error Count», сигнализирует о проблеме с SATA-кабелем.
Подробнее о параметрах S.M.A.R.T. читаем в статье Википедии.
Диагностика неисправностей памяти
Проблемы с памятью нередко могут стать причиной самых разнообразных глюков, включая различные синие экраны, зависания, аварийное завершение программ, повреждение реестра, повреждение файловой системы и данных.
Выявить проблемы с памятью можно с помощью утилиты Memtest86+.
Загружаем образ по ссылке, записываем на диск, загружаемся с диска, запускается тест.
Начиная с Windows Vista, в системе имеется свой тест памяти. Для его запуска нажимаем «Пуск», в строке поиска набираем «памяти«, выбираем «Средство диагностики памяти Windows».
Проблемы с памятью в некоторых случаях могут быть устранены обновлением BIOS.
Настройка параметров сохранения аварийного дампа
Для изменения параметров сохранения аварийного дампа нажимаем кнопку «Пуск», щелкаем на «Компьютер» правой кнопкой мыши, в контекстном меню выбираем «Свойства». В окне «Система» слева выбираем «Дополнительные параметры системы», в группе «Загрузка и восстановление» нажимаем кнопку «Параметры».
Generate a kernel or complete crash dump
A system crash (also known as a “bug check” or a «Stop error») occurs when Windows can’t run correctly. The dump file that is produced from this event is called a system crash dump.
A manual kernel or complete memory dump file is useful when you troubleshoot several issues because the process captures a record of system memory at the time of a crash.
Set up page files
See Support for system crash dumps for the page file size requirement for system crash dump.
Enable memory dump setting
You must be logged on as an administrator or a member of the Administrators group to complete this procedure. If your computer is connected to a network, network policy settings may prevent you from completing this procedure.
To enable memory dump setting, follow these steps:
In Control Panel, select System and Security > System.
Select Advanced system settings, and then select the Advanced tab.
In the Startup and Recovery area, select Settings.
Make sure that Kernel memory dump or Complete memory dump is selected under Writing Debugging Information.
Restart the computer.
You can change the dump file path by edit the Dump file field. In other words, you can change the path from %SystemRoot%\Memory.dmp to point to a local drive that has enough disk space, such as E:\Memory.dmp.
Tips to generate memory dumps
When the computer crashes and restarts, the contents of physical RAM are written to the paging file that is located on the partition on which the operating system is installed.
Depending on the speed of the hard disk on which Windows is installed, dumping more than 2 gigabytes (GB) of memory may take a long time. Even in a best case scenario, if the dump file is configured to reside on another local hard drive, a significant amount of data will be read and written to the hard disks. This can cause a prolonged server outage.
Use this method to generate complete memory dump files with caution. Ideally, you should do this only when you are explicitly requested to by the Microsoft Support engineer. Any kernel or complete memory dump file debugging should be the last resort after all standard troubleshooting methods have been completely exhausted.
Manually generate a memory dump file
Use the NotMyFault tool
If you can log on while the problem is occurring, you can use the Microsoft Sysinternals NotMyFault tool. To do this, follow these steps:
Download the NotMyFault tool.
Select Start, and then select Command Prompt.
At the command line, run the following command:
This operation generates a memory dump file and a D1 Stop error.
Use NMI
On some computers, you cannot use keyboard to generate a crash dump file. For example, Hewlett-Packard (HP) BladeSystem servers from the Hewlett-Packard Development Company are managed through a browser-based graphical user interface (GUI). A keyboard is not attached to the HP BladeSystem server.
In these cases, you must generate a complete crash dump file or a kernel crash dump file by using the Non-Maskable Interrupt (NMI) switch that causes an NMI on the system processor.
To do this, follow these steps:
Follow the steps in this section carefully. Serious problems might occur if you modify the registry incorrectly. Before you modify it, back up the registry for restoration in case problems occur.
In Registry Editor, locate the following registry subkey:
HKEY_LOCAL_MACHINE\SYSTEM\CurrentControlSet\Control\CrashControl
Right-click CrashControl, point to New, and then click DWORD Value.
Type NMICrashDump, and then press Enter.
Right-click NMICrashDump, and then select Modify.
In the Value data box, type 1, and then select OK.
Restart the computer.
Hardware vendors, such as HP, IBM, and Dell, may provide an Automatic System Recovery (ASR) feature. You should disable this feature during troubleshooting. For example, if the HP and Compaq ASR feature is enabled in the BIOS, disable this feature while you troubleshoot to generate a complete Memory.dmp file. For the exact steps, contact your hardware vendor.
Enable the NMI switch in the BIOS or by using the Integrated Lights Out (iLO) Web interface.
For the exact steps, see the BIOS reference manual or contact your hardware vendor.
Test this method on the server by using the NMI switch to generate a dump file. You will see a STOP 0x00000080 hardware malfunction.
If you want to run NMI in Microsoft Azure using Serial Console, see Use Serial Console for SysRq and NMI calls.
Collecting User-Mode Dumps
Starting with Windows Server 2008 and Windows Vista with Service Pack 1 (SP1), Windows Error Reporting (WER) can be configured so that full user-mode dumps are collected and stored locally after a user-mode application crashes. Applications that do their own custom crash reporting, including .NET applications, are not supported by this feature.
This feature is not enabled by default. Enabling the feature requires administrator privileges. To enable and configure the feature, use the following registry values under the HKEY_LOCAL_MACHINE\SOFTWARE\Microsoft\Windows\Windows Error Reporting\LocalDumps key.
| Value | Description | Type | Default value |
|---|---|---|---|
| DumpFolder | The path where the dump files are to be stored. If you do not use the default path, then make sure that the folder contains ACLs that allow the crashing process to write data to the folder. For service crashes, the dump is written to service specific profile folders depending on the service account used. For example, the profile folder for System services is %WINDIR%\System32\Config\SystemProfile. For Network and Local Services, the folder is %WINDIR%\ServiceProfiles. | REG_EXPAND_SZ | %LOCALAPPDATA%\CrashDumps |
| DumpCount | The maximum number of dump files in the folder. When the maximum value is exceeded, the oldest dump file in the folder will be replaced with the new dump file. | REG_DWORD | 10 |
| DumpType | Specify one of the following dump types:
| REG_DWORD | 1 |
| CustomDumpFlags | The custom dump options to be used. This value is used only when DumpType is set to 0. The options are a bitwise combination of the MINIDUMP_TYPE enumeration values. | REG_DWORD | MiniDumpWithDataSegs | MiniDumpWithUnloadedModules | MiniDumpWithProcessThreadData. |
These registry values represent the global settings. You can also provide per-application settings that override the global settings. To create a per-application setting, create a new key for your application under HKEY_LOCAL_MACHINE\Software\Microsoft\Windows\Windows Error Reporting\LocalDumps (for example, HKEY_LOCAL_MACHINE\Software\Microsoft\Windows\Windows Error Reporting\LocalDumps\MyApplication.exe). Add your dump settings under the MyApplication.exe key. If your application crashes, WER will first read the global settings, and then will override any of the settings with your application-specific settings.
After an application crashes and prior to its termination, the system will check the registry settings to determine whether a local dump is to be collected. After the dump collection has completed, the application will be allowed to terminate normally. If the application supports recovery, the local dump is collected before the recovery callback is called.
These dumps are configured and controlled independently of the rest of the WER infrastructure. You can make use of the local dump collection even if WER is disabled or if the user cancels WER reporting. The local dump can be different than the dump sent to Microsoft.
Синий экран с сообщением «Collecting data for crash dump»
Вложения
 | Minidump.rar (78.7 Кб, 11 просмотров) |
Периодически вылезает синий экран — collecting data for crash dump
Периодически вылезает синий экран — collecting data for crash dump Отчет AIDA64 можно.
Чёрный экран с сообщением «DISK BOOT FAILURE, INSERT SYSTEM DISK AND PRESS ENTER»
У меня такая проблема при включении винчестера к компу, запускаю процессор выходит черный экран в.
Синий экран смерти. Отсутствие драйвера «dam EhStorClass»
Добрый вечер! Проблема такова: при работе с ПК (не важно в игре или в браузере) встречается.
Win 10 — вылетает синий экран «Clock watchdog timeout»
В Win 10 вылетает синий экран «Clock watchdog timeout» при просмотре видеороликов в браузере.
Добавлено через 1 минуту
4 из 4-ёх 1000007e AMPPAL.sys
Вложения
| Report.rar (121.3 Кб, 8 просмотров) |
Решение
SP 1 установить
И драйверы надо брать не из драйверопаков, а с сайтов оборудования
от этого отталкивайтесь
Заказываю контрольные, курсовые, дипломные и любые другие студенческие работы здесь или здесь.
Синий экран смерти «Dumping physical memory to disk»
Примерно месяц назад на ноутбуке модели Dell inspirion N7110 стали появляться различные.
Синий экран » Смерти «,при завершении работы Windows 7
Добрый день всем.Заметил я такое два дня назад.Вроде в инете нашел что да как,но,ничего не.
FAQ по расшифровке BSOD (синий «экран смерти»)
Оглавление: 0x00000001: APC_INDEX_MISMATCH 0x0000000A: IRQL_NOT_LESS_OR_EQUAL .
 BSOD (синий «экран смерти») постоянные ошибки
Собрал компьютер, после установки операционки через 2 недели начинают выскакивать ошибки при.


