- Разработка на ассемблере в Linux
- Установка FASM
- Системные вызовы
- Hello, World!
- Посмотрим, что внутри
- Basic Assembler Debugging with GDB
- or — you thought you only needed to know C/C++?
- by Patrick Horgan
- Who is this for?
- Tell me it’s not so! Why do I need to debug assembler?
- But don’t panic, it’s not so hard and debugging is debugging!
- You will have to learn a little about assembler
- But look out for the syntax wars
- You will be a better programmer if you avoid unreasoned bias
- Go here to quickly learn assembler
- So I’m not going to teach you assembler
- Our first program to debug is in assembler!
- Here’s our source
- Lets build it and run it.
- Now let’s run it in the debugger
- Wait a minute, why s and not si?
- So how does gdb know about the source code?
- We can see the code in the file too!
- Now lets talk about the C calling conventions
- Here’s the source of a simple C file.
- And here’s an application to trace it in assembler
- C variables are on the stack
- We start in main
- The preamble — On Entering A Function This You Will Do
- Calling another function
- Entering add() — Preamble again
- Preamble done — on to our business
- a=num1;
- a=num1+num2;
- Epilogue
- Back in main — now we see his epilogue.
- Now let’s build the real program and look at it in gdb
- A few things you need to know
- Load it up in gdb
- Run until the breakpoint
- Let’s look at f too
- Now we’re in f
- Past the preamble
- Heading back to main
- Now we’re all done let the program finish
- What does array access look like in assembler?
Разработка на ассемблере в Linux
Вообще программирование на ассемблере в Linux мало распространено и занимаются им, разве что, фанаты ассемблера. Сегодня мы и поговорим о программировании на ассемблере и инструментарий. Что нам понадобится:
- FASM. Берем на flatassembler.net версию для Linux
- ald. Берем на ald.sourceforge.net
- shed. Берем на shed.sourceforge.net
- ld. Есть в большинстве дистрибутивов
Собственно каждый для себя выбирает инструменты сам. Я выбрал для себя эти.
Установка FASM
После загрузки архива с офф. сайта распакуем его:
tar zxvf fasm-1.69.11.tgz
В папке у нас будет бинарный файл fasm, который мы можем использовать для компиляции. Для удобства вы можете создать симлинк на него:
sudo ln -s /home/username/fasm/fasm /usr/local/bin
ald и shed устанавливаются не сложнее:
$ ./configure
$ make
# make install
В итоге у нас будет 3 полезных инструмента для программирования на ассемблере.
Системные вызовы
Как и большинство других операционных систем, Linux предоставляет т.н. API — набор полезных для программиста функций. В большинстве случаев вызов системной функции производится с помощью прерывания 80h. Следует отметить, что Linux используется fastcall-конвенция передачи параметров. Согласно ей параметры передаются через регистры (в windows, например, используется stdcall, где параметры передаются через стек). Номер вызываемой функции кладется в eax, а параметры в регистры:
Номер параметра / Регистр
1 / ebx
2 / ecx
3 / edx
4 / esi
5 / edi
6 / ebp
Как видите все не так сложно. Узнать номер системной функции, ее описание и параметры можно, хотя бы здесь. Возьмем, к примеру sys_exit . Как можно увидеть на той странице у нее есть один параметр — код возврата и она имеет порядковый номер 1. Таким образом мы можем вызвать ее следующим кодом:
mov eax, 1 ; 1 — номер системной функции
sub ebx, ebx ; Обнуляем регистр (можно было записать mov ebx, 0)
int 80h ; Вызываем прерывание 80h
Надеюсь, что все понятно.
Hello, World!
Ну что же. Писать мы ничего не будем, т.к. за нас все написано 🙂 В папке fasm/examples/elfexe есть файл hello.asm, в котором находится следующий код:
; fasm demonstration of writing simple ELF executable
format ELF executable 3
entry start
segment readable executable
mov eax,4
mov ebx,1
mov ecx,msg
mov edx,msg_size
int 0x80
mov eax,1
xor ebx,ebx
int 0x80
segment readable writeable
msg db ‘Hello world!’,0xA
msg_size = $-msg
Как видите здесь вызываются 2 системных функции — sys_write (с порядковым номером 4) и sys_exit . sys_write принимает 3 параметра — дескриптор потока вывода (1 — stdout), указатель на строку и размер строки. Сам номер функции, как уже говорилось, мы должны положить в eax. Функцию sys_exit мы уже разобрали. Скомпилировать это чудо можно так: fasm hello.asm (но не обязательно, т.к. там же, где лежит исходник, есть и бинарник).
Посмотрим, что внутри
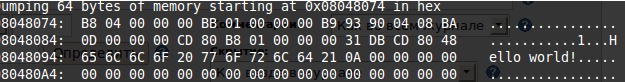
Думаю, что самое время заглянуть в наш бинарник. Для начала воспользуемся шестнадцатеричным редактором, чтобы посмотреть что у нас получилось. Выполним команду:

Мы видим всю нашу программу, данные, elf-заголовок. Неплохо? Теперь мы посмотрим на нашу программу в отладчике. Наберем в консоли:
Нас должна поприветствовать строка с предложением ввести команду. Список команд вы можете узнать, набрав help или получить помощь по отдельной команде, набрав help command . Дизассемблировать нашу программу можно командой disassemble (или ее алиас — » d «). Вы увидете дизассемблированный листинг вашей программы. Слева — адрес, справа — сама команда, а посередине — опкод команды.
Получить дамп можно командой dump (странно, но ее нет в выводе команды help ).
Теперь попробуем поработать с командой next . Выполните ее и в ответ вам покажут значения регистров, установленные флаги, а так же адрес, опкод и дизассемблированную команду, которая должна выполниться следующей. Попробуйте выполнять команды и следите за изменением флагов и регистров. После вызова первого прерывания у вас на экране должна появиться надпись «Hello world!».
Целью данной статьи было показать основы программирования на ассемблере в linux, а не программирования на ассемблере в общем. Надеюсь, что вы подчерпнули для себя что-то полезное от сюда.
Источник
Basic Assembler Debugging with GDB
or — you thought you only needed to know C/C++?
by Patrick Horgan
Who is this for?
This article is aimed straight at people who will be doing debugging with gdb on a linux box. There will be information useful in general to anyone that debugs in C/C++ and needs to drop down to assembler, but the tools and information are definately linux-centric. The assembler language used will be x86 with AT&T syntax. I assume you know C and or C++, that you can understand hexadecimal numbers, that you can run things from the command line, that you have a normal development environment using GNU tools installed, and many other things. In other words this is an intermediate level, not beginner level tutorial. Additionally this is not intended to teach you the things you would need to know to write assembler, but rather the things you would need to know to understand assembler you see in the debugger.
Tell me it’s not so! Why do I need to debug assembler?
There are several good reasons that you need to debug at the assembler level.
- A special purpose register changes in a way that affects your program and you don’t know why. Register contents and the ops that change them are only visible from assembler.
- Your C/C++ code looks entirely correct, but the output is unexpected. You need to drop to assembler to see the code generated for your C/C++ to find out what’s going on.
- Your code looks efficient, but it’s not.
- You’re debugging through a call into someone else’s code, maybe in a library, you don’t have the source code, but you still need to know what’s going on.
- Or generally, you want to really know what’s going on. In C or C++ things happen behind the scenes and you need to know what they are. Particularly in C++, details of how your compiler implements inheritance, construction, and destruction are only visible in assembler, and you will not be able to do your job as well unless you are familiar with what’s going on at the assembler level.
But don’t panic, it’s not so hard and debugging is debugging!
Your debugging skills will all translate to assembler programming, instead of s for step and n for next , it’s si for step instruction and ni for next instruction .
You will have to learn a little about assembler
It’s what the machine speaks after all.
But look out for the syntax wars
To make it more difficult, there’s two types of syntax used to represent the exact same machine code. Intel syntax is used by everyone that came up through the PC/Microsoft world, and AT&T syntax is used by everyone that came up through the Unix/Linux world. Sigh. GDB (and inline assembler in C/C++ with GCC) use the AT&T syntax by default, since it comes out of the unix/linux tradition, so that’s what I’ll talk about in this article. Many of the tutorials about assembler that you’ll find on the internet will use the intel syntax, because most of them are about Windows boxes. Articles about assembler on linux boxes will use AT&T syntax. And of course, it’s a matter of probability that you are most likely using an Intel processor on your box, and the documentation for their processors use the Intel syntax of course. You should learn both. The Wikipedia article, x86 assembly language has a good summary of the differences in the two syntaxes. I detect a bit of a bias in the authors toward the intel syntax, for example listing many programs that support that syntax but not listing ones that support the AT&T syntax, but don’t let that bother you.
You will be a better programmer if you avoid unreasoned bias
The computer world is full of unreasoned biases. People are passionate about everything from editors to operating systems. You might try to make an effort to avoid nourishing your own unreasoned biases. Most people will go with whatever they learned first. It doesn’t make that choice better or worse, and you trying to beat them over the head with the reasons you think your choice is better will only point out that you are annoying. If you step above the fray and realize that most of these choices are perfectly valid, it will make you less pedantic, more open to new things, and a better programmer and human being. You’ll also gain the perspective to see when there is really a difference between one choice and another, and to decide if that difference matters to you. ‘Nuff said.
Go here to quickly learn assembler
If you don’t know assembler at all, an extraordinary resource is Programming From The Ground Up by Jonathan Bartlett which teaches assembler programming on linux. I could not possibly recommend it highly enough. It begins with the assumption that you know little about programming and takes you to a fairly high level of expertise.
Another resource which assumes lots of knowlege but gives a whirlwind overview of the modern registers and their use is a nice white paper from Intel, written by David Kreitzer and Max Domeika; Ensuring Development Success by Understanding and Analyzing Assembly Language For IA-32 and IntelВ® 64 Instruction Set Architecture. Interestingly enough, it uses AT&T syntax for the assembler, since the article is for people using Intel’s professional assembler for Linux.
So I’m not going to teach you assembler
Instead I’ll jump right into using gdb with first a simple assembler program, then with a series of C/C++ programs. As we go, I’ll teach you a bit about using other tools like nm and objdump , I’ll teach you a little about how programs are started in linux, and I’ll teach you a bit about what C/C++ stack frames are and how they look from assembler.
Our first program to debug is in assembler!
Here’s our source
Every executable file on a linux system must have a symbol named _start. That’s the place that the system will hand control to in the program. We use .globl _start as a signal to the assembler and the loader that this will be a globally visible symbol, and then we place _start: in the program. Something that ends with a colon, (:), is called a symbol, and this one will be exported by the loader because we said it was global. It will refer to the address of whatever comes right after the declaration of the symbol. In this case, the next thing after _start: is movl $1, %eax , an instruction to tell the processor to move the value 1 into the %eax register. The address of that instruction will be associated with the global symbol _start: .
All this program will do is call the linux system call #1 which says to exit with the status value in register %ebx . That’s why we have the line movl $0xff, %ebx . It moves the literal value 0xff (255) into %ebx . Finally we call interrupt number 128, (in hexadecimal 0x80), which is handled by the operating system handler for that interrupt. That handler does system calls for you. It’s the interface between programs and the operating system.
Lets build it and run it.
Save a copy of the program as exit.s, and we’ll assemble and link it.
The assembler argument —gstabs+ tells the assembler that we want it to save debugging information that will let gdb print the line of assembler source code that corresponds to each assembler instruction. Run it and check that the return code is really returned to us like this.
$? is the shell symbol that means the completion/error code returned by the last program. In this case, we expect it to be 255, since that’s the value we put in %ebx , and if you try it, you’ll see that indeed that’s what happens.
Now let’s run it in the debugger
gdb exit tell the system to run gdb and to tell it that the program we want it to debug is exit. It starts up and tells us that it’s done reading symbols from our program and give us the gdb command prompt, (gdb ) . Being kind obliging folks, we give gdb a command, b _start , which tells gdb that we want it to put a breakpoint at the address with the symbol _start associated with it. Next we tell gdb to run and after telling us that it’s starting the program, the next news is that execution has been halted, at our request because it hit the breakpoint at _start. Then gdb shows us the source code associated with _start and waits for us to tell it what to do. We do a series of s (single step) commands until we get to the end of the program. Once the interrupt call is made, system call #1 is run and we exit. gdb reports the exit code is 0377 which is octal for decimal 255 (3 X 8 2 + 7 X 8 1 + 7 X 8 0 =3 X 64 + 7 X 8 + 7 X 1 = 192 + 56 + 7 = 255).
Wait a minute, why s and not si?
Some of you may be wondering why we can use step (s) instead of step instruction (si). If you’re debugging C/C++, the source file is the C/C++ and a single step steps from one source line to the next. If you want to step through the assembler, you have to use si. In assembler it’s the same. One step through the source is an assembler step. You can use si if you want, but you don’t have to.
So how does gdb know about the source code?
Remember the argument to the assemblers, —gstabs+? It caused some information to be saved inside the executable. We can, quite easily, see what it is.
This says that the file was built from the exit.s found in the named directory, and gives an association for each line of code between the line of code from the source, and the memory address of the executable. If we’re at address 0x804805e, we know that’s line six from the file, the line with the int $0x80.
We can see the code in the file too!
objdump can do a lot of other things for you, from the command line type man objdump for more information, but here we’ll use it to get a disassembly of the file exit.
The -d argument to objdump means disassemble, and we can see that the disassembly matches the original source file.
Now lets talk about the C calling conventions
Here’s the source of a simple C file.
And here’s an application to trace it in assembler
Below is an application (written in javascript and drawn on an html5 canvas), that will let you step through the the assembler that corresponds to the above C program one step at a time. When you’re done, if you want to run it again, just refresh the page. I didn’t make any attempt to model how we got into main, or where we go to after exiting main. There’s a whole tutorial for that, Linux x86 Program Start Up.
If you are reading this it means that your browser doesn’t understand the HTML5 canvas, and you will need to upgrade to a modern browser to get the most out of this tutorial.
C variables are on the stack
You know as a C/C++ programmer that on entry, your variables are on the stack. Now you’re going to learn exactly what that means. Your stack is just memory that you have permission to write to. (There are details about memory and mapping and virtual vs. real that I will not talk about at all in this tutorial, because they are not pertinent).
We start in main
The line of assembler the instruction pointer ( %eip ) is pointing at is the first instruction of main. Each time you click, you can see what happens to the stack pointer, the registers, and the instruction pointer.
The preamble — On Entering A Function This You Will Do
According to the C calling convention, the first thing to do upon entry to a function is to save %ebp , the caller’s base pointer, by pushing it onto the stack. Then the next thing is to copy the stack pointer into the base pointer so that you can find your arguments after the stack pointer changes. After that you would adjust your stack to make room for any locals, but main doesn’t have any so you don’t see that here.
Calling another function
So in a minute we’re going to call add , so we need to push its arguments on to the stack. The convention says that when calling a function you push its arguments onto the stack in reverse order. Go ahead and click the button and watch them get pushed onto the stack. Each time something gets pushed on the stack, the stack pointer first moves down in memory, and then the item is moved to that memory location. The stack pointer always points at the last thing that got pushed. For simplicity, everything in this program that goes on the stack is 4 bytes long, so each slot you see is a 4 byte slot. It’s also possible to pushw for 2 byte values, and pushb for one byte values. It’s also important to remember that the stack grows downward in memory.
As soon as you click the button to execute the call, the instruction pointer moves to the new function, and you’ll see that the return address was automatically pushed onto the stack.
Entering add() — Preamble again
In the new function we save main’s %ebp . Now we can copy our stack pointer into %ebp . Now %ebp functions as our base pointer and we can access our arguments above in the stack with positive offsets, and we can access locals (there will be one for the local a ) with negative offsets. Next we add 4 to our stack pointer to make room for a .
Preamble done — on to our business
a=num1;
We move the first argument off of the stack into %eax , and then save it into the local storage. That corresponds to the line of C, a=num1 .
a=num1+num2;
The next line is a=num1+num2 . That corresponds to the next couple of lines where num2 is pulled off the stack and added to %eax . Then it’s saved back into our local on the stack. Then right away we copy it back from the stack to %eax! What’s going on here? This is typical of unoptimized code generated by compilers. It looks silly because everything is generated by automated rules. When you turn optimization on it will find all of that stuff and clean it up.
Epilogue
Like the code prologue, there’s a standard way to exit a function. We have to undo the things the prologue does, we adjust the stack, pop the caller’s base pointer off the stack so that it points in the right place and with the return address now on the top of the stack, we can return. We have the return value in %eax where the convention says that we’re supposed to put it, and so we adjust the stack to get rid of our variable, and pop main’s %ebx . Notice that nothing takes the values out of stack memory, the pointer just adjusts to free the memory. Later if something else got pushed onto the stack it would overwrite the values, but otherwise they’re just sitting there. Finally, the return pops the return address off of the stack into %eip the instruction pointer, and execution returns to main right after the call.
Back in main — now we see his epilogue.
Main pops the %ebx that belonged to main’s caller off the stack and returns to them. Why didn’t they have to set up the return value? Well, the return value goes in %eax , and the value we are returning is the same thing that add returned to us. It’s already in %eax , so we can just return.
Now let’s build the real program and look at it in gdb
Save it as test.c and build it like this,
A few things you need to know
We’re going to step through it in assembler, and there are a few things I want to point out before I start. First, almost always, a line of C will correspond to several lines of assembler. I tell gdb, set disassemble-next-line on which makes it print the next line of assembler that will be executed the same way you’re used to it printing out the next line of C that will be executed. Since several lines of assembler correspond to one line of C, everytime a line of C is printed, you’ll see several lines of assembler like this
This tells you that line 5 from the C source compiled to four lines of assembler.
I step through the assembler with si (step instruction), and you’ll see that gdb will tell you which line of the assembler will be executed next by marking it on the left with => . Each time you tell gdb to step to the next instruction, the => will move down one, but the line of C won’t change until you si off the bottom of the assembler lines that correspond to the line of C.
When you start doing mixed assembler and C/C++ debugging there will be times you, by habit, type n (next) or s (step) and go to the next line of C when you meant to type ni (next instruction) or si (step instruction). It will be frustrating. At the worst you will have just done a lot of work to set up to see the smoking gun on a rare, hard to trace, bug and then you’ll have to start over. Be careful. I’ll do several step immediate before the C line will change. I’ll only type si for the first one, I’ll just press enter to take advantage of the way gdb will repeat the last instruction everytime you press enter.
Load it up in gdb
To start I load the program into the debugger, tell gdb I want to see the assembler that’s coming up whenever we stop, and set a breakpoint on main. There’s a surprise about the breakpoint.
Run until the breakpoint
Ok, I ran it, and hit the breakpoint. gdb told us both that we’d broken at line 12, which had the return f(2);, and that that line corresponded to two lines of assembler, the first to move a literal 2 onto the stack, and the other to call f. I wanted to see the bigger picture, so I typed disassemble. By default, the current function is disassembled. In the dump of the assembler code for the function main, you see that they still mark the line at 0x080483b8 as being the next line that will execute, but now you can see that we’ve already executed the three preamble lines. If we’d wanted to step through those, we would have to disassemble main first, and then set a breakpoint on the address of the first push, like b *0x80483b2 .
Let’s look at f too
Now I want to see what the function f will look like before we go into it, so I type disassemble f to ask gdb to do it.
Notice that we’re still on the same C instruction but now we’re on the next assembler instruction. It shows the call to f is the next this, so when I press enter again, we’ll be in f().
Now we’re in f
The opening brace of a function corresponds to the preamble!
Past the preamble
It took three si to get through the preamble the next step will bring us to the first line of C in the function.
Obviously, a lives on the stack at -4 from our base pointer. That would make it the first local variable, as expected.
We move the argument i off of the stack and into %eax, where we’ll do the calculation.
We added 4 to it, added our saved local variable a to it, and then saved it back into the input argument slot 8 above the base pointer.
return just means to put it into %eax. It was just there, so it’s a silly instruction moving something somewhere it already is, but that’s what optimizers are for.
The closing brace corresponds to the epilogue. If you haven’t seen the leave instruction before, it does the same thing as
We expect the return to load the address of the end of main in so let’s try it.
Heading back to main
Yep, we’re back in main.
We backed out of main and into the function that called main, __libc_start_main. We don’t have the source because Ubuntu didn’t install the source to go with libc.
Now we’re all done let the program finish
So I just type c (continue) and let the program exit, since we don’t have any need to debug functions in libc.
What does array access look like in assembler?
We’ll write a simple C program to access elements of an array of ints so that you’ll see what sort of assembler code corresponds to your C. We save the program as array1.c and then
We’ll load it up in gdb and see what it looks like.
Источник


