The !process extension displays information about the specified process, or about all processes, including the EPROCESS block.
This extension can be used only during kernel-mode debugging.
Parameters
/s **** Session Specifies the session that owns the desired process.
/m **** Module Specifies the module that owns the desired process.
Process Specifies the hexadecimal address or the process ID of the process on the target computer.
The value of Process determines whether the !process extension displays a process address or a process ID . If Process is omitted in any version of Windows, the debugger displays data only about the current system process. If Process is 0 and ImageName is omitted, the debugger displays information about all active processes. If -1 is specified for Process information about the current process is displayed.
Flags Specifies the level of detail to display. Flags can be any combination of the following bits. If Flags is 0, only a minimal amount of information is displayed. The default varies according to the version of Windows and the value of Process. The default is 0x3 if Process is omitted or if Process is either 0 or -1; otherwise, the default is 0xF.
Bit 0 (0x1) Displays time and priority statistics.
Bit 1 (0x2) Displays a list of threads and events associated with the process, and their wait states.
Bit 2 (0x4) Displays a list of threads associated with the process. If this is included without Bit 1 (0x2), each thread is displayed on a single line. If this is included along with Bit 1, each thread is displayed with a stack trace.
Bit 3 (0x8) Displays the return address and the stack pointer for each function The display of function arguments is suppressed.
Bit 4 (0x10) Sets the process context equal to the specified process for the duration of this command. This results in a more accurate display of thread stacks. Because this flag is equivalent to using .process /p /r for the specified process, any existing user-mode module list will be discarded. If Process is zero, the debugger displays all processes, and the process context is changed for each one. If you are only displaying a single process and its user-mode state has already been refreshed (for example, with .process /p /r), it is not necessary to use this flag. This flag is only effective when used with Bit 0 (0x1).
ImageName Specifies the name of the process to be displayed. The debugger displays all processes whose executable image names match ImageName. The image name must match that in the EPROCESS block. In general, this is the executable name that was invoked to start the process, including the file extension (usually .exe), and truncated after the fifteenth character. There is no way to specify an image name that contains a space. When ImageName is specified, Process must be zero.
Additional Information
For information about processes in kernel mode, see Changing Contexts. For more information about analyzing processes and threads, see Microsoft Windows Internals, by Mark Russinovich and David Solomon.
Remarks
The following is an example of a !process 0 0 display:
The following table describes some of the elements of the !process 0 0 output.
Element
Meaning
The eight-character hexadecimal number after the word PROCESS is the address of the EPROCESS block. In the final entry in the preceding example, the process address is 0x809258E0.
The hexadecimal number after the word Cid. In the final entry in the preceding example, the PID is 0x44, or decimal 68.
Process Environment Block (PEB)
The hexadecimal number after the word Peb is the address of the process environment block. In the final entry in the preceding example, the PEB is located at address 0x7FFDE000.
Parent process PID
The hexadecimal number after the word ParentCid is the PID of the parent process. In the final entry in the preceding example, the parent process PID is 0x26, or decimal 38.
The name of the module that owns the process. In the final entry in the preceding example, the owner is spoolss.exe. In the first entry, the owner is the operating system itself.
Process object address
The hexadecimal number after the word ObjectTable. In the final entry in the preceding example, the address of the process object is 0x80925c68.
To display full details on one process, set Flags to 7. The process itself can be specified by setting Process equal to the process address, setting Process equal to the process ID, or setting ImageName equal to the executable image name. Here is an example:
Note that the address of the process object can be used as input to other extensions, such as !handle, to obtain further information.
The following table describes some of the elements in the previous example.
Element
Meaning
WAIT
The parenthetical comment after this heading gives the reason for the wait. The command dt nt!_KWAIT_REASON will display a list of all wait reasons.
Lists the amount of time that has elapsed since the process was created. This is displayed in units of Hours:Minutes:Seconds.Milliseconds.
Lists the amount of time the process has been running in user mode. If the value for UserTime is exceptionally high, it might identify a process that is depleting system resources. Units are the same as those of ElapsedTime.
Lists the amount of time the process has been running in kernel mode. If the value for KernelTime is exceptionally high, it might identify a process that is depleting system resources. Units are the same as those of ElapsedTime.
Working Set sizes
Lists the current, minimum and maximum working set size for the process, in pages. An exceptionally large working set size can be a sign of a process that is leaking memory or depleting system resources.
Lists the paged and nonpaged pool used by the process. On a system with a memory leak, looking for excessive nonpaged pool usage on all the processes can tell you which process has the memory leak.
Indicates whether or not the process was created by the POSIX or Interix subsystems.
Indicates the number of private (non-sharable) pages currently being used by the process. This includes both paged in and paged out memory.
In addition to the process list information, the thread information contains a list of the resources on which the thread has locks. This information is listed in the third line of output after the thread header. In this example, the thread has a lock on one resource, a SynchronizationEvent with an address of 80144fc0. By comparing this address to the list of locks shown by the !kdext*.locks extension, you can determine which threads have exclusive locks on resources.
The !stacks extension gives a brief summary of the state of every thread. This can be used instead of the !process extension to get a quick overview of the system, especially when debugging multithread issues, such as resource conflicts or deadlocks.
Contains information about a newly created process and its primary thread. It is used with the CreateProcess, CreateProcessAsUser, CreateProcessWithLogonW, or CreateProcessWithTokenW function.
Syntax
Members
A handle to the newly created process. The handle is used to specify the process in all functions that perform operations on the process object.
A handle to the primary thread of the newly created process. The handle is used to specify the thread in all functions that perform operations on the thread object.
A value that can be used to identify a process. The value is valid from the time the process is created until all handles to the process are closed and the process object is freed; at this point, the identifier may be reused.
A value that can be used to identify a thread. The value is valid from the time the thread is created until all handles to the thread are closed and the thread object is freed; at this point, the identifier may be reused.
Remarks
If the function succeeds, be sure to call the CloseHandle function to close the hProcess and hThread handles when you are finished with them. Otherwise, when the child process exits, the system cannot clean up the process structures for the child process because the parent process still has open handles to the child process. However, the system will close these handles when the parent process terminates, so the structures related to the child process object would be cleaned up at this point.
Windows Process Explorer To Get Detailed Information About Processes
Windows provides different tools to list and get information about processes. The task manager can be used to list and manage the process. But task manager has limited capabilities. So if we are a pentester or system administrator who lives in deep water we can use process explorer for more functionality.
Download Windows Process Explorer
Process explorer is provided as Sysinternal utilities and downloaded from following link as zipped file.
In order to run process explorer we just need to select the architecture and click executable. There is no need to install.
Process Explorer Help
As we can see in the previous screenshot process explorer comes with a help file in chm format. We can get detailed help about the process explorer from this help document.
List Processes with Process Explorer
We can get process list and their detailed information just clicking to the process explorer file.
Process are listed according to their parent and child relationship. Process listed as a sub row are child of the upper process. Following information about processes can be seen from this page.
CPU columns shows general CPU usage percentage of this process.
Private Bytes columns show the size of memory only used by this process and not shared with other processes and DLL’s.
PID column shows process identifier given by operating system and used to easily identify the process.
Description columns shows the process information.
Company Name columns shows the executable file and application vendor company.
List Detailed Process Information
More detailed process information can be shown with the properties of the the selected process. Just right click on the process and select Properties . This will open a window like below.
We can see that there are a lot of tabs those provides related information. By default threads tab is opened and list existing threads of the current process which their Thread ID.
Following information can be get with other tabs.
TCP/IP tab provides the network ports and remote connections about this process.
Security tab provides owner, group and other related security information
Environment tab provides information about the process environment variables like OS, PATH, HOMEPATH etc.
Strings tab provides the identified strings in this process memory area.
Image tab provides executable file path related information
Performance tab provides CPU, I/O, Memory related statistics and information
Performance Graph tab shows simple CPU, Memory and I/O graphs about process
Threads tab shows related threads and their thread ID’s
Kill Process with Process Explorer
Another useful feature of the process explorer is killing selected process. This can be done right click to the related process and select Kill Process from the menu. We can also select process and use DELETE key to do same operation.
Kill Process Tree with Process Explorer
In previous step we just killed a single process. We can also kill the process tree. Process tree is the parent process and its child process. This will also kill the child processes too.
Check Process and Executable Security In Virus Total
There is very useful feature which is security related. We can check the executable file and running processes against Virus Total. Virtual Total is a services provides more than 50 antivirus applications to check uploaded executable files. This virus check will made us more secure. We can apply this check to suspicious process easily like below.
Process Explorer. Обзор некоторых возможностей
Process Explorer – альтернатива стандартному Task Manager-у. Эта утилита, как и многие другие утилиты Sysinternals, здорово расширяет возможности контроля и управления системой. Главное новшество только что вышедшей 14-ой версии — возможность мониторить сетевую активность процессов. Далее небольшой обзор возможностей этой утилиты, которые считаю наиболее полезными для себя.
Для справки. С 2006 года Sysinternals была приобретена Microsoft, а ключевая фигура этой компании – Марк Руссинович с тех пор работает в Microsoft. Марк известен своими утилитами, книгой Windows Internals, блогом и является признанным специалистом по архитектуре Windows.
Содержание:
Колонки в главном окне
Сервисы внутри svchost
Суммарные графики активности, процесс с максимальной активностью
Суммарные графики активности в трее, процесс с максимальной активностью
Сетевые соединения процесса
Потоки процесса, их активность, стек потока с загрузкой символов
Информация по использованию памяти в системе
Handles и DLL процесса
Поиск handles и DLL
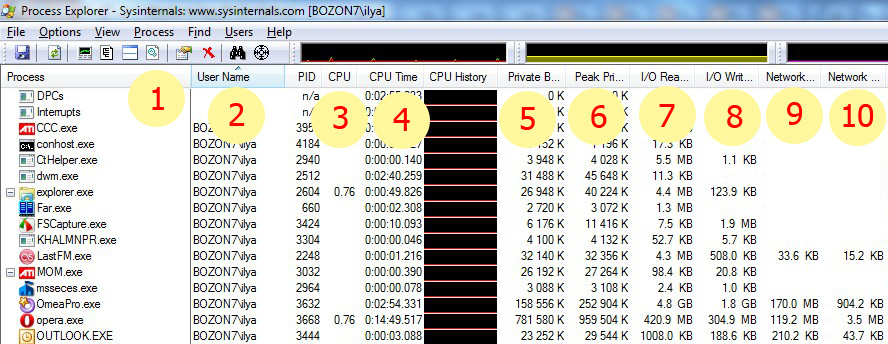
Колонки в главном окне
Для каждого процесса:
Имя процесса
Владелец процесса, я использую сортировку по этому полю, чтобы первыми шли пользовательские процессы, потом системные
Загрузка CPU процессом
Суммарное затраченное время CPU, интересно иногда обращать на это внимание, полезен для таймирования
Peak private bytes — пиковое значение Private bytes, интересно иногда взглянуть до чего дело доходило
I/O read bytes — суммарный объем считанных с диска данных, по изменению видна активность
I/O write bytes — суммарный объем записанных на диск данных, по изменению видна активность
Network receive bytes — суммарный объем считанных из сети данных, по изменению видна активность
Network send bytes — суммарный объем переданных в сеть данных, по изменению видна активность
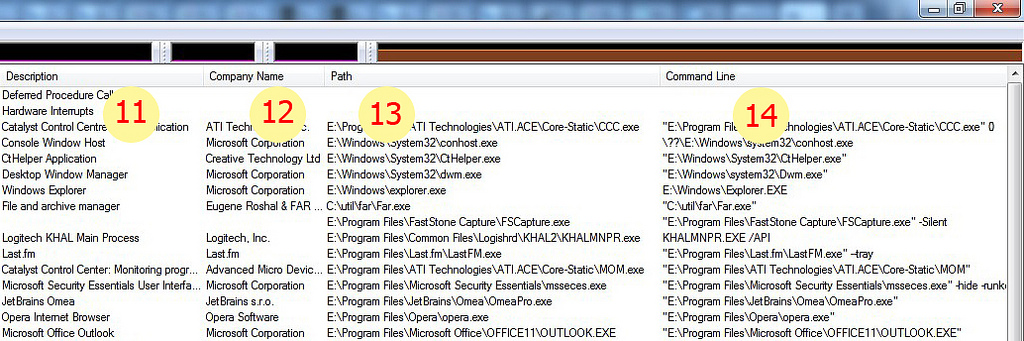
Описание процесса
Название компании
Полный путь к образу процесса (тут можно точно понять откуда стартовал процесс)
Командная строка запуска процесса
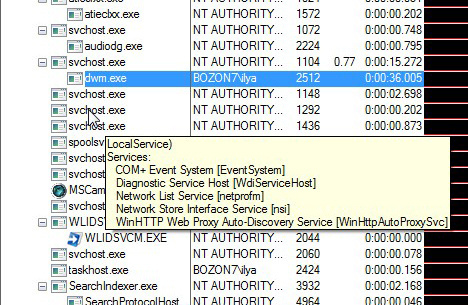
Сервисы внутри svchost
При наведении курсора на svchost (процесс который хостит в себе сервисы) можно видеть перечень сервисов – довольно полезная фича.
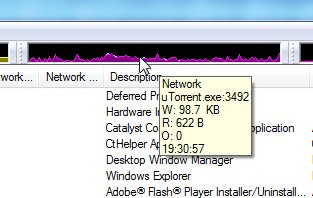
Суммарные графики активности, процесс с максимальной активностью
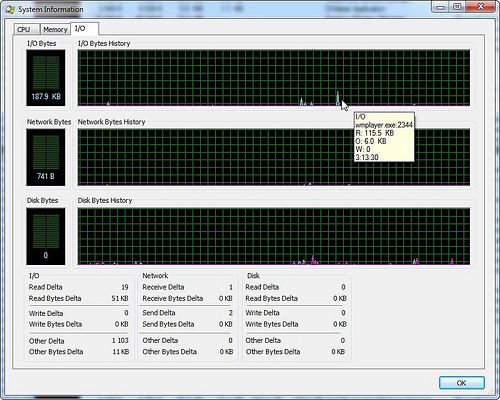
Сверху основного окна расположены графики основных суммарных параметров – память, дисковая, сетевая и CPU активность. При перемещении курсора по истории параметра, показан процесс который дал максимальный вклад в это значение в данный момент времени. Кроме того в тултипе есть информация о мгновенном значении параметра (зависит от частоты обновления). На следующей картинке — график сетевой активности.
В окне «system information» графики собраны вместе, здесь удобнее смотреть корреляцию параметров.
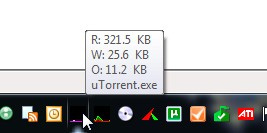
Суммарные графики активности в трее, процесс с максимальной активностью
Очень удобная фича – выведение в трей иконок с графиками суммарной активности. Там могут быть графики дисковой активности, CPU и память. Я использую первые два – поглядываю туда, при возникновении вопросов достаточно навести курсор и узнать какой процесс дает максимальный вклад в параметр. К сожалению сетевую активность туда нельзя выставить, я надеюсь это вопрос времени.
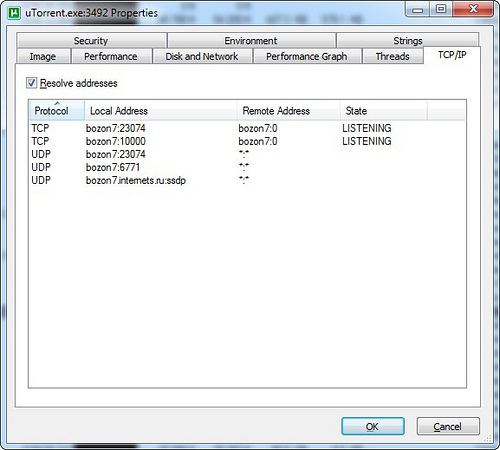
Сетевые соединения процесса
В свойствах процесса в закладке TCP/IP можно посмотреть текущие активные соединения. К сожалению сетевая активность по ним не видна, эта функциональность пока доступна в другой утилите – tcpview.
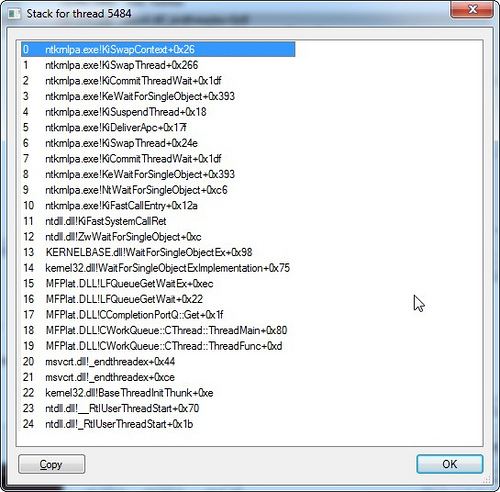
Потоки процесса, их активность, стек потока с загрузкой символов
В свойствах процесса в закладке threads видны все его потоки и загрузка CPU по потокам. Допустим хочется рассмотреть стек потока, который интенсивно что-то делает или висит. Для этого сперва надо его распознать, допустим по загрузке CPU, потом полезно приостановить процесс, чтобы спокойно рассмотреть его состояние — это можно сделать прямо в этом окне по кнопке “suspend”. Далее выделяем поток и нажимаем “stack”. В большинстве случаев стек будет начинаться в недрах системы и обрываться не совсем понятным образом. Дело в том, что не имея отладочной информации по системным библиотекам не удастся корректно развернуть стек и разобраться в нем. Есть решение – нужно сконфигурировать доступ с символьной информации с сайта Microsoft. Надо проделать несколько шагов:
Установить Debugging Tools. Из приведенной ссылки надо пойти по ссылке “Debugging Tools for Windows 32-bit Versions” или “Debugging Tools for Windows 64-bit Versions”. Далее выбрать для скачивания последнюю версию не интегрированную в SDK, иначе это выльется в скачивание огромного объема SDK, а так всего несколько Mb.
Настроить доступ к символам в Process Explorer. Options –> Configure Symbols. В одном поле задаем путь к dbghelp.dll, которая находится внутри установленного продукта из шага 1. Во втором настраиваем такую хитрую строку: “srv*C:\Symbols*http://msdl.microsoft.com/download/symbols”. Часть строки указывает на локальный кэш для PDB файлов, вторая часть на путь к серверу для скачивания.
Теперь список потоков и стек будут более информативны. При открытии этих окон может происходить задержка на время подкачки PDB файлов с сервера Microsoft, но делается это один раз для каждой версии модуля, результат кэшируется в выбранной папке.
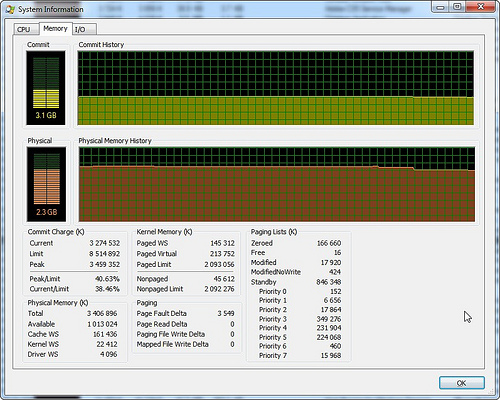
Информация по использованию памяти в системе
В окне «system information» закладка «memory». Здесь есть два графика – commit и physical. Physical – использование физической памяти без учета файлового кэша, под который уходит все что остается. Commit – сколько памяти выделено для процессов включая используемую виртуальную память. Под графиками в разделе «Commit Charge» есть поля Limit и Peak. Limit определяется суммой физической и виртуальной памяти, т.е. это максимальный суммарный объем памяти, который может выделить система. Peak – это максимум графика Commit за время работы утилиты. Процентные соотношения Current/Limit и Peak/Limit удобны для быстрой оценки насколько состояние системы приближалось к критическому лимиту по доступной памяти.
Handles и DLL процесса
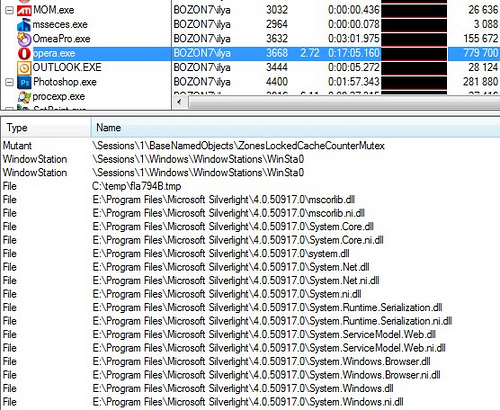
В главном окне можно включить разделитель и снизу отображать DLL или handles выделенного процесса. При борьбе с вирусами и отладке программ это бывает очень полезно. На картинке — список handles для opera, первый handle файловой системы – это flash ролик в временном каталоге.
Для DLL можно добавить колонку с полным путем к образу, отсортировав по нему, проанализировать нет ли каких подозрительных модулей. На картинке видно, что подключен модуль от Logitech, есть подозрение что это что-то типа хука внедряющегося во все процессы. Следующим пунктом посмотрим где он еще встречается.
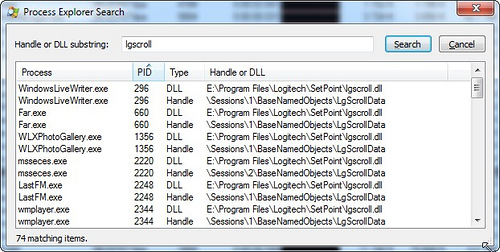
Поиск handles и DLL
Поиск по имени handle или DLL во всех процессах. Вводим имя DLL от Logitech из предыдущего пункта и убеждаемся что подключается он почти везде.
Другой пример – надо понять, кто блокирует файл или работает с папкой. Вводим часть пути и находим все процессы, которые открыли подобные объекты системы. Можно щелкнуть на элементе из списка и перейти к процессу, при этом будет подсвечен соответствующий handle или DLL.
PS Для отображения некоторых полей (например сетевая статистика) требуются административные привилегии. Повысить привилегии в уже запущенном Process Explorer можно с помощью команды в меню File. Только при наличии таких привилегий есть возможность добавить такие колонки. Я считаю такое поведение неверным, т.к. скрывает потенциальные возможности приложения от пользователя. Если поля добавлены и при следующем запуске нет административных прав, то они будут пустыми. Можно задать ключ «/e» в командной строке, чтобы форсировать поднятие привилегий при старте Process Explorer.