- Dns сервер windows логи
- DNS Logging and Diagnostics
- DNS logging and diagnostics
- Performance considerations
- Debug logging
- Audit and analytic event logging
- Installing and enabling DNS diagnostic logging
- To install DNS diagnostic logging
- To enable DNS diagnostic logging
- Using DNS server audit and analytic events
- Using ETW consumers
- Audit events
- Отладочное протоколирование и отслеживание активности DNS
Dns сервер windows логи
To turn on DNS logging for a Microsoft Windows Server 2012 system which is functioning as a DNS server, take the following steps:
- Hit Ctrl-Esc.
- Click on Administrative Tools.
- Select DNS.
- Right-click on the DNS server and select Properties.
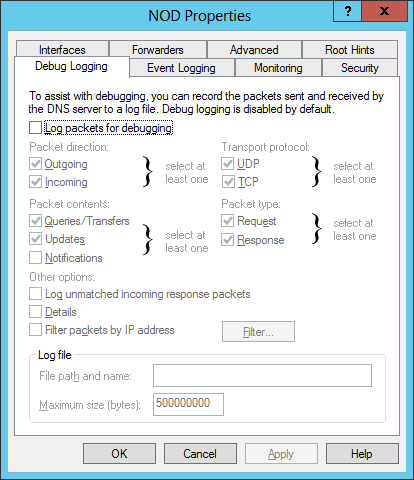
- Click on the Debug Logging tab.
If you wish to delete an existing log file that is in use and start a new one, right-click on the DNS server in the DNS Manager window, select All Tasks, then Stop. You can then move or delete the log file, right-click on the DNS server again, select All Tasks, then Start to restart logging.
When you check the log file, entries will appear such as the following:
The entries above show the system with IP address 192.168.0.42 queried the DNS server for the address of imap-mail.outlook.com. The Windows Server 2012 DNS server did not know the IP address, so it in turn queried a DNS forwarder system at 10.255.176.137. It received a response from the DNS forwarder and returned the response to the system at 192.168.0.42. The numbers you see for (9)imap-mail(7)outlook(3)com(0) reflect the number of characters in various parts of the address. E.g., imap-mail is 9 characters, outlook is 7 characters, and com is 3 characters.
A valuable and free tool which can aid you in examining Microsoft Windows DNS log files is Windows DNS Log Analyser.
If you wish to rotate the log file daily, you can use the instructions at Rotate the DNS server log file on a Windows server, though, since the at command is deprecated, you will need to use the schtasks command, instead of the at command. A command similar to the one shown below can be used to run the batch file at one minute after midnight every night:
I can check on the status of the avove scheduled task as shown below:
In the above example, the task was submitted on February 19, 2015.
DNS Logging and Diagnostics
Applies To: Windows Server 2012 R2
Enhanced DNS logging and diagnostics is available by default in Windows ServerВ® 2016 Technical Preview. This feature is also available in Windows ServerВ® 2012 R2 when you install the query logging and change auditing hotfix, available from https://support.microsoft.com/kb/2956577.
DNS logging and diagnostics
See the following sections in this topic:
Performance considerations
DNS server performance can be affected when additional logging is enabled, however the enhanced DNS logging and diagnostics feature in Windows Server 2012 R2 and Windows Server 2016 Technical Preview is designed to have a very low impact on performance. The following sections discuss DNS server performance considerations when additional logging is enabled.
Debug logging
Prior to the introduction of DNS analytic logs, DNS debug logging was an available method to monitor DNS transactions. DNS debug logging is not the same as the enhanced DNS logging and diagnostics feature discussed in this topic. Debug logging is discussed here because it is also a tool that is available for DNS logging and diagnostics. See Using server debugging logging options for more information about DNS debug logging. The DNS debug log provides extremely detailed data about all DNS information that is sent and received by the DNS server, similar to the data that can be gathered using packet capture tools such as network monitor. Debug logging can affect overall server performance and also consumes disk space, therefore it is recommended to enable debug logging only temporarily when detailed DNS transaction information is needed.
Audit and analytic event logging
Enhanced DNS logging and diagnostics in Windows Server 2012 R2 and later includes DNS Audit events and DNS Analytic events. DNS audit logs are enabled by default, and do not significantly affect DNS server performance. DNS analytical logs are not enabled by default, and typically will only affect DNS server performance at very high DNS query rates. For example, a DNS server running on modern hardware that is receiving 100,000 queries per second (QPS) can experience a performance degradation of 5% when analytic logs are enabled. There is no apparent performance impact for query rates of 50,000 QPS and lower. However, it is always advisable to monitor DNS server performance whenever additional logging is enabled.
Installing and enabling DNS diagnostic logging
Perform the following procedures to install and enable DNS diagnostic logging on Windows Server 2012 R2. To install DNS diagnostic logging, the computer must be running the DNS Server role service.
If the DNS server is running Windows Server 2016 Technical Preview or later, diagnostic logging is already installed and you can skip the first procedure, performing only the steps in To enable DNS diagnostic logging below.
Membership in the Administrators group, or equivalent, is the minimum required to complete these procedures. Review details about using the appropriate accounts and group memberships at Local and Domain Default Groups (https://go.microsoft.com/fwlink/?LinkId=83477).
To install DNS diagnostic logging
If the DNS server is running Windows Server 2012 R2, download the hotfix from https://support.microsoft.com/kb/2956577.
Double-click the self-extracting file, for example 475151_intl_x64_zip.exe.
In the Microsoft Self-Extractor dialog box, click Continue.
Type a location where you want to save the extracted files, for example C:\hotfix. If the directory does not yet exist, you will be asked if you wish to create it. Click Yes and confirm that All files were successfully unzipped is displayed, then click Ok.
In the location where files were unzipped, double-click the Windows Update file, for example Windows8.1-KB2956577-v2-x64.msu.
The Windows Update Standalone Installer will verify that the computer meets requirements to install the update. These requirements include some prerequisite updates. When verification is complete, click Yes when asked if you wish to install the Hotfix for Windows (KB2956577).
If recently downloaded updates have not yet been installed, you might need to restart the computer before the current hotfix can be installed. If this is required, you must restart the computer first and then run the Windows8.1-KB2956577-v2-x64.msu a second time after the computer has completed installing necessary updates. The Windows Update Standalone Installer will notify you that installation of the hotfix is not yet complete. If this happens, and you are prompted to restart the computer, click Restart Now.
If the computer is ready to install the update when you run the hotfix, installation will complete and you must restart the computer for the update to take effect. If Installation complete is displayed, click Restart Now for the update to take effect.
You can confirm that the hotfix was successfully installed by viewing installed updates in the Programs and Features control panel. If the update is successfully installed, Hotfix for Microsoft Windows (KB2956577) will be displayed. You can also verify installation of the hotfix by typing wmic qfe | find «KB2956577» at an elevated command prompt. The URL and date of installation for the hotfix will be displayed if it was successfully installed.
To enable DNS diagnostic logging
Type eventvwr.msc at an elevated command prompt and press ENTER to open Event Viewer.
In Event Viewer, navigate to Applications and Services Logs\Microsoft\Windows\DNS-Server.
Right-click DNS-Server, point to View, and then click Show Analytic and Debug Logs. The Analytical log will be displayed.
Right-click Analytical and then click Properties.
Under When maximum event log size is reached, choose Do not overwrite events (Clear logs manually), select the Enable logging checkbox, and click OK when you are asked if you want to enable this log. See the following example.
.jpeg)
Click OK again to enable the DNS Server Analytic event log.
By default, analytic logs are written to the file: %SystemRoot%\System32\Winevt\Logs\Microsoft-Windows-DNSServer%4Analytical.etl.
See the following sections for details about events that are displayed in the DNS server audit and analytic event logs.
Using DNS server audit and analytic events
DNS logs are compatible with Event Tracing for Windows (ETW) consumer applications such as logman, tracelog, and message analyzer. For more information about using event tracing, see About Event Tracing.
Using ETW consumers
You can use ETW consumers such as tracelog.exe with DNS server audit and analytic events by specifying a GUID of .
You can get tracelog.exe by downloading and installing the Windows Driver Kit (WDK). Tracelog.exe is included when you install the WDK, Visual Studio, and the Windows SDK for desktop apps. For information about downloading the kits, see Windows Hardware Downloads. For example, when you download and install Windows Driver Kit (WDK) 8 and accept the default installation path, tracelog.exe is available at C:\Program Files (x86)\Windows Kits\8.0\Tools\x64\tracelog.exe.
For more information about using tracelog.exe, see Tracelog Command Syntax. The following examples demonstrate how to use tracelog.exe with DNS audit and analytic event logs:
The following command will enable both analytical and audit logging:
While the trace is active, all analytical and audit events will be recorded in the C:\analytic_audit.etl file that was specified on the command line. You can stop tracing by issuing a stop command:
After stopping the trace, you can view the .etl file in Event Viewer by clicking Action and then clicking Open Saved Log. See the following example.
.jpeg)
The following example enables just the analytical channel and matches only the keywords to 0x7FFFF:
A logging level of 5 is used in the previous examples. The following logging levels are available:
Only critical events are logged, for example process exit or termination. If no logging level is given by the user this level is used by default.
Only severe error events are logged, for example failures to complete a required task.
Errors that can cause a service issue, but are acceptable or recoverable, for example the first attempt to contact a forwarder has failed.
Very high-level events are recorded in the event log. These might include one message for each major task performed by the service. Use this setting to begin an investigation when the location of the problem is in doubt, for example a scavenger thread was started.
All events are logged. This provides a complete log of the operation of the service. Use this level when the problem is traced to a particular category or a small set of categories.
Audit events
DNS server audit events enable change tracking on the DNS server. An audit event is logged each time server, zone, or resource record settings are changed. This includes operational events such as dynamic updates, zone transfers, and DNSSEC zone signing and unsigning. The following table summarizes DNS server audit events.
Table 1: DNS Server Audit Events
Отладочное протоколирование и отслеживание активности DNS

Как правило, журнал событий DNS-сервер (DNS Server) используется для наблюдения за деятельностью DNS-сервера. В этом журнале записаны вес события DNS, а просмотреть его можно в узле Просмотр событий (Event View) консоли Управление компьютером (Computer Management). При поиске неисправностей DNS весьма полезной может оказаться настройка временного журнала для отслеживания определенных событий DNS. Не забывайте очищать события после окончания отладки.
Чтобы настроить отладку, выполните следующие действия:
1. В консоли Диспетчер DNS (DNS Manager) щелкните правой кнопкой нужный сервер и в контекстном меню выберите Свойства (Properties).
2. На вкладке Ведение журнала отладки (Debug Logging), установите флажок Записывать пакеты в журнал для отладки (Log Packets For Debugging). Затем установите флажки событий, временное наблюдение за которыми хотите вести.
3. В поле Имя и путь к файлу (File Path And Name) введите имя файла журнала, например, dns.log. По умолчанию журналы хранятся в папке %SystemRoot%\System32\Dns.
4. Щелкните ОК. Завершив отладку, отключите протоколирование, сбросив флажок Записывать пакеты в журнал для отладки (Log Packets For Debugging).


