- Overview of USB Event Tracing for Windows
- About Event Tracing for Windows
- USB Support for ETW Logging
- USB ETW Support in Windows 7
- USB ETW Support in Windows 8
- About Event Tracing
- Controllers
- Providers
- Types of Providers
- MOF (classic) providers:
- WPP providers:
- Manifest-based providers:
- TraceLogging providers:
- Consumers
- Missing Events
- How to view a USB ETW trace in Netmon
- Opening an ETW file
- New columns the USB ETW parser for USB 3.0 driver stack
- Adding filters to the Display Filter pane
Overview of USB Event Tracing for Windows
This topic provides information for client driver developers about the tracing and logging features for Universal Serial Bus (USB). This information is provided for the benefit of those who develop and debug USB devices. It includes information on how to install the tools, create trace files, and analyze the events in a USB trace file. The topic assumes that you have a comprehensive understanding of the USB ecosystem and hardware that is required to successfully use the USB tracing and logging features.
About Event Tracing for Windows
Event Tracing for Windows (ETW) is a general-purpose, high-speed tracing facility that is provided by the operating system. It uses a buffering and logging mechanism that is implemented in the kernel to provide a tracing mechanism for events that are raised by both user-mode applications and kernel-mode device drivers. Additionally, ETW provides the ability to dynamically enable and disable logging, which makes it easy to perform detailed tracing in production environments without requiring reboots or application restarts. The logging mechanism uses per-processor buffers that are written to disk by an asynchronous writer thread. This buffering allows large-scale server applications to write events with minimum disturbance.
ETW was introduced in Windows 2000. Since then, various core operating system and server components have adopted ETW to instrument their activities. ETW is now one of the key instrumentation technologies on Windows platforms. A growing number of third-party applications use ETW for instrumentation, and some take advantage of the events that Windows provides. ETW has also been abstracted into the Windows preprocessor (WPP) software tracing technology, which provides a set of easy-to-use macros for tracing printf-style messages for debugging during development.
ETW was significantly upgraded for Windows Vista and Windows 7. One of the most significant new features is the unified event provider model and APIs. In short, the new unified APIs combine logging traces and writing to the Event Viewer into one consistent, easy-to-use mechanism for event providers. At the same time, several new features have been added to ETW to improve the developer and end-user experiences.
For more information about ETW and WPP, see Event Tracing and Event Tracing for Windows (ETW).
USB Support for ETW Logging
USB is one of the most prevalent means of connecting an ever-increasing variety of peripheral devices to PCs. There is a very large installed base of USB host PCs and USB peripheral devices, and system vendors, device vendors, and end users expect and demand that USB devices operate flawlessly at the system and device level.
The large installed base and proliferation of USB devices have uncovered compatibility issues between the Windows USB software stack, the USB host controller, and USB devices. These compatibility issues cause problems for customers such as device operation failures, system hangs, and system crashes.
It has been difficult or impossible to investigate and debug USB device issues without direct access to the system, and/or devices, or in some cases a system crash dump. Even with full access to the hardware and a crash dump, extracting the relevant information has been a time-intensive technique that is known only by a few core USB driver developers. You can debug USB problems by using hardware or software analyzers, but they are very expensive and are available to only a small percentage of professionals.
USB ETW Support in Windows 7
In Windows 7, ETW provides an event logging mechanism that the USB driver stack can exploit to aid in investigating, diagnosing, and debugging USB-related issues. USB driver stack ETW event logging supports most or all debugging capabilities that are provided by the existing ad hoc logging mechanism in the USB driver stack, without any of its limitations. This translates into ease of debugging USB-related issues, which should provide a more robust USB driver stack in the long term.
We added ETW logging to the USB host controller drivers and to the USB hub driver in Windows 7. The USB host controller driver layer includes the host controller port driver (usbport.sys) and the miniport drivers (usbehci.sys, usbohci.sys, and usbuhci.sys). The USB hub driver layer consists of the USB hub driver (usbhub.sys). The USB driver ETW event providers are included in all editions and SKUs of Windows 7.
While USB event collection is enabled, the USB hub event provider reports the addition and removal of USB hubs, the device summary events of all hubs, and port status changes. You can use these events to determine the root cause of most device enumeration failures.
USB Port Events
While USB event collection is enabled, the USB port event provider reports I/O from client drivers, opening and closing of device endpoints, and miniport state transitions such as miniport start and stop. Logged I/O includes requests for the state of physical USB ports. State transitions on physical USB ports are one of the key initiators of activity in the core USB driver stack.
USB ETW Support in Windows 8
WindowsВ 8 provides a USB driver stack to support USB 3.0 devices. The Microsoft-provided USB 3.0 driver stack consists of three drivers: Usbxhci.sys, Ucx01000.sys, and Usbhub3.sys. All three drivers work together to add native support to Windows for most USB 3.0 host controllers. The new driver stack supports SuperSpeed, high-speed, full-speed, and low-speed devices. The USB 2.0 driver stack is supported on Windows 8. Through event traces, the USB 3.0 driver stack provides a view into the fine-grained activity of the host controller and all devices connected to it.
USB Hub3 Events
While USB event collection is enabled, the USB Hub3 event provider reports the addition and removal of USB hubs, the device summary events of all hubs, port status changes, and power states of USB devices and hubs. Port status changes are state transitions on physical USB ports and are one of the key initiators of activity in the core USB driver stack. Hub3 reports the stages of the enumeration process, which point to the root cause most device enumeration failures. With the StateMachine keyword enabled, Hub3 reports the internal state machine activity for software device, hub, and port objects, which provide deeper visibility into the logic of the driver.
While USB event collection is enabled, the USB UCX event provider reports I/O from client drivers and opening and closing of device endpoints and endpoint streams. With the StateMachine keyword enabled, UCX reports internal state machine activity for host controller and endpoint objects, which provide deeper visibility into the logic of the driver.
USB xHCI Events
While USB event collection is enabled, the USB xHCI event provider reports the properties of the system’s xHCI controllers and low-level details of xHCI operation. xHCI reports command requests sent to and completed by the xHCI hardware, including xHCI-specific completion codes.
About Event Tracing
Event Tracing for Windows (ETW) is an efficient kernel-level tracing facility that lets you log kernel or application-defined events to a log file. You can consume the events in real time or from a log file and use them to debug an application or to determine where performance issues are occurring in the application.
ETW lets you enable or disable event tracing dynamically, allowing you to perform detailed tracing in a production environment without requiring computer or application restarts.
The Event Tracing API is broken into three distinct components:
- Controllers, which start and stop an event tracing session and enable providers
- Providers, which provide the events
- Consumers, which consume the events
The following diagram shows the event tracing model.
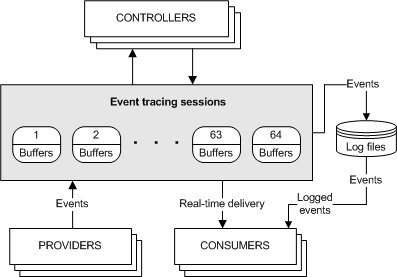
Controllers
Controllers are applications that define the size and location of the log file, start and stop event tracing sessions, enable providers so they can log events to the session, manage the size of the buffer pool, and obtain execution statistics for sessions. Session statistics include the number of buffers used, the number of buffers delivered, and the number of events and buffers lost.
Providers
Providers are applications that contain event tracing instrumentation. After a provider registers itself, a controller can then enable or disable event tracing in the provider. The provider defines its interpretation of being enabled or disabled. Generally, an enabled provider generates events, while a disabled provider does not. This lets you add event tracing to your application without requiring that it generate events all the time.
Although the ETW model separates the controller and provider into separate applications, an application can include both components.
For more information, see Providing Events.
Types of Providers
There are four main types of providers: MOF (classic) providers, WPP providers, manifest-based providers, and TraceLogging providers. You should use a manifest-based provider or a TraceLogging provider if you are writing applications for WindowsВ Vista or later that do not need to support legacy systems.
MOF (classic) providers:
- Use the RegisterTraceGuids and TraceEvent functions to register and write events.
- Use MOF classes to define events so that consumers know how to consume them.
- Can be enabled by only one trace session at a time.
WPP providers:
- Use the RegisterTraceGuids and TraceEvent functions to register and write events.
- Have associated TMF files (compiled into a binary’s .pdb) containing decoding information inferred from the preprocessor’s scan of WPP instrumentation in source code.
- Can be enabled by only one trace session at a time.
Manifest-based providers:
- Use EventRegister and EventWrite to register and write events.
- Use a manifest to define events so that consumers know how to consume them.
- Can be enabled by up to eight trace sessions simultaneously.
TraceLogging providers:
- Use TraceLoggingRegister and TraceLoggingWrite to register and write events.
- Use self-describing events so that the events themselves contain all required information for consuming them.
- Can be enabled by up to eight trace sessions simultaneously.
All event providers fundamentally use the Event Tracing family of APIs (TraceEvent for legacy technologies and EventWrite/EventWriteEx for newer ones). Event providers simply differ in what field types they store in event payloads and where they store the associated event decoding information.
Consumers
Consumers are applications that select one or more event tracing sessions as a source of events. A consumer can request events from multiple event tracing sessions simultaneously; the system delivers the events in chronological order. Consumers can receive events stored in log files, or from sessions that deliver events in real time. When processing events, a consumer can specify start and end times, and only events that occur in the specified time frame will be delivered.
For more information, see Consuming Events.
Missing Events
Perfmon, System Diagnostics, and other system tools may report on missing events in the Event Log and indicate that the settings for Event Tracing for Windows (ETW) may not be optimal. Events can be lost for a number of reasons:
The total event size is greater than 64K. This includes the ETW header plus the data or payload. A user has no control over these missing events since the event size is configured by the application.
The ETW buffer size is smaller than the total event size. A user has no control over these missing events since the event size is configured by the application logging the events.
For real-time logging, the real-time consumer is not consuming events fast enough or is not present altogether and then the backing file is filling up. This can result if the Event Log service is stopped and started when events are being logged. A user has no control over these missing events.
When logging to a file, the disk is too slow to keep up with the logging rate.
For any of these reasons, please report these problems to the provider of the application or service that is generating the events. These issues can only be fixed by the application developer or the service logging the events. If the missing events are being reported in the Event Log Service, this may indicate a problem with the configuration of the Event Log service. The user may have some limited ability to increase the maximum disk space to be used by the Event Log Service which may reduce the number of missing events.
How to view a USB ETW trace in Netmon
This topic describes how to example a event trace file by using Netmon.
After you install Netmon and configure it for use with USB ETW files, as described in How to install Netmon and the USB ETW Parsers, you can use it to examine a trace file.
Opening an ETW file
To view a trace file in Netmon, on the Start screen, type «netmon» to open Netmon. Open the trace file by using one of the following methods:
- On the File menu, click Open, click Capture, and then select the .etl file.
- Click the Open Capture button and select the .etl file.
- Press CTRL+O and select the .etl file.
An event trace is made up of individual events, each of which indicates something that happened in the driver stack. Each event conforms to one of several types defined by the driver stack.
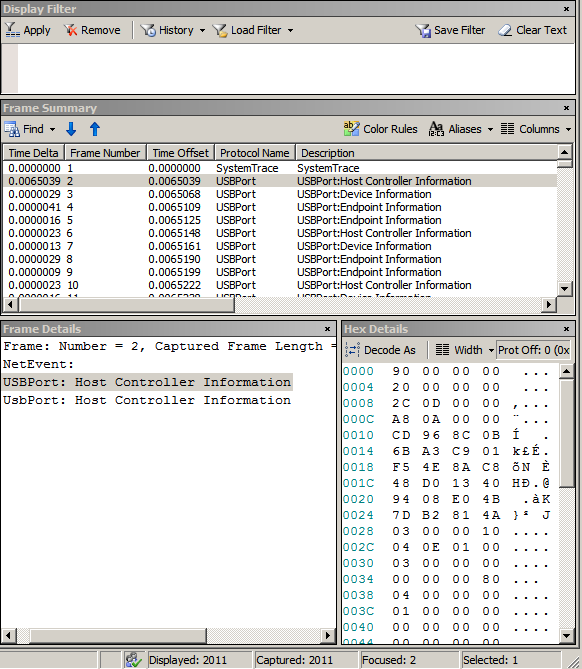
Observe that the events are listed in the Frame Summary pane. The preceding image shows evens from USB 2.0 driver stack. Note the following columns in this pane:
- Time Offset: The timestamp for the event, specified as an offset from the start time of the log.
- Protocol Name: The driver that logged the event. For USB events, the driver is USB Hub or USB Port.
- Description: A descriptive name for the event.
Select an event in the Frame Summary pane. Netmon displays the details for the event in the Frame Details and Hex Details panes. In the Frame Details pane, expand the items to examine the details of the event. For an example of using Netmon to examine a USB trace file, see Case Study: Troubleshooting an Unknown USB Device by Using ETW and Netmon.
New columns the USB ETW parser for USB 3.0 driver stack
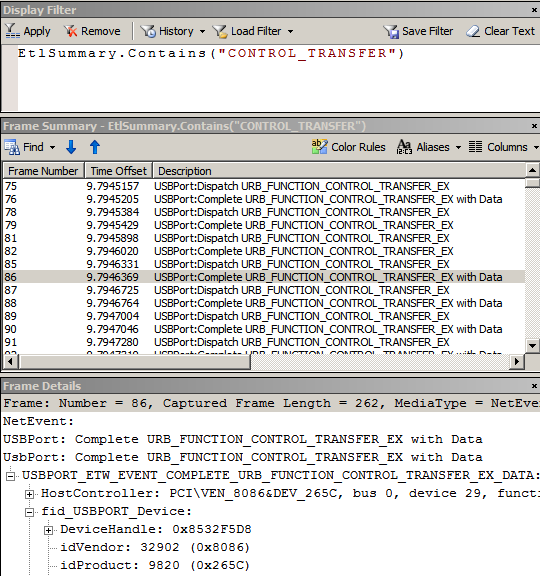
Important types of events from the USB 2.0 driver stack are also defined in the USB 3.0 driver stack. However, there are subtle differences between those types. For example, consider the USB control transfer completion event type (Description : USBPort:Complete URB_FUNCTION_CONTROL_TRANSFER_EX with Data):
For USB 2.0 driver stack event type, Frame Details pane shows idVendor (also known as USB VID) and idProduct (also known as USB PID). This image shows event trace for a USB 2.0 device connected to USB 2.0 host controller.
For USB 3.0 driver stack event type, Frame Details pane does not contain idVendor or idPid. That information is available by adding new columns to the Frame Summary pane as shown in this image.
Notice these new columns:
- USB Device Description
- USB Vid
- USB Pid
- USB Length
- USB Request Duration
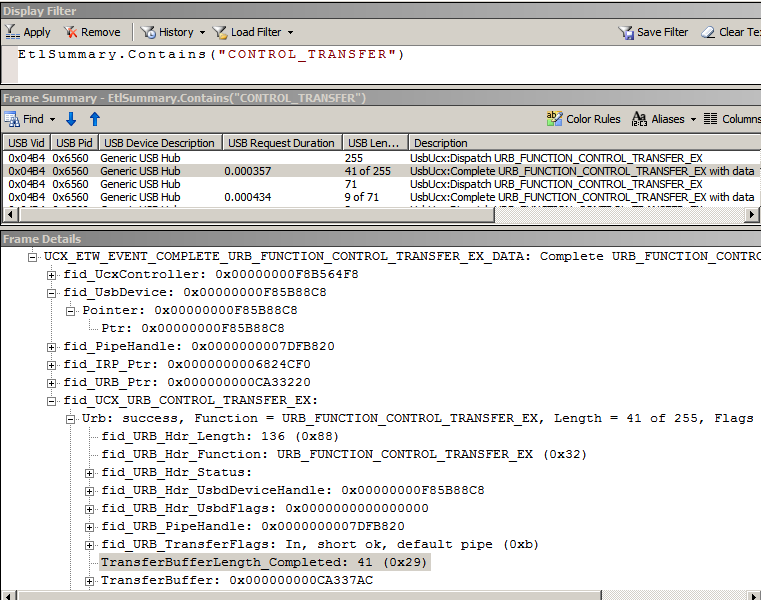
All USB event traces (USB 2.0 and USB 3.0) now show more information about the request as each URB completes. Notice values, such as, «41 of 255» under USB Length. Those values indicate the actual transfer length of each URB on completion with the context of the total request length (original TransferBufferLength specified by the client driver). Also, you can see how long (in seconds) it took for a request to complete under the USB Request Duration column.
Adding filters to the Display Filter pane
You can use capture filters to narrow down the event traces for a specific scenario. You can write new filters for event traces from USB 2.0 and USB 3.0 driver stacks:
All columns can be filtered. To create a filter, right-click a cell and select Add » » to Display Filter. Netmon creates a filter based on its value and the column name and adds it under the Display Filter pane.


