Windows® Setup creates log files for all actions that occur during installation. If you are experiencing problems installing Windows, consult the log files to troubleshoot the installation.
WindowsВ Setup log files are available in the following directories:
Log file location
Description
Log location before Setup can access the drive.
Log location when Setup rolls back in the event of a fatal error.
Log location of Setup actions after disk configuration.
Used to log Plug and Play device installations.
Location of memory dump from bug checks.
Location of log minidumps from bug checks.
Location of Sysprep logs.
WindowsВ Setup Event Logs
WindowsВ Setup includes the ability to review the WindowsВ Setup performance events in the Windows Event Log viewer. This enables you to more easily review the actions that occurred during WindowsВ Setup and to review the performance statistics for different parts of WindowsВ Setup. You can filter the log so as to view only relevant items that you are interested in. The WindowsВ Setup performance events are saved into a log file that is named Setup.etl, which is available in the %WINDIR%\Panther directory of all installations. To view the logs, you must use the Event Viewer included with the Windows media that corresponds to the version of the customized image that you are building.
To view the logs on a computer that does not include the corresponding kit, you must run a script from the root of the media that installs the Event Trace for Windows (ETW) provider. From the command line, type:
where D is the drive letter of the Windows DVD media.
To view the WindowsВ Setup event logs
Start the Event Viewer, expand the Windows Logs node, and then click System.
In the Actions pane, click Open Saved Log and then locate the Setup.etl file. By default, this file is available in the %WINDIR%\Panther directory.
The log file contents appear in the Event Viewer.
To Export the log to a file
From the command line, use the Wevtutil or Tracerpt commands to save the log to an .xml or text file. For information about how to use these tools, see the command-line Help. The following commands show examples of how to use the tools:
Event Logging (Windows Installer)
Windows Events provides a standard, centralized way for applications (and the operating system) to record important software and hardware events. The event-logging service stores events from various sources in a single collection called an event log. Prior to WindowsВ Vista, you would use either Event Tracing for Windows (ETW) or Event Logging to log events. WindowsВ Vista introduced a new eventing model that unifies both ETW and the Windows Event Log API.
The installer also writes entries into the event log. These record events such as following:
Success or failure of the installation; removal or repair of a product.
Errors that occur during product configuration.
Detection of corrupted configuration data.
If a large amount of information is written, the Event Log file can become full and the installer displays the message, «The Application log file is full.»
The installer may write the following entries in the event log. All event log messages have a unique event ID. All general errors authored in the Error table that are returned for an installation that fails are logged in the Application Event Log with a message ID equal to the Error + 10,000. For example, the error number in the Error table for an installation completed successfully is 1707. The successful installation is logged in the Application Event Log with a message ID of 11707 (1707 + 10,000).
For information about how to enable verbose logging on a user’s computer when troubleshooting deployment, see Windows Installer Best Practices.
Windows Event Logs — Event Log FAQ
What is Windows event log?
Event logs are special files that record significant events on your computer, such as when a user logs on to the computer or when a program encounters an error. Whenever these types of events occur, Windows records the event in an event log. Users might find the details in event logs helpful when troubleshooting problems with Windows and other programs.
Unlike UNIX syslog, Microsoft event log is not a text file and it is impossible to view it with simple text editors. Microsoft Windows event log is a binary file that consists of special records – Windows events.
Microsoft Windows runs Event Log Service to manage event logs, configure event publishing, and perform operations on the logs. Windows Event Log service exposes a special API, which allows applications to maintain and manage event logs.
Windows event logging was introduced in Windows NT operating system (version 3.1) in 1993. This Windows edition came with three Windows logs: Application event log, System event log and Security event log. Modern versions of Windows come with more than a hundred of Windows eventlogs, and third party applications can create and integrate into Windows logging their own event logs.
How to view event logs?
You can view eventlogs using Event Viewer (comes with Windows operating system) or third-party Windows event viewers. We recommend using our Event Log Explorer software – it provides a lot of advanced features for event log management.
What is Windows Event Log Service?
Windows Event Log Service is a Windows service that manages events and event logs. It supports logging events, querying events, subscribing to events, archiving event logs, and managing event metadata. It helps to display events in both XML and plain text format. This service is enabled and starts automatically by default. You should not stop or disable this service. Stopping Windows Event Log service may compromise security and reliability of the system.
What are Windows event log files?
Windows Event Log Service lets users to save (backup) event logs to files. Windows NT, 2000 and XP/2003 save event logs to EVT format. Windows Vista/2008 and better save logs to EVTX format. Having backup event files are essential for incident investigation.
Windows event logs are also files, but they are commonly locked by Windows (Event Log Service) and it is impossible to open these files on «live» system. But if the computer is started from another disk or the system drive from the analyzed machine is connected to another computer, you can read event logs as files. The default location of event logs on Vista/2008 and better is «C:\Windows\System32\winevt\Logs\». Windows Event Viewer allows you to open event file as follows:
Click Open Saved Log in Actions pane of Event Viewer.
Select your event log file and it will appear in Windows Event Viewer as a log.
Our Event Log Explorer software also works with event files and does it even better than Event Viewer, e.g. it lets you read even damaged event files.
What is Windows Application event log?
The Application log contains events logged by applications or programs. For example, a database program might record a file error in the application log. Program developers decide which events should be logged. E.g. Microsoft SQL Server logs details about important events linked with SQL server, e.g. «out of memory», «backup failure» etc. One application log commonly contains events logged from different sources (applications), so it is incorrect to rely solely on event ID when analyzing the Application log. You should always rely on event ID along with event source. Some applications, such as Internet Explorer, Power Shell create own event log instead of using Windows application event log. Such logs look exactly like standard Windows event logs and Event Viewer (as well as Event Log Explorer) can read these event logs. Application logs are commonly useful for application support teams.
What is Windows System event log?
The System log contains events logged by Windows system components. For example, the failure of a driver or other system component to load during startup is recorded in the system log. The event types logged by system components are predetermined by Windows. Similarly to Application log, System event log lists events from different sources (system components) so you should not rely only on event ID when analyzing System log, instead you should rely on event ID along with event source. System logs are essential for system administrators and technicians.
Вертим логи как хотим ― анализ журналов в системах Windows
Пора поговорить про удобную работу с логами, тем более что в Windows есть масса неочевидных инструментов для этого. Например, Log Parser, который порой просто незаменим.
В статье не будет про серьезные вещи вроде Splunk и ELK (Elasticsearch + Logstash + Kibana). Сфокусируемся на простом и бесплатном.
Журналы и командная строка
До появления PowerShell можно было использовать такие утилиты cmd как find и findstr. Они вполне подходят для простой автоматизации. Например, когда мне понадобилось отлавливать ошибки в обмене 1С 7.7 я использовал в скриптах обмена простую команду:
Она позволяла получить в файле fail.txt все ошибки обмена. Но если было нужно что-то большее, вроде получения информации о предшествующей ошибке, то приходилось создавать монструозные скрипты с циклами for или использовать сторонние утилиты. По счастью, с появлением PowerShell эти проблемы ушли в прошлое.
Основным инструментом для работы с текстовыми журналами является командлет Get-Content, предназначенный для отображения содержимого текстового файла. Например, для вывода журнала сервиса WSUS в консоль можно использовать команду:
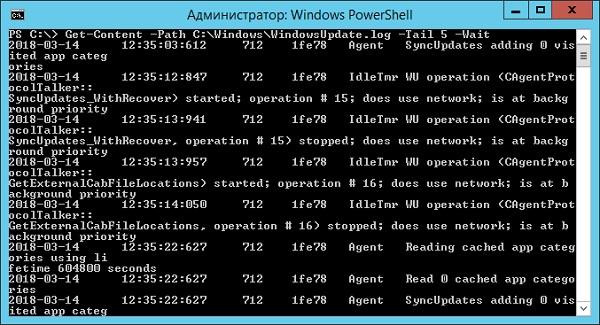
Для вывода последних строк журнала существует параметр Tail, который в паре с параметром Wait позволит смотреть за журналом в режиме онлайн. Посмотрим, как идет обновление системы командой:
Смотрим за ходом обновления Windows.
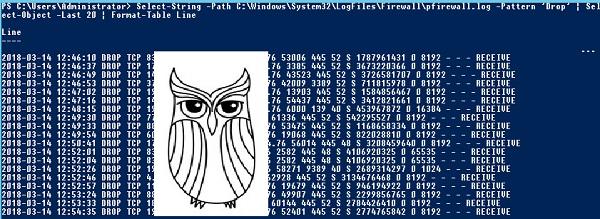
Если же нам нужно отловить в журналах определенные события, то поможет командлет Select-String, который позволяет отобразить только строки, подходящие под маску поиска. Посмотрим на последние блокировки Windows Firewall:
Смотрим, кто пытается пролезть на наш дедик.
При необходимости посмотреть в журнале строки перед и после нужной, можно использовать параметр Context. Например, для вывода трех строк после и трех строк перед ошибкой можно использовать команду:
Оба полезных командлета можно объединить. Например, для вывода строк с 45 по 75 из netlogon.log поможет команда:
Журналы системы ведутся в формате .evtx, и для работы с ними существуют отдельные командлеты. Для работы с классическими журналами («Приложение», «Система», и т.д.) используется Get-Eventlog. Этот командлет удобен, но не позволяет работать с остальными журналами приложений и служб. Для работы с любыми журналами, включая классические, существует более универсальный вариант ― Get-WinEvent. Остановимся на нем подробнее.
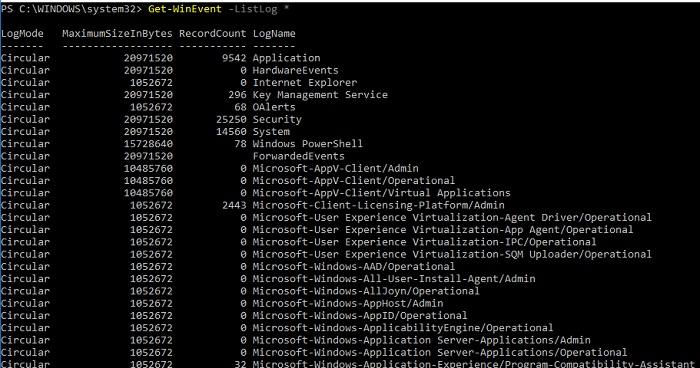
Для получения списка доступных системных журналов можно выполнить следующую команду:
Вывод доступных журналов и информации о них.
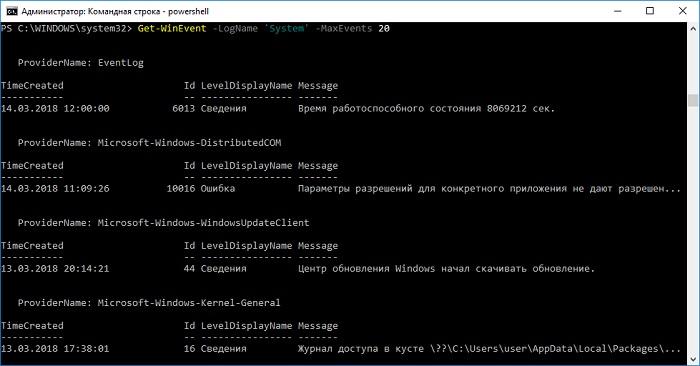
Для просмотра какого-то конкретного журнала нужно лишь добавить его имя. Для примера получим последние 20 записей из журнала System командой:
Последние записи в журнале System.
Для получения определенных событий удобнее всего использовать хэш-таблицы. Подробнее о работе с хэш-таблицами в PowerShell можно прочитать в материале Technet about_Hash_Tables.
Для примера получим все события из журнала System с кодом события 1 и 6013.
В случае если надо получить события определенного типа ― предупреждения или ошибки, ― нужно использовать фильтр по важности (Level). Возможны следующие значения:
0 ― всегда записывать;
1 ― критический;
2 ― ошибка;
3 ― предупреждение;
4 ― информация;
5 ― подробный (Verbose).
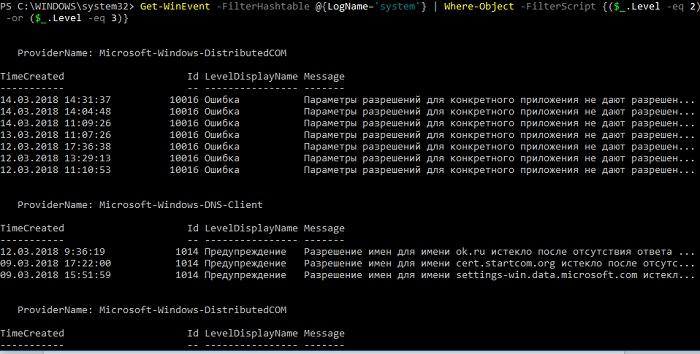
Собрать хэш-таблицу с несколькими значениями важности одной командой так просто не получится. Если мы хотим получить ошибки и предупреждения из системного журнала, можно воспользоваться дополнительной фильтрацией при помощи Where-Object:
Ошибки и предупреждения журнала System.
Аналогичным образом можно собирать таблицу, фильтруя непосредственно по тексту события и по времени.
Подробнее почитать про работу обоих командлетов для работы с системными журналами можно в документации PowerShell:
PowerShell ― механизм удобный и гибкий, но требует знания синтаксиса и для сложных условий и обработки большого количества файлов потребует написания полноценных скриптов. Но есть вариант обойтись всего-лишь SQL-запросами при помощи замечательного Log Parser.
Работаем с журналами посредством запросов SQL
Утилита Log Parser появилась на свет в начале «нулевых» и с тех пор успела обзавестись официальной графической оболочкой. Тем не менее актуальности своей она не потеряла и до сих пор остается для меня одним из самых любимых инструментов для анализа логов. Загрузить утилиту можно в Центре Загрузок Microsoft, графический интерфейс к ней ― в галерее Technet. О графическом интерфейсе чуть позже, начнем с самой утилиты.
О возможностях Log Parser уже рассказывалось в материале «LogParser — привычный взгляд на непривычные вещи», поэтому я начну с конкретных примеров.
Для начала разберемся с текстовыми файлами ― например, получим список подключений по RDP, заблокированных нашим фаерволом. Для получения такой информации вполне подойдет следующий SQL-запрос:
Посмотрим на результат:
Смотрим журнал Windows Firewall.
Разумеется, с полученной таблицей можно делать все что угодно ― сортировать, группировать. Насколько хватит фантазии и знания SQL.
Log Parser также прекрасно работает с множеством других источников. Например, посмотрим откуда пользователи подключались к нашему серверу по RDP.
Работать будем с журналом TerminalServices-LocalSessionManager\Operational.
Не со всеми журналами Log Parser работает просто так ― к некоторым он не может получить доступ. В нашем случае просто скопируем журнал из %SystemRoot%\System32\Winevt\Logs\Microsoft-Windows-TerminalServices-LocalSessionManager%4Operational.evtx в %temp%\test.evtx.
Данные будем получать таким запросом:
Смотрим, кто и когда подключался к нашему серверу терминалов.
Особенно удобно использовать Log Parser для работы с большим количеством файлов журналов ― например, в IIS или Exchange. Благодаря возможностям SQL можно получать самую разную аналитическую информацию, вплоть до статистики версий IOS и Android, которые подключаются к вашему серверу.
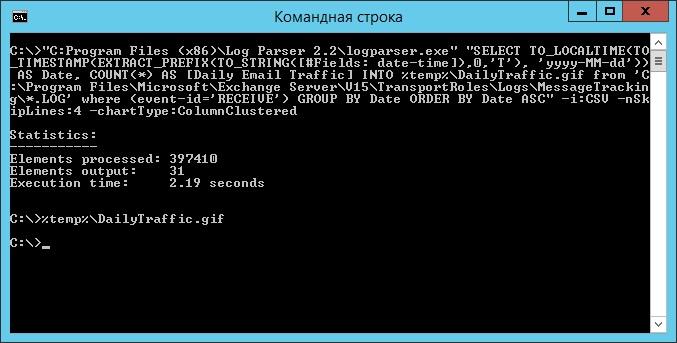
В качестве примера посмотрим статистику количества писем по дням таким запросом:
Если в системе установлены Office Web Components, загрузить которые можно в Центре загрузки Microsoft, то на выходе можно получить красивую диаграмму.
Выполняем запрос и открываем получившуюся картинку…
Любуемся результатом.
Следует отметить, что после установки Log Parser в системе регистрируется COM-компонент MSUtil.LogQuery. Он позволяет делать запросы к движку утилиты не только через вызов LogParser.exe, но и при помощи любого другого привычного языка. В качестве примера приведу простой скрипт PowerShell, который выведет 20 наиболее объемных файлов на диске С.
Ознакомиться с документацией о работе компонента можно в материале Log Parser COM API Overview на портале SystemManager.ru.
Благодаря этой возможности для облегчения работы существует несколько утилит, представляющих из себя графическую оболочку для Log Parser. Платные рассматривать не буду, а вот бесплатную Log Parser Studio покажу.
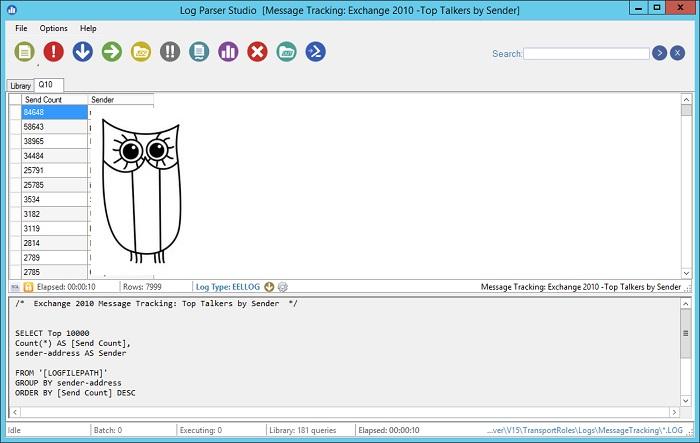
Интерфейс Log Parser Studio.
Основной особенностью здесь является библиотека, которая позволяет держать все запросы в одном месте, без россыпи по папкам. Также сходу представлено множество готовых примеров, которые помогут разобраться с запросами.
Вторая особенность ― возможность экспорта запроса в скрипт PowerShell.
В качестве примера посмотрим, как будет работать выборка ящиков, отправляющих больше всего писем:
Выборка наиболее активных ящиков.
При этом можно выбрать куда больше типов журналов. Например, в «чистом» Log Parser существуют ограничения по типам входных данных, и отдельного типа для Exchange нет ― нужно самостоятельно вводить описания полей и пропуск заголовков. В Log Parser Studio нужные форматы уже готовы к использованию.
Помимо Log Parser, с логами можно работать и при помощи возможностей MS Excel, которые упоминались в материале «Excel вместо PowerShell». Но максимального удобства можно достичь, подготавливая первичный материал при помощи Log Parser с последующей обработкой его через Power Query в Excel.
Приходилось ли вам использовать какие-либо инструменты для перелопачивания логов? Поделитесь в комментариях.