- уТЕДУФЧБ ТБЪТБВПФЛЙ Intel ®
- Intel ® Parallel Studio XE for Windows
- Intel ® Parallel Studio XE for Linux
- чЧЕДЕОЙЕ
- рТПДХЛФЩ, ДПУФХРОЩЕ ДМС ХУФБОПЧЛЙ
- уЕТЧЕТ МЙГЕОЪЙК
- йОУФБММСГЙС
- Intel® System Studio Release Notes, System Requirements, and What’s New
- Overview:
- Detailed New Features List
- Overview:
- Detailed New Features List
уТЕДУФЧБ ТБЪТБВПФЛЙ Intel ®
Intel ® Parallel Studio XE for Windows
Intel ® Parallel Studio XE for Linux
чЧЕДЕОЙЕ
мфж ТБУРПМБЗБЕФ дчхнс УЕФЕЧЩНЙ МЙГЕОЪЙСНЙ ОБ Intel Parallel Studio XE ДМС ЪБРХУЛБ ОБ рл РПД Windows Й дчхнс УЕФЕЧЩНЙ МЙГЕОЪЙСНЙ ДМС ЪБРХУЛБ ОБ УЕТЧЕТБИ Й рл РПД Linux. Parallel Studio XE (ТБОЕЕ ОБЪЩЧБМУС Cluster Studio XE) ЬФП НБЛУЙНБМШОП РПМОЩК РБЛЕФ РТПЗТБНН ЧЛМАЮБАЭЙК ЛПНРЙМСФПТЩ Fortran, C, C++, ВЙВМЙПФЕЛЙ MKL, MPI, УТЕДУФЧБ УПЪДБОЙС ЛПДБ ДМС РБТБММЕМШОЩИ ЧЩЮЙУМЕОЙК, УТЕДУФЧБ ПФМБДЛЙ Й Ф.Д. уЕФЕЧЩЕ МЙГЕОЪЙЙ ДБАФ ЧПЪНПЦОПУФШ ЪБРХУЛБФШ РТЙМПЦЕОЙС ОБ МАВПН рл Ч РТЕДЕМБИ УЕФЙ мфж. лПМЙЮЕУФЧБ МЙГЕОЪЙК ДПМЦОП ИЧБФБФШ ДМС ВЕУЛПОЖМЙЛФОПК ТБВПФЩ РПМШЪПЧБФЕМЕК мфж, ХЮЙФЩЧБС, ЮФП ЧТЕНС ЙУРПМШЪПЧБОЙС ЛПНРЙМСФПТБ ПВЩЮОП ОЕЧЕМЙЛП, Б ЪБРХУЛ ОБ ДПМЗЙК УТПЛ ПФМБДЮЙЛБ ЙМЙ ДТХЗПЗП РТЙМПЦЕОЙС ОЕ ПЗТБОЙЮЙЧБЕФ ЪБРХУЛ ЛПНРЙМСФПТБ, ФБЛ ЛБЛ ОБ ЛБЦДПЕ РТЙМПЦЕОЙЕ ЙНЕЕФУС УЧПС РБТБ МЙГЕОЪЙК, ЛБЛ ДМС Windows, ФБЛ Й ДМС Linux.
фЕИОЙЮЕУЛБС РПДДЕТЦЛБ Й РПМХЮЕОЙЕ ПВОПЧМЕОЙК рп ДПУФХРОЩ РП 2021-01-03 ДМС РТПДХЛФПЧ РПД Windows Й РП 2020-12-07 ДМС РТПДХЛФПЧ РПД Linux .
уБНЩЕ УЧЕЦЙЕ ЧЩРХУЛЙ РПМОЩИ РБЛЕФПЧ (all tools) — УН. УУЩМЛЙ ОБ ЖБКМЩ ОБ УФТБОЙГЕ ПВОПЧМЕОЙК :
- Parallel Studio XE Cluster Edition for Windows (all tools) 2019 Update 4
- Parallel Studio XE Cluster Edition for Linux (all tools) 2019 Update 4
рТПЗТБННБ ХУФБОПЧЛЙ РПЪЧПМСЕФ ЧЩВТБФШ УМЕДХАЭЙЕ ЧБТЙБОФЩ:
- Intel Parallel Studio XE Cluster Edition
- Intel Parallel Studio XE Professional Edition for Fortran and C++
- Intel Parallel Studio XE Professional Edition for C++
- Intel Parallel Studio XE Professional Edition for Fortran

дМС ХДПВcФЧБ ТЕДБЛФЙТПЧБОЙС, ЛПНРЙМСГЙЙ Й ПФМБДЛЙ РТПЗТБНН ОБ СЪЩЛЕ Fortran Ч УПУФБЧ РБЛЕФБ ЧИПДЙФ Microsoft Visual Studio — УТЕДБ ТБЪТБВПФЛЙ РТПЗТБНН, ХЦЕ ОБУФТПЕООБС ДМС ТБВПФЩ Ч УЧСЪЛЕ У ЛПНРЙМСФПТПН Intel Fortran. дМС ТБЪТБВПФЛЙ ЛПДБ ОБ C/C++ Intel РТЕДМБЗБЕФ УБНПУФПСФЕМШОП ХУФБОПЧЙФШ Eclipse, ЛПФПТЩК Ч РТПГЕУУЕ ЙОУФБММСГЙЙ ДПМЦЕО ОБКФЙ ХЦЕ ХУФБОПЧМЕООЩК ЛПНРЙМСФПТ Intel у/C++ Й РПДЛМАЮЙФШ ЕЗП. чПЪНПЦОП ЙУРПМШЪПЧБОЙЕ ДТХЗЙИ УТЕД ТБЪТБВПФЛЙ, ФБЛЙИ, ЛБЛ Code::Blocks ЙМЙ CodeLite Й Ф.Р. еУФШ Й ДТХЗЙЕ, ПЮЕОШ РТПУФЩЕ, ОП ХДПВОЩЕ ТЕДБЛФПТЩ ДМС РТПЗТБННЙУФПЧ, ФБЛЙЕ ЛБЛ Geany Й Ф.Р.

лПНРЙМСФПТЩ Intel НПЗХФ ЪБРХУЛБФШУС Ч Windows Й РТПУФП Ч ЛПНБОДОПК УФТПЛЕ (ifort, icc), ДМС ЮЕЗП РТЙ ЙОУФБММСГЙЙ УПЪДБАФУС УУЩМЛЙ ДМС ЪБРХУЛБ ЛПНБОДОЩИ ПЛПО У ОБУФТПЕООЩН ПЛТХЦЕОЙЕН.
| What’s included |
| Intel® Composer XE compilers and libraries › |
| Intel® Trace Analyzer and Collector › |
| Intel® MPI Library › |
| Intel® MPI Benchmarks › |
| Intel® VTune™ Amplifier XE › |
| Intel® Inspector XE › |
| Intel® Advisor XE › |
рТПДХЛФЩ, ДПУФХРОЩЕ ДМС ХУФБОПЧЛЙ
жБКМЩ, ОЕПВИПДЙНЩЕ ДМС ХУФБОПЧЛЙ Intel ® Parallel Studio XE ЛБЛ ДМС Windows, ФБЛ Й ДМС Linux ХЦЕ ЪБЗТХЦЕОЩ ОБ ЖБКМПЧЩК УЕТЧЕТ TFS Ч ДЙТЕЛФПТЙА «\pub\Install\Intel\», Б Ч РПДДЙТЕЛФПТЙЙ «Updates» НПЦОП ОБКФЙ ЖБКМЩ У ПВОПЧМЕОЙСНЙ.
Parallel Studio XE Cluster Edition:
- Intel ® Visual Fortran Compiler XE
- Intel ® Math Kernel Library
- Intel ® Debugger Extension
® Cluster Studio XE ДМС Windows* (ЧУЕ ЙОУФТХНЕОФЩ) — ХЦЕ ЪБЗТХЦЕО ОБ УЕТЧЕТ TFS , УН. «йОУФБММСГЙС»
Intel ® License Manager for FLEXlm
Intel ® Advisor XE for Windows*
Intel ® C++ Composer XE ДМС Windows*
Intel ® Inspector XE ДМС Windows*
Intel ® Integrated Performance Primitives for Windows*
Intel ® Math Kernel Library ДМС Windows*
Intel ® MPI Library ДМС Windows*
Intel ® Threading Building Blocks ДМС Windows*
Intel ® Visual Fortran Composer XE ДМС Windows*
Intel ® Visual Fortran Composer XE ДМС Windows* (ЧЛМАЮБС Microsoft Visual Studio Shell Й Libraries*)
Intel ® VTune ™ Amplifier XE ДМС Windows*
—>чЧЕТИзМБЧОБС УФТБОЙГБ ПРЙУБОЙСзМБЧОБС УФТБОЙГБ мфж
уЕТЧЕТ МЙГЕОЪЙК
дМС ЪБРХУЛБ ОБ рл ЛПНРЙМСФПТПЧ Й ДТХЗЙИ РТПЗТБНН ЙЪ Parallel Studio ОЕПВИПДЙНП ОБУФТПЙФШ ЧЪБЙНПДЕКУФЧЙЕ У УЕТЧЕТПН МЙГЕОЪЙК мфж. оБ ПВЭЕУФЧЕООЩИ Linux УЕТЧЕТБИ мфж ОБУФТПКЛЙ ХЦЕ УДЕМБОЩ УЙУФЕНОЩН БДНЙОЙУФТБФПТПН.
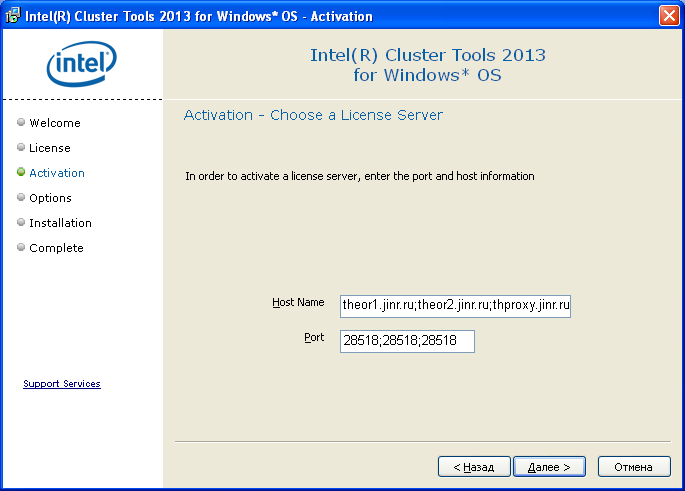
уЕТЧЕТ МЙГЕОЪЙК ТБВПФБЕФ Ч ЙЪВЩФПЮОПК ЛПОЖЙЗХТБГЙЙ У ЙУРПМШЪПЧБОЙЕН ФТЈИ ЛПНРШАФЕТПЧ — THEOR1, THEOR2, THPROXY, ЮФП ПВЕУРЕЮЙЧБЕФ ЧЩДБЮХ МЙГЕОЪЙК, ЕУМЙ ИПФС ВЩ ДЧБ ЙЪ ЬФЙИ ФТЈИ ЛПНРШАФЕТПЧ ТБВПФБАФ. рТЙ ХУФБОПЧЛЕ Cluster Studio УМЕДХЕФ ХЛБЪБФШ ЙНЕОБ ЧУЕИ УЕТЧЕТПЧ Й ОПНЕТБ РПТФПЧ ЮЕТЕЪ ФПЮЛХ У ЪБРСФПК, Ф.Е.
theor1.jinr.ru;theor2.jinr.ru;thproxy.jinr.ru
28518;28518;28518
мЙГЕОЪЙЙ ЧЩДБАФУС ФПМШЛП ДМС ЛПНРШАФЕТПЧ Ч УЕФЙ мфж, Ч РПДУЕФЙ У БДТЕУБНЙ 159.93.129.* Й 159.93.130.* 159.93.132.* («BLTP-Radius» WiFi УЕФШ).
йОУФБММСГЙС
йОУФБММСГЙПООЩe ЖБКМЩ ЧЩРХУЛПЧ ТБЪОЩИ МЕФ ОБИПДСФУС ОБ УЕТЧЕТЕ TFS Ч ДЙТЕЛФПТЙЙ \pub\Install\Intel\[ЗПД]\ Й ДПУФХРОЩ ДМС рл РПД Windows ЙМЙ Linux Ч УЕФЙ мфж РП РТПФПЛПМХ SMB (РБТПМШ ОЕ ФТЕВХЕФУС) ЙМЙ РП БОПОЙНОПНХ FTP.
йНЕОБ ЖБКМПЧ ДМС Windows (РПМОЩЕ РБЛЕФЩ — all tools):
parallel_studio_xe_[ЗПД,update,edition]_online_setup.exe — ХУФБОПЧЛБ ЮЕТЕЪ йОФЕТОЕФ
parallel_studio_xe_[ЗПД,update,edition]_setup.exe — БЧФПОПНОБС ХУФБОПЧЛБ ВЕЪ ОЕПВИПДЙНПУФЙ РПДЛМАЮЕОЙС Л йОФЕТОЕФ
дМС Linux:
parallel_studio_xe_[ЗПД,update,edition]_online.tgz — ХУФБОПЧЛБ ЮЕТЕЪ йОФЕТОЕФ
parallel_studio_xe_[ЗПД,update,edition].tgz — БЧФПОПНОБС ХУФБОПЧЛБ ВЕЪ ОЕПВИПДЙНПУФЙ РПДЛМАЮЕОЙС Л йОФЕТОЕФ
рЕТЕД ОБЮБМПН ЙОУФБММСГЙЙ ХВЕДЙФЕУШ, ЮФП ОБ ДЙУЛЕ ЧБЫЕЗП рл ДПУФБФПЮОП НОПЗП УЧПВПДОПЗП НЕУФБ, ФБЛ ЛБЛ РПФТЕВХЕФУС пюеош нопзп НЕУФБ : ОЕУЛПМШЛП зВБКФ ОБ РТПНЕЦХФПЮОХА ТБУРБЛПЧЛХ Й ЕЭЈ ВПМШЫЕ ОБ ПЛПОЮБФЕМШОХА ХУФБОПЧЛХ. ъБРБУЙФЕУШ ФЕТРЕОЙЕН, ЕУМЙ ДЙУЛ Й РТПГЕУУПТ ЧБЫЕЗП рл ОЕ УХРЕТВЩУФТЩЕ.
рПУМЕ ЙОУФБММСГЙЙ НПЦОП ХУФБОПЧЙФШ ПВОПЧМЕОЙС ЙЪ ДЙТЕЛФПТЙЙ \pub\Install\Intel\[ЗПД]\UpdateN\ ЕУМЙ ЬФЙ ПВОПЧМЕОЙС ЧЩРХЭЕОЩ РПУМЕ ХУФБОПЧМЕООПЗП ОБ ЧБЫЕН рл ЧЩРХУЛБ.
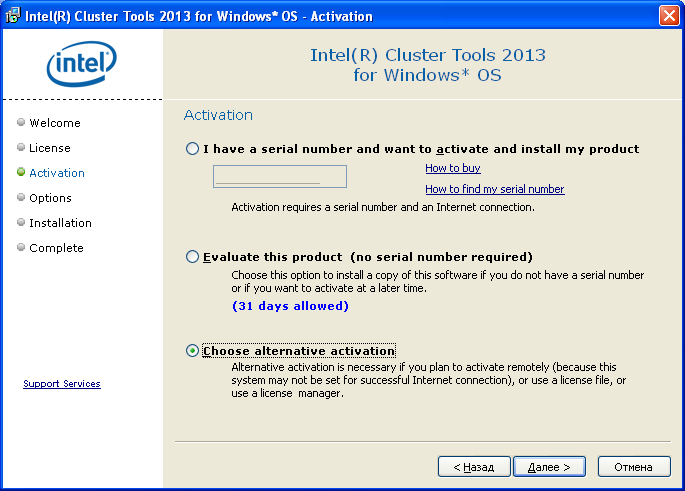
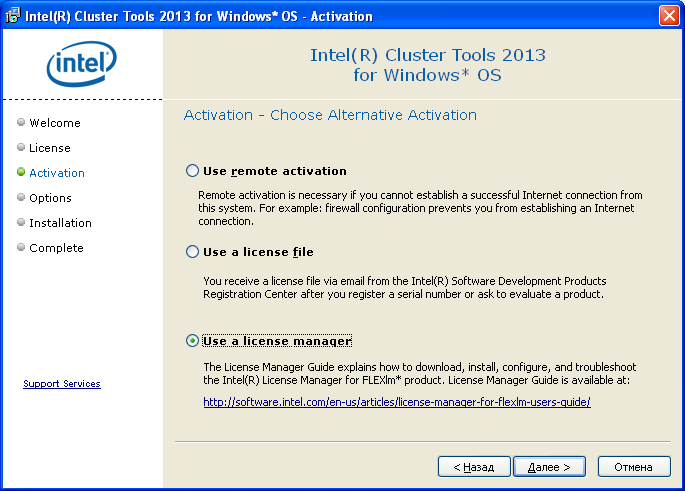
ч РТПГЕУУЕ ЙОУФБММСГЙЙ ЧПЪОЙЛОЕФ ЧПРТПУ ПВ БЛФЙЧБГЙЙ, УН. ОЙЦЕРТЙЧЕДЈООЩЕ ЙММАУФТБГЙЙ П ФПН, ЛБЛ УДЕМБФШ РТБЧЙМШОЩК ЧЩВПТ УЕТЧЕТБ МЙГЕОЪЙК Ч мфж.
 еУМЙ ФТЕВХЕФУС УЛПТТЕЛФЙТПЧБФШ ЙОЖПТНБГЙА П УЕТЧЕТЕ МЙГЕОЪЙК РПУМЕ ЪБЧЕТЫЕОЙС ЙОУФБММСГЙЙ, ФП УМЕДХЕФ ПФТЕДБЛФЙТПЧБФШ (ЙМЙ УПЪДБФШ) ЖБКМ USE_SERVER.lic, ЛПФПТЩК ДПМЦЕО ОБИПДЙФШУС Ч ДЙТЕЛФПТЙЙ «C:\Program Files (x86)\Common Files\Intel\Licenses\» ДМС Windows 64-bit ЙМЙ Ч «C:\Program Files\Common Files\Intel\Licenses\» ДМС Windows 32-bit. жБКМ ДПМЦЕО УПДЕТЦБФШ УМЕДХАЭЙЕ УФТПЛЙ:
Источник
Intel® System Studio Release Notes, System Requirements, and What’s New
Last Updated: 10/13/2020
This page provides system requirements and release notes for Intel® System Studio. They are are categorized by year, from the newest to oldest, with individual releases listed within each year. For component-specific system requirements and release notes, please see the Release notes for individual components section below.
Click a version to expand it into a summary of new features and changes in that version since the last release, and access the download buttons for the detailed system requirements and release notes, which include important information, such as pre-requisites, software compatibility, installation instructions, and known issues.
- Intel® System Studio 2020 Update 3 includes functional and security updates. Users should update to the latest version.
- Intel® Integrated Performance Primitives (Intel® IPP):
- Extends optimization for Intel® IPP CRC functions on 10th Generation Intel® Core™ processor family.
- Extends optimizations for Intel® IPP Image Processing and Color Conversions functions for selected algorithms for Intel® Advanced Vector Extensions 512 (Intel® AVX-512).
- Extends Intel® IPP Cryptography with ECDSA (Sign) and ECDHE for the NIST curves p256r1 and p384r1.
- Intel® VTune™ Profiler:
- Adds support for 11th Generation Intel® Core™ processors codenamed Tiger Lake, including hotspots, microarchitecture exploration, memory access, and GPU analyses.
- I/O analysis: source level Memory Mapped I/O (MMIO) supports InfiniBand devices.
- Profiling of applications annotated with Intel® Instrumentation and Tracing Technology (ITT) APIs is enhanced with Average Task Time and Average Frame Time metrics.
- Adds support for remote profiling of applications running in Amazon Web Services* (AWS) EC2 instances.
- Intel® System Studio 2020 Update 2 includes functional and security updates. Users should update to the latest version.
- Intel® Integrated Performance Primitives (Intel® IPP):
- Adds new universal CRC function to compute CRC8, CRC16, CRC24, CRC32 checksums.
- Enables the Intel® IPP Threading Layer for the ippiCrossCorr function.
- Reinstates the ippiComplement function optimized for Intel® Advanced Vector Extensions 512 (Intel® AVX-512), Intel® Advanced Vector Extensions 2 (Intel® AVX2), Intel® Streaming SIMD Extensions 4.2 (Intel® SSE4.2) instruction sets.
- Extends ippsHilbert_32f32fc on double precision counterparts.
- Adds IPP Custom Library Tool custom dispatcher support.
- Intel® Math Kernel Library (Intel® MKL):
- BLAS: Introduces
?axpy_batch APIs. Introduced bfloat16 data type support for GEMM and pack-API. Fixes a parameter validation error of cblas_zgemmt to allow CblasConjTrans value. - LAPACK: Improves performance of
- ScaLAPACK: Aligns Intel MKL ScaLAPACK functionality with Netlib ScaLAPACK 2.1.0. Adds robust ScaLAPACK routines for computing the QR factorization with column pivoting.
- Vector Statistics: Improves performance for the threading version of Sobol quasi-random number generator in case of registered user-defined parameters.
- Graph: Significant API changes to enable better consistency and uniformity. Adds new API for transposing graph data. Adds support for sparse vectors and Compressed Sparse Column (CSC) matrix format. Adds support for vxm. Adds support for new semirings and extended support for descriptor flags which can be used for Connected Components(CC), Triangle Count (TC), Betweenness Centrality (BC) and Breadth First Search (BFS). Adds PLUS accumulator for mxv which can be used for PageRank (PR).
- Vector Math: Introduces strided API.
- BLAS: Introduces
- Intel® Threading Building Blocks (Intel® TBB):
- Changes body type concept of the flow::input_node. Set TBB_DEPRECATED_INPUT_NODE_BODY to 1 to compile with the previous concept of the body type.
- Fixes compilation errors in C++20 mode due to ambiguity of comparison operators.
- Fixes an issue in TBBBuild.cmake that causes the build with no arguments to fail.
- Adds cmake/
- Intel® Data Analytics Acceleration Library (Intel® DAAL):
- Introduces Thunder method for Support Vector Machine (SVM) training algorithm, which demonstrates better training time than the existing sequential minimal optimization method.
- Extends training with the number of features greater than the number of observations for Linear Regression, Ridge Regression, and Principal Component Analysis.
- Adds new sample_weights parameter for SVM algorithm.
- Adds new parameter in K-Means algorithm, resultsToEvaluate, which controls computation of centroids, assignments, and exact objective function.
- Improves performance of Support Vector Machine training and prediction, Elastic Net and LASSO training, Principal Component Analysis training and transform, K-D tree based k-Nearest Neighbors prediction.
- Improves performance of K-Means algorithm in batch computation mode.
- Improves performance of RBF kernel function.
- daal4py library: Improves performance of pandas input format. Improves Scikit-learn compatible API for AdaBoost classifier, Decision Tree classifier, and Gradient Boosted Trees classifier and regressor.
- Improves performance of the following Intel Scikit-learn algorithms and functions: fit and prediction in K-Means and Support Vector Classification (SVC), fit in Elastic Net and LASSO, fit and transform in PCA; Support Vector Classification (SVC) with non-default weights of samples and classes; train_test_split() and assert_all_finite().
- Intel® Advisor adds Memory-Level Roofline feature (previously known as Integrated Roofline, tech preview feature).
- Intel® VTune™ Profiler:
- Adds Performance Snapshot analysis type to get a quick overview of issues that affect your application performance. Performance Snapshot characterizes the workload on the system and provides recommendations for next steps to help select other analyses for deeper profiling.
- Platform I/O metrics can now be attributed to individual devices managed by Intel® VMD technology.
- Enhances I/O Analysis for Sky Lake and Cascade Lake servers by highlighting code that potentially performs MMIO reads.
- Adds support for Intel processors code named Cooper Lake and Comet Lake.
- Adds support for Ubuntu* 20.04, Fedora* 32, and Microsoft* Windows* 10, May 2020 Update.
- Intel® System Debugger:
- Adds Intel® Processor Trace (Intel® PT) support — DRAM-based execution tracing with a larger execution history compared to the method based on Last Branch Record (LBR).
- Enables loading of debug symbols for stack frames and thread nodes and changes the «Load available debug symbols» (formerly LoadThis) button enabling conditions accordingly.
- Enables loading of the UEFI DXE modules and adds a dedicated «Load EFI Images» button (also known as LoadDXE in System Debug Legacy).
- Adds dedicated button to load all Pre-EFI Initialization (PEI) phase modules (also known as LoadPEIMs in System Debug Legacy).
- Introduces a single menu for all breakpoint types: address, IO port access, generic, C/C++ breakpoints, and platform breaks. The menu can be accessed from the Breakpoints view using the «Add Breakpoint» button or selecting «Add System Debug Breakpoint» from the View Menu.
- Adds support for additional platform breakpoints including VM-Launch, VM-Clear, and VM-Exit.
- Improves Debug View to display platform break hit events.
- Adds support to display IA descriptor tables (GDT, LDT and IDT).
- Adds logical thread filtering support based on regular expressions.
- System Debug User Guide documents instructions for loading symbols for CoreBoot*.
- Intel® Debug Extensions for WinDbg* adds support for Microsoft Windows 10* (20H1) May 2020 update.
- The Android* Trace feature of Intel® System Debugger — System Trace is permanently removed from Intel® System Studio, beginning with this release.
- Intel® System Studio 2020 Update 1 includes functional and security updates. Users should update to the latest version.
- Updates base Eclipse* IDE to Eclipse IDE 2019-12 and includes functional and security updates.
- Improves Yocto Project* documentation.
- Intel® Math Kernel Library (Intel® MKL):
- Improves BLAS GEMM3M performance on Intel® Advanced Vector Extensions 2 (Intel® AVX2) and Intel® Advanced Vector Extensions 512 (Intel® AVX-512) architectures.
- Improves performance of LAPACK
- Introduces ScaLAPACK distributed nonsymmetric eigensolver functionality (P?GEEVX) for computing eigenvalues and optionally eigenvectors for a general nonsymmetric matrix.
- Improves performance for FFTs with MKL TBB threading layer on CPUs.
- Introduces Graph functionality as a preview feature that supports the sparse linear algebra operations and semirings used in PageRank and Triangle Count algorithms.
- Intel® Integrated Performance Primitives (Intel® IPP):
- Extends Intel® IPP Image Processing ippsFIRSparse*_32fc functions optimizations for Intel® Advanced Vector Extensions 2 (Intel® AVX2) and Intel® Advanced Vector Extensions 512 (Intel® AVX-512).
- Optimizes Intel® IPP Image Processing Resize 8u functions for 10th Generation Intel® Core™ Processor and ippsAddProduct_32fc for Intel® Advanced Vector Extensions 2 (Intel® AVX2) and Intel® Advanced Vector Extensions 512 (Intel® AVX-512).
- Introduces Intel® IPP Cryptography RSA multi-buffer cipher API to process up to 8 messages simultaneously. The API is optimized for 10th Generation Intel® Core™ processor family with performance improvement up to 6x for decryption and up to 4x for encryption compared to the RSA classic single-buffer API.
- Intel® Advisor:
- Advisor Python* API uses Python 3.
- Adds First Bottleneck visualization for Integrated Roofline chart; and integrates Roofline single kernel view and guidance.
- Intel® SoC Watch:
- Adds (user opt-in) collection of SoC Watch usage analytics.
- Adds reporting residency in lowest power sleep state, SLP_S0 (s0i3/Modern Standby).
- Adds reporting blocking reasons (IP state conditions) that may be preventing entry to lowest power sleep state, SLP_S0 (s0i3/Modern Standby).
- Enhances SoC Watch driver security by limiting access to only registers or memory required to collect platform power and performance information.
- Intel® VTune™ Profiler:
- Adds Microarchitecture Exploration analysis support on Intel processors codenamed Icelake.
- Extends GPU Compute/Media Hotspots analysis in the Dynamic Instruction Count mode to include SIMD utilization metrics at the kernel and instruction level, which help identify instructions in the OpenCL™ kernel that utilize SIMD poorly.
- Adds a deeper GPU utilization analysis in Application Performance Snapshot (APS) and the HPC Performance Characterization analysis. The GPU utilization analysis now includes GPU time, GPU IPC, GPU utilization, and % of stalled and idle execution units.
- VTune Profiler automatically selects the latest libstdc++ available in runtime to satisfy the GPU analysis requirements on Linux* systems.
- Extends CPU/FPGA Interaction analysis to process data sources collected either with AOCL Profiler (new mode) or via OpenCL Profiling API (legacy mode). Specify the name of your application target and its parameters directly in the WHAT pane.
- Extends the Hardware Tracing mode in the System Overview analysis to include new metrics to make the analysis more kernel-aware. The CPU Time metric has been split to User Time and Kernel Time metrics to show the number of kernel mode switches and their frequency (switches per second). OS Kernel Activity and OS Scheduling metrics identify anomaly issues caused by unexpected kernel activity or preemptions
- Adds a Module Entry Point grouping level to the System Overview viewpoint to display data collected in the Hardware Tracing mode. The grouping shifts the focus to precise CPU time spent within system calls, interrupts, or within a runtime library API.
- Extends Intel® C++ Compiler support of C++ 17 and provides initial C++ 20 language standard support.
- Intel® SoC Watch adds support for Intel platform code named Comet Lake and Intel platform code named Ice Lake.
- Renames Intel® VTune™ Amplifier to Intel® VTune™ Profiler starting with version 2020.
- Intel® VTune™ Profiler:
- Adds new GPU Offload analysis to explore and correlate code execution across CPUs and GPUs, and identify a kernel of interest for GPU-bound applications to be explored further with GPU Compute/Media Hotspots analysis.
- Updates GPU Compute/Media Hotspots analysis with options for GPU in-kernel analysis.
- Extends command line hotspots report scope to support GPU analysis types.
- Improves dynamic instruction count collection available as part of the GPU Compute/Media Hotspots analysis to provide better accuracy for basic block assembly analysis.
- Updates System Overview analysis to serve as an entry point to platform analysis assessing system (IO, accelerators and CPU) performance and providing guidance for further analysis steps, and adds New Hardware Tracing mode.
- Adds new Throttling analysis to identify causes for system throttling, like exceeding safe thermal or power limits.
- Extends Energy analysis options to monitor processor package energy consumption over time and identify how it correlates with CPU throttling.
- Extends containerization support with an option to install and run the VTune Profiler in a Docker* container and profile targets both inside the same container as well as outside the container.
- Adds Max and Bound Bandwidth metrics to Application Performance Snapshot to better estimate the efficiency of the DRAM, MCDRAM, Persistent Memory and Cornelis Networks usage.
- Platform Profiler:
- Extends Overview and Memory views with new metrics for analyzing Non Uniform Memory Access (NUMA) behavior.
- Implements user authentication and authorization to enable access control to users’ data.
- Adds a new option for users to choose or modify the location of Platform Profiler data files.
- Updates Intel® System Debugger to a new Eclipse*-integrated source-level debugger, providing reworked support for platform registers, improved support for PCI configuration space, better debug information, and a Python*-based scripting console.
- Adds Intel® System Debugger Target Indicator, a cross-platform tool that indicates the status of a DCI debug connection to a target platform.
- Adds Intel® System Debugger support for:
- 10th Generation Intel® Core™ Processor (Ice Lake) / Ice Lake PCH-LP
- 10th Generation Intel® Core™ Processor (Comet Lake) / Comet Lake PCH-LP
- 10th Generation Intel® Core™ Processor (Amber Lake Y 4+2) / Sunrise Point PCH-LP
- Intel® Xeon® Processor (Cascade Lake) / Lewisburg PCH
- OpenCL™ API Debugger and Kernel Development Framework functionality is deprecated in this release. Intel® VTune™ Profiler can be configured to see OpenCL™ API calls. Intercept Layer for OpenCL™ Applications can be used for replacement of OpenCL™ API Debugger functionality.
- Adds OpenCL™ tools support for:
- 10th Generation Intel® Core™ Processor named Ice Lake
- Microsoft Visual Studio* 2019
- CentOS* 8
- Adds OpenCL™ tools offline compiler support for generation of optimized ELF binary file from SPIR-V file
- Bug fixes and security updates
- To support building OpenVINO™ applications, Intel® System Studio 2019 provides instructions for the user to create a custom Docker container that contains OpenVINO tools and libraries. Intel® System Studio 2020 includes a Docker platform to build OpenVINO projects as a user-selectable option. This Docker platform contains OpenVINO 2019 R3.1 release.
- Deprecates Ubuntu* 16.04 Docker files for remote IoT targets. Users are recommended to start with Ubuntu 18.04.
- Removes MRAA/UPM binaries and target update capability from IoT Connection Tools since they are now distributed by the Eclipse* Foundation. However, the Sensor Explorer feature remains functional.
- Updates IoT and Cloud code samples. Removes IoT code samples that use sensors from discontinued developer kits.
- Supports latest IoT developer kits, including accelerator card release updates to the IEI AIoT Tank Developer Kit.
- Updates base Eclipse* IDE to Eclipse IDE 2019-09.
- Updates JDK* to 11.0.5 which includes CVE fixes.
- Intel® System Studio 2019 Update 5 includes functional and security updates. Users should update to the latest version.
- Intel® C++ Compiler includes a new -qnextgen compiler option that uses LLVM Technology. For more details, see the additional requirements for ICC NextGen and the ICC NextGen notes sections in the Intel® C++ Compiler release notes for Linux* host, Windows* host, and Windows* target.
- Intel® VTune™ Amplifier 2019 Update 5 enhancements include:
- Interactive help tour available from the welcome page guides users through the product interface using a sample project.
- Enables automatic password-less access configuration to a remote Linux* (SSH) target on Windows*.
- Relaxes limitations on collecting GPU hardware metrics for users without administrator / root privileges.
- Relaxes limitations for microarchitecture exploration analysis with Perf* driverless collection on Linux for users with perf_event_paranoid set to 2 to support event-based sampling in user space.
- Updates memory access analysis with a new UPI utilization metric for Intel microarchitectures code named Cascade Lake and Skylake.
- Adds hardware-based analysis support for systems running on Hyper-V.
- Adds Application Performance Snapshot max and bound metrics to estimate the efficiency of the DRAM, MCDRAM, and persistent memory usage.
- Intel® Threading Building Blocks 2019 Update 7 and 8 enhancements include:
- Improved Intel(R) Threading Building Blocks (TBB) async_node to never block a thread that sends a message through its gateway.
- Adds Windows* support to the CMake module TBBInstallConfig.
- Adds ordered associative containers preview feature: concurrent_
- Fixes enqueuing tbb::task into tbb::task_arena not to fail on threads with no task scheduler initialized.
- Intel® System Studio 2019 Update 4 does not include the latest functional and security updates. Intel System Studio 2019 Update 5 is targeted to be released in September 2019 and will include additional functional and security updates. Users should update to the latest version as it becomes available.
- Intel® C++ Compiler adds Microsoft Visual Studio 2019* support.
- Enhances Intel® SoC Watch -f hw-cpu-pstate feature reporting to include Core P-state/Frequency Histogram summary, which makes it easier to see residencies in turbo and throttled frequency states.
- Adds Intel® System Debugger support for:
- Intel® Xeon® E Processor (Coffee Lake-S) Server
- Intel® Pentium® Gold processors: 5405U (WHL-U platform based)
- 4417U (KBL-R platform based), Intel® Celeron® processors: 4205U (WHL-U platform based), 3867U (KBL-R platform based)
- 9th Gen Intel® Core™ Processor: i9-9900KF, i7-9700KF, i5-9600KF, i5-9400, i5-9400F, i3-9350KF
- Intel® Core™ X-series Processor (Basin Falls Refresh): i9-9980XE, i9-9960X, i9-9940X, i9-9920X, i9-9900X, i9-9820X, i7-9800X.
- Adds «Control-flow Enforcement Technology (CET)» debug support for GDB server.
- Updates Intel System Studio’s IDE for Linux* targets with Eclipse* 2019-03 support.
- Intel® System Studio 2019 Update 3 includes functional and security updates. Users should update to the latest version.
- Updates Intel System Studio’s IDE for Linux* targets with Java 11 and Eclipse* 2018-12 support.
- Adds Java* 11 JDK to simplify getting started with Java development.
- Updates Java* samples for Java 11
- Adds Intel® VTune™ Amplifier support for Intel® Optane™ DC persistent memory and the latest microarchitecture code-named Cascade Lake. This includes new hardware event support and enhanced memory analysis to design and optimize for the new persistent memory technology.
- Enhances VTune Amplifier PCIe device metrics for I/O traffic in the Input and Output analysis to help understand interactions between Cores and Network Interface Cards (NICs).
- Enhances Intel® SoC Watch informational messages for CPU C-State reports. Improves organization of SoC Watch reports in the trace results file generated by «-r int».
- Removes limitation on the number of SoC Watch metrics that can be imported into VTune Amplifier for visualization.
- Improved Intel® Advisor Summary pane with a sleeker look and better program-level issue highlighting, including a new block with memory bandwidth information. Survey columns can be customized using the column configurator. Сache Simulator configuration dialog allows visual configuration of different cache levels for Memory Access Patterns analysis. Improved Roofline comparison visually distinguishes the compared result sets.
- Intel® C++ Compiler adds value safe simd options for #pragma omp simd, new custom memory allocator library, and supports new code names in -[Q]x / -[Q]ax / -[m]tune / -[m]arch options. See details.
- Updates GNU* GDB-IA CDT plug-in to support Java* 11 and Eclipse* 2018-12. Native GDB-IA supports «Shadow Stack» and «Indirect branch tracking» capabilities of «Control-flow Enforcement Technology (CET).»
- Intel® System Studio 2019 Update 2 includes functional and security updates. Users should update to the latest version.
- Enhances Intel® VTune™ Amplifier configuration for Microarchitecture Exploration analysis to provide control over collected hardware metrics and data collection overhead. Supports managed Linux* and Windows* targets with tiered compilation for .NET* Core 3.0 Preview 1 and .NET Core 2.2.
- Adds System Analyzer tool for monitoring real-time metrics on a target system to VTune Amplifier as a PREVIEW feature. See the VTune Amplifier Performance Analysis Cookbook recipe for more details.
- Adds Python* support for easily developing native Python-based edge application using the Eclipse* IDE and the integrated Pydev* plug-in.
- Extends Intel® VTune™ Amplifier threading analysis with the lower overhead hardware event-based sampling mode for analyzing the impact of thread pre-emption and context switching.
- Expands analysis for OpenCL™ applications using Intel® VTune™ Amplifier. OpenCL™ Tools now deliver a bundled CPU runtimes.
- Provides flexibility and ease of building computer vision projects within Docker containers locally or remotely. Get started seamlessly using samples from Intel® Distribution of OpenVINO™ toolkit.
- Extends the Library Explorer to more easily browse optimized library functions (math, data analytics, threading, signal / image, and more).
- Supports additional hardware development kits: IEI Tank AIoT Developer Kit (IEI Tank 870-Q170) and the UP Squared* AI Vision Developer Kit (RE-UPS-APLC2-A10-0232).
Overview:
- Rapid insights into platform-level performance. New work flow and simplified set up make Intel® VTune™ Amplifier easier to use. Get fast insights into overall system configuration, performance, and behavior, with specific focus on identifying platform-level memory and storage bottlenecks and imbalances.
- Code vectorization and threading. New Intel® Advisor tool provides vectorization optimization and threading design tools to ensure applications take full performance advantage of hardware capabilities.
- OpenCL™ tools help offload compute to Intel® processors (CPU and GPU / Intel® Processor Graphics). Streamline building, debugging, and analyzing OpenCL™ applications through new projects, or customize kernel code from Intel computer vision and media software tools.
- Improve debug. Intel® Processor Trace, with timestamps over direct connect interface (DCI), helps triage timing and performance issues with Intel® Debug Extensions for WinDbg*. Easily set up the target and connection type, then manage multiple simultaneous debug or trace connections to quicken system development. Configure and automate system trace to run on the command line.
- Create a cloud project. Use sample projects for connecting to cloud services providers, including Microsoft Azure*, Amazon Web Services*, Google Cloud IoT Core* (new!), and IBM Bluemix.
- Build Yocto Project* compatible applications and platform projects, for the Yocto Project compatible targets Wind River Linux* LTS 17 (and above) or Yocto Project 2.6 (and above), using the Intel® System Studio Eclipse IDE and the Yocto Project Toaster tool on Linux* development hosts.
- New download and install pages guide you through selecting and installing the Intel® System Studio tools and libraries that you need.
- Improved ease of use with more than 65 new code wizards and samples.
- Harness more performance with the latest updates of the performance libraries and analysis and debugger tools with new and enhanced features, and continued support for the latest Intel® platforms.
- Hardware support: 8th Generation Intel® Core™ U- and S-Series Processors, and Intel® Xeon® Processor D-1500 product family.
Detailed New Features List
Intel® VTune™ Amplifier
- Simplified analysis configuration workflow provides pre-selected target and collection options available in the same view.
- Default finalization mode set to Fast to minimize post-processing overhead if the number of collected samples exceeds the threshold.
- New Hotspots analysis combines former Basic Hotspots and Advanced Hotspots analyses configurations and is extended to show additional performance insights such as hardware usage efficiency and vector register utilization.
- New Threading analysis combines and replaces former Concurrency and Locks and Waits analysis types.
- New Platform Profiler provides low-overhead, system-wide analysis and insights into overall system configuration, performance, and behavior. Use this tool to:
- Identify bottlenecks by monitoring over- or under-utilized subsystems and buses (CPU, storage, memory, PCIe, and network interfaces) and platform-level imbalances.
- Understand a system topology using diagrams annotated with performance data.
- Microarchitecture Exploration analysis improvements
- Microarchitecture Exploration analysis (formerly General Exploration) configuration was split to provide options for a lightweight summary or full details analysis with all levels of PMU metrics.
- Microarchitecture Exploration analysis view was extended with the µPipe hardware metric representation to easily identify bottlenecks in hardware usage and provide quick insights for optimization.
- Input and Output (I/O) analysis on Linux* extended to profile DPDK and SPDK I/O API. Use this data to correlate CPU activity with network data plane utilization, visualize PCIe bandwidth utilization per NIC, estimate UPI bandwidth on multi-socket systems, and identify bottlenecks.
- Containerization flexibility and support improvements
- Adds user-mode sampling and tracing collection (Hotspots analysis) support for Docker* container targets.
- Adds profiling support for targets running in the Singularity* containers.
- Adds profiling for native and Java* applications in the Docker and LXC containers.
- Managed runtime analysis improvements
- Extends JIT profiling for server-side applications running on the LLVM* or HHVM* PHP servers to support the event-based sampling analysis in the attach mode.
- Extends Java code analysis with support for OpenJDK* 9 and Oracle* JDK 9.
- Enables Hotspots analysis in the hardware event-based sampling mode for .NET* Core applications on Linux and Windows* systems for the Launch Application target type.
- Embedded Platforms and Accelerators analysis improvements
- New CPU/FPGA Interaction analysis (PREVIEW) to assess the balance between the CPU and FPGA on systems with a discrete Intel® Arria® 10 FPGA running OpenCL™ applications.
- New Graphics Rendering analysis (PREVIEW) for CPU/GPU utilization of code running on the Xen* virtualization platform installed on a remote embedded target.
- Supports sampling command-line analysis on remote QNX* embedded systems via Ethernet connection.
- KVM guest OS profiling was extended to profile both KVM kernel and user space from the host system for a full-scale performance analysis of host and VM systems.
- Updated GPU Hotspots analysis on Linux to use Intel Metric Discovery API library for GPU metric collection, which involves support for kernel 4.14 and higher.
- Application Performance Snapshot improvements
- Adds uncore-based metrics for DRAM/MCDRAM memory analysis to help identify whether an application is bandwidth bound.
- Adds the ability to pause/resume collection with MPI_Pcontrol and ITT API. Adds -start-paused option to exclude application execution from collection from the start to the first collection resume occurrence.
- Enables selection of which data types are collected to reduce overhead (MPI tracing, OpenMP tracing, hardware counter based collection).
- Exposes the CPU Utilization metric by physical cores on processors that support proper hardware events.
- Significantly reduces MPI tracing overhead when there are a large number of ranks.
- Improves integration with Intel® Trace Analyzer and Collector by adding the ability to generate profiling configuration files with the aps-report option.
- Hardware event-based analysis supported for targets running in the Hyper-V* environment on Windows* 10 Fall Creators Update (RedStone3).
- Adds HTML and XML to command line output formats.
- Supports newer versions of several OSs: SUSE Linux Enterprise Server* (SLES) 12 SP3 and 15, Red Hat Enterprise Linux* 7.5, Fedora* 28, Ubuntu* 18.04, Microsoft Windows* 10 RS4
Energy Analysis / Intel® SoC Watch
- Supports Intel platforms codenamed Whiskey Lake and Amber Lake.
- Adds option to delay start of a workload (program-delay).
- Adds new group names to make it easier to find and select features.
- The -f hw-cpu-pstate summary report includes a new core P-state average frequency table containing the core P-state approximate average and actual average frequency.
Intel SoC Watch for Linux* / Android*
Intel® SoC Watch for Windows*
- Adds guard against sampling bandwidth data too frequently on certain platforms.
- Adds a new energy metric.
Intel® Advisor — New Tool!
- Vectorization Advisor is a vectorization analysis tool that identifies loops that may benefit most from vectorization, and what is blocking effective vectorization; explores the benefit of alternative data reorganizations; and increases the confidence for safe vectorization.
- Threading Advisor is a threading design and prototyping tool that lets you analyze, design, tune, and check threading design options without disrupting your normal development.
- Optimize integer calculations using Integer Roofline analysis.
- Integrated Roofline for integer data (PREVIEW) shows which exact memory layer is the bottleneck for each loop.
- Use the macOS* user interface to view and analyze data collected on Linux or Windows systems.
- Flow Graph Analyzer is a new rapid visual prototyping environment to interactively build, validate, and visualize algorithms.
- Reduce overhead for faster analysis results using selective profiling:
- Decrease overhead for Memory Access Patterns and Dependencies analyses via limiting loop call count and analysis duration in project properties.
- Selective profiling for Roofline, FLOPS and Trip Counts collections to decrease analysis scope and decrease overhead.
- Scale Roofs on the Roofline chart to arbitrary thread counts to see an application’s practical performance limits.
- Compare several Roofline results on the same chart.
- New recommendation to optimize standard algorithms in C++ with Parallel STL.
- Supports new operating systems: Fedora 28, Red Hat Enterprise Linux 7.5, Microsoft Windows 10 build 17134, Ubuntu 18.04, SUSE Linux Enterprise Server (SLES) 12 SP3 and 15, macOS 10.11.x, 10.12.x, and 10.13.x.
Intel® Inspector
- Adds Persistence Inspector feature.
- Inspector debugger add-on now supports Microsoft Visual Studio* 2017.
- Supports new operating systems: Fedora 28, Red Hat Enterprise Linux 7.5, Microsoft Windows 10 build 17134, Ubuntu 18.04, SUSE Linux Enterprise Server* (SLES) 12 SP3and 15.
OpenCL™ Tools — New Tools!
- Improved support for 8th Generation Intel® Core™ Processors (code-named Coffee Lake) on Windows and Linux operating systems.
- Offline compiler supports OpenCL™ Runtime 18.1 for Intel® Core™ Processors with added support of Intel® Advanced Vector Extensions 512 (Intel® AVX-512).
- Supports Intel® Streaming SIMD Extensions for Intel® FPGA Emulation Platform for OpenCL™.
- Adds support for additional operating systems and platforms, and compatible integration into more recent IDEs for flexibility.
- New features help speed development and improve performance for creating high-performance image and video processing pipelines.
Eclipse* IDE
- Updated Intel System Studio’s IDE for Linux targets with Eclipse Oxygen 3 support.
- Provides sample projects for connecting to cloud services providers, including Microsoft Azure*, Amazon Web Services*, Google Cloud IoT Core* (new!), and IBM Bluemix.
Yocto Project* Compatible Application and Platform Project Development
An Eclipse plug-in enables users to create or import application projects and platform projects for Yocto Project* compatible targets running on Wind River Linux* LTS 17 (and above) or Yocto Project 2.6 (and above), using the Eclipse* IDE and the Yocto Project Toaster tool on Linux* development hosts.
Features
The Application Project feature enhances support for application development for embedded Linux devices, complete with multiple SDK support, debug flags enablement, customizable build properties, sample applications, target connections, run/debug launch configurations, and debugging. This feature includes the ability to directly use the Intel® C/C++ Compiler, together with a set of sample Intel C/C++ Compiler applications.
The Platform Project feature provides immediate out-of-box guidance for new users on how to create projects, and guided support for the most common first steps in creating and deploying a project, including integration of Intel System Studio agents.
This feature set provides out-of-box-experience guidance to help create and deploy embedded Linux applications and projects in the Intel System Studio graphical user interface (GUI), plus easy transition to and from the GUI and the command line. It also easily integrates with System Studio features.
This feature works with Yocto Project community of products and commercial partners.
Usage
- Configure and build an application
- Import multiple cross-build SDKs, with each CPU variant immediately selectable.
- Simple check box to enable debug versions of the application build.
- Easy deploy and connection between the runtime target and the source-level debugger.
- Configure Platform Project file system via the web-based Toaster tool:
- Full and guided access to the vast libraries of packages and features in Yocto Project* compatible universe.
- Easily enables Intel System Studio agents and runtime Intel® C/C++ compiler support.
- Configure Platform Project kernel via the Kernel Configure view:
- Ability to easily see and find hidden and/or disabled configuration items.
- Provides easy reference calculations for dependencies, including reverse dependencies from the select and imply keywords.
- Easy search and link tools.
- Easy access to the parent KConfig files and their content.
Ubuntu* 18.04 LTS Linux* Support
- Supports Ubuntu* 18.04 LTS Linux* as a host development environment.
Intel® C++ Compiler 19.0
- -openmp-simd is set by default.
- -rcd option was deprecated.
- Changes mitigate speculative executive side channel and new -mindirect-branch option.
- Supports new C++ 17 features.
Intel® Data Analytics Acceleration Library (Intel® DAAL)
- Enables support for user-defined data modification procedure in CSV and ODBC data sources for implementing a wide range of feature extraction and transformation techniques on the user side.
Intel® Math Kernel Library (Intel® MKL)
- Adds automatic S/DGEMM JIT capability for small matrix sizes (m,n,k » option for logging console output to a file.
Intel SoC Watch for Linux* / Android*
- Separates HWP reporting into its own feature name to allow finer grain selection of which metrics to collect. Use hw-cpu-hwp to get this data now, rather than cpu-pstate.
- Features cpu-cstate and gfx-cstate are now group names. The individual feature names are now hw-cpu-cstate and hw-gfx-cstate to align these names across all operating systems.
- The -f hw-cpu-pstate feature is now collected by sampling so this metric can be supported on any system. Since this is now sampled data, there is some loss in precision of the CPU P-state residency and the report format changes.
Intel® SoC Watch for Windows*
- Removes OS-based metrics that have comparable hardware metrics from the sys group to reduce post-processing time. The os-cpu-cstate, os-cpu-pstate, and os-gfx-cstate features should be listed explicitly when needed.
- Separates HWP reporting into its own feature name to allow finer grain selection of which metrics to collect. Use hw-cpu-hwp to get this data now, rather than hw-cpu-pstate.
Intel® Graphics Performance Analyzers
- Metrics for AMD* Radeon RX Vega M (in the Intel® NUC KIT NUC8I7HVK) are available in System Analyzer and Graphics Frame Analyzer for DirectX* 11 and DirectX 12 applications.
- Identify problematic textures within a draw call with new additions to 2 x 2 Texture Experiment. Replace a single input texture with a simple 2 x 2 texture or clamp to a selected MIP map level to see the performance delta and determine overall draw call impact.
- View and optimize the per-target, post-transformation geometry for a range of selected draw calls in DirectX 11 frames.
Intel® Inspector
- Inspector debugger add-on now supports Microsoft* Visual Studio* 2017.
- New OS support: SUSE* Linux* Enterprise Server* 12 SP3, Microsoft* Windows* 10 build 17134
- Bug fixes
Intel® System Debugger
Intel® Debug Extensions for WinDbg*
- Adds support for event-based breakpoints to debug ACPI Machine Language (AML).
- Adds ability to collect BSOD information with the get_bsod_info script.
Overview:
- Move from prototype to product easier with new capabilities that seamlessly import applications from Arduino Create* to Intel System Studio. Take advantage of System Studio’s advanced analyzers and debug tools for advanced system development. More tools and libraries also now support the Up Squared* Grove* IoT Development Kit. Learn more.
- Java* support – Developers can now create, build, run and edit native Java applications using Intel System Studio. Through the Project Creation Wizard, use the cloud connectors and access Intel IoT sensor libraries. Java examples can also be enabled for the Up Squared* Grove* IoT Development Kit.
- Easier access to code samples, automated configuration – Using code samples is now easier using the new Project Creation Wizard. All required configuration options are automatically set when sample projects are created.
- Connect with various cloud service providers’ APIs more simply via the cloud connector API explorer.
- Includes the latest updates for many of the performance libraries, and analysis and debugger tools.
Detailed New Features List
Eclipse* IDE
- Eclipse IDE on Linux* Ubuntu* 16.04.4 LTS now depends on GTK3, Ubuntu 17 and 18 will continue to use GTK2.
- Platform Manager now performs verbose Docker* image builds. Project Creation Wizards and Sensor Explorer have been streamlined for better user experience.
- Supports development of Wind River Linux* LTS* 17 applications. This is only supported on a Linux* host and does not support creation of an LTS 17 kernel image.
Intel® C++ Compiler 18.0
- More stable integration with Microsoft Visual Studio* 2017
- Fixes previously reported issues
Intel® Data Analytics Acceleration Library (Intel® DAAL)
- Host application interface is added to Intel® DAAL, which enables algorithm-level computation cancelling by user-defined callback. This interface is available in Decision Forest and Gradient Boosting Trees algorithms. New example code is provided.
- New technical preview for experimental Intel DAAL and its extension library
- Introduced distributed k-Nearest Neighbors classifiers for both training and prediction. Included new sample that demonstrates how to use this algorithm with Intel® MPI Library.
- Developed experimental extension library on top of existing pyDAAL package that provides an easy to use API for Intel DAAL neural networks. The extension library allows users to configure and train neural network models in a few lines of code, and the ability to use existing TensorFlow* and Caffe* models on inference stage.
- Gradient Boosting Trees training algorithm was extended with inexact splits calculation mode. It is applied to continuous features that are bucketed into discrete bins, and the possible splits are restricted by the buckets borders.
- Intel® Threading Building Blocks (Intel® TBB) dependency is removed in library sequential mode.
Intel® Math Kernel Library (Intel® MKL)
Intel® Integrated Performance Primitives (Intel® IPP)
IoT connection tools: MRAA & UPM Libraries
MRAA IO Communication Layer
- New APIs for sysfs onboard LED control using the gpio-leds driver
- Restructured and cleaned-up basic examples
UPM Sensor and Actuator Library
- Extended LED library to support the new MRAA gpio-leds APIs
- Cleaned-up doxygen tags in headers and class names in JSON library files to facilitate integration with the Sensor Explorer
Intel® VTune™ Amplifier
- New CPU/FPGA interaction analysis (Technical Preview) to assess the balance between the CPU and FPGA on systems with a discrete Intel® Arria® 10 FPGA running OpenCL™ applications
- New Graphics Rendering analysis (Technical Preview) for CPU/GPU utilization of your code running on the Xen* virtualization platform installed on a remote embedded target
- Support for the sampling command-line analysis on remote QNX* embedded systems via ethernet connection
Energy Analysis / Intel® SoC Watch
Intel® SoC Watch for Windows*
- Add support for Intel platform code named Gemini Lake
- Resolves several issues
Intel® SoC Watch for Linux* / Android*
- Add support for Intel® platform codenamed Gemini Lake.
- New feature group “sstate” added: Measures both operating system (Sx) and hardware (S0ix) platform sleep states on platforms that measure both.
Источник


