- Создание дампа потока
- Среда Windows
- JIRA работает от startup.bat
- JIRA работает как служба Windows
- Использование jstack
- Окружающая среда Linux / Unix / OS X
- Использование jstack и top
- Инструменты анализа
- Дамп потока обработки задачи с помощью TDA (NumberFormatException)
- Take thread dumps from a JVM
- Step 1: Get the PID of your Java process
- Step 2: Request a thread dump from the JVM
- jstack script
- Alternative ways to obtain a thread dump
- Take thread dumps from a JVM
- How can I take thread dumps from a JVM on Linux, UNIX or Windows?
- Step 1: Get the PID of your Java process
- Step 2: Request a thread dump from the JVM
- jstack script
- Alternative ways to obtain a thread dump
Создание дампа потока
Иногда возникают ситуации, при которых JIRA может «зависнуть» во время выполнения операции. В течение этого времени полезно получить дамп потока — журнал, содержащий информацию о текущих выполняемых потоках и процессах в виртуальной машине Java. Взятие дампов-потоков — это неразрушающий процесс, который можно запускать во время работающей системы JIRA. В рассматриваемых ниже инструкциях пользователю описаны шаги, необходимые для получения дампа- потока в различных используемых операционных системах JIRA .
Шаги, необходимые для получения дампа- потока, зависят от операционной системы JIRA и выполняются в соответствии с приведенными ниже инструкциями.
Среда Windows
JIRA работает от startup.bat
- В окне командной консоли (Command Console), где запущена JIRA, откройте диалоговое окно свойств, щелкнув правой кнопкой мыши на строке заголовка и выберите «Свойства» (Properties).
- Выберите вкладку «Макет» (Layout).
- В разделе «Размер буфера экрана» (Screen Buffer Size) установите значение «Высота» (Height) на «3000».
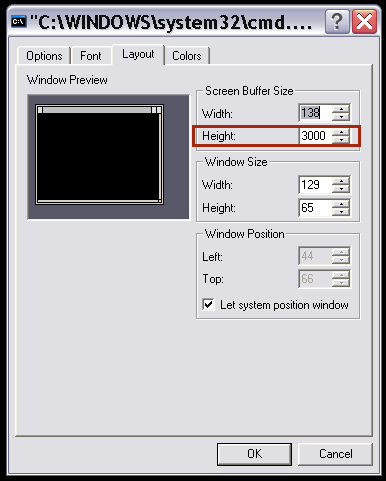
- Нажмите «ОК».
- С той же командной консоли в фокусе нажмите CTRL-BREAK. Это выведет дамп потока в консоль.
- Выполните прокрутку назад в командной консоли, пока не достигнете строки, содержащей «Полный дамп потока».
- Щелкните правой кнопкой мыши строку заголовка и выберите «Редактировать» (Edit)> «Отметить» (Mark). Выделите весь текст дампа потока.
- Щелкните правой кнопкой мыши строку заголовка и выберите «Правка» (Edit )> «Копировать» (Copy). Затем дамп потока можно вставить в текстовый файл.

JIRA работает как служба Windows
Использование jstack
JDK поставляется с инструментом jstack для создания дампов — потоков.
- Определите процесс. Запустите диспетчер задач, нажав Ctrl + Shift + Esc и найдите идентификатор процесса Java (JIRA). Вам может понадобиться добавить столбец PID с помощью View -> Select Columns .
- Запустите jstack
, чтобы захватить одиночный дамп потока. Эта команда примет один дамп потока идентификатора процесса
, в этом случае pid равен 22668:
Это выведет файл с именем threaddump.txt в ваш текущий каталог.
Общие проблемы с jstack:
- Вы должны запустить jstack как тот же пользователь, который запускает JIRA.
- Если вы получите сообщение об ошибке «Недостаточно памяти для обработки этой команды» (Not enough storage is available to process this command), загрузите здесь утилиту «psexec», а затем выполните следующую команду, используя:
psexec -s jstack
- Если исполняемый файл jstack не находится в вашем $ PATH, то, пожалуйста, найдите его в каталоге / bin
- Если вы получаете java.lang.NoClassDefFoundError: sun / tools / jstack / JStack, проверьте, что tools.jar присутствует в вашем каталоге lib JDK. Если это не так, загрузите полную версию JDK.
Окружающая среда Linux / Unix / OS X
Использование jstack и top
См. «Устранение неполадок производительности задач» с помощью дампов потоков для сочетания как верхнего, так и jstack, чтобы обеспечить вывод отдельных потоков центрального процессора вместе со своей трассировкой стека.
Альтернатива Linux / Unix: Командная строка
- Определите java-процесс, в котором работает JIRA. Этого можно добиться, выполнив команду, аналогичную:
Процесс будет выглядеть следующим образом:
- Чтобы получить дамп потока, выполните команду
где pid — это идентификатор процесса — в этом случае 910.
- Дамп потока будет записан на вывод консоли Tomcat. Консольный вывод перенаправляется в файл logs / catalina.out, который можно найти в каталоге установки JIRA для автономного / установщика JIRA или для JIRA WAR в каталоге установки Tomcat
Альтернатива Linux / Unix: создание дампов потоков с использованием jstack
Если у вас возникли проблемы с использованием kill -3
для получения дампа- потока, попробуйте использовать jstack утилиту java, которая будет выводить трассировки стека потоков Java для данного процесса.
- Определите javaprocess, в котором работает JIRA. Этого можно добиться, выполнив команду, аналогичную:
- Процесс будет выглядеть следующим образом:
для захвата одиночного дампа потока
Эта команда возьмет один дамп потока id процесса
, в этом случае pid будет 22668 и выведет на выход в файл JIRAthreaddump.txt
- Возьмите несколько дампов потоков
Как правило, вы захотите взять несколько дампов на временном интервале около 10 секунд. В этом случае вы можете создать несколько дампов и вывести трассировки стека в один файл следующим образом:
Если вы подключаетесь к серверу через RDP, jstack может завершиться сбоем со следующей ошибкой:
Вам нужно будет открыть сеанс RDP в консольном режиме: mstsc / admin
Инструменты анализа
Попробуйте TDA или Samurai проверить ваш дамп потока.
- Скачайте TDA.
- Смените каталог, где существует JAR.
- Запустите:
Откройте файл catalina.out, содержащий дамп потока
Дамп потока обработки задачи с помощью TDA (NumberFormatException)
Если вы получите сообщение об ошибке на консоли TDA, например:
Чтобы исправить формат заголовка потока и сделать его обрабатываемым, примените следующую команду в дампах потоков:
sed -i ‘s / prio = 8 \ <1,2 \>os_prio = 6 \ <1,2 \>/ prio = 5 / g’
sed -i » ‘s/prio=2\ <1,2\>os_prio=1\<1,2\>/prio=5/g’
Источник
Take thread dumps from a JVM
A thread dump is a list of all the Java threads that are currently active in a Java Virtual Machine (JVM).
There are several ways to take thread dumps from a JVM. It is highly recommended to take more than 1 thread dump. A good practice is to take 10 thread dumps at a regular interval (for example, one thread dump every ten seconds).
Step 1: Get the PID of your Java process
The first piece of information you will need to be able to obtain a thread dump is your Java process’s PID.
The Java JDK ships with the jps command which lists all Java process ids. You can run this command like this:
jps -l 70660 sun.tools.jps.Jps 70305
Note: In Linux and UNIX, you may have to run this command as sudo -u user jps -l , where «user» is the username of the user that the Java process is running as.
If this doesn’t work or you still cannot find your Java process, (path not set, JDK not installed, or older Java version), use
- UNIX, Linux, and Mac OS X: ps -el | grep java
- Windows: Press Ctrl+Shift+Esc to open the task manager and find the PID of the Java process
Step 2: Request a thread dump from the JVM
jstack
If installed/available, we recommend using the jstack tool. It prints thread dumps to the command line console.
To obtain a thread dump using jstack, run the following command:
jstack -l
You can output consecutive thread dumps to a file by using the console output redirect/append directive:
jstack -l
- The jstack tool is available since JDK 1.5 (for JVM on Windows, it’s available in some versions of JDK 1.5 and JDK 1.6 only).
- jstack works even if the -Xrs jvm parameter is enabled
- It’s not possible to use the jstack tool from JDK 1.6 to take threaddumps from a process running on JDK 1.5.
- In Linux and UNIX, you need to run the command as the user that owns the java process:
sudo -u java-user jstack -l
( should be replaced with the id of the user that the Java process is running as) - In Windows, if you run jstack and get the error «Not enough storage is available to process this command» then you must run jstack as the windows SYSTEM user or the user that owns the java process. You can do this by using psexec which you can download here. To run jstack as SYSTEM user, use a command like this:
psexec -s jstack >> threaddumps.log
If you are unable to install psexec on the server, then you can create a .bat file containing the command and run it using the Windows task scheduler (as a different user). - If the java process isn’t responding, then it can sometimes help to use the option -J-d64 (on 64 bit systems), for example:
jstack -J-d64 -l
>> threaddumps.log
If the jstack command ( jstack -l
>> threaddumps.log ) throws the error [1] below, then run the command as the user that owns the java process. For example:
sudo -u sling jstack -l
jstack script
Here’s a script (adapted from the one on eclipse.org) that will take a series of thread dumps using jstack. It also takes the thread level cpu usage using top command as well.
Just run it like this:
sudo -u jstackSeries.sh
For example:
sudo -u aemuser jstackSeries.sh 1234 aemserveruser 10 3
- 1234 is the pid of the Java process
- cq5serveruser is the Linux or UNIX user that the Java process runs as
- 10 is how many thread dumps to take
- 3 is the delay between each dump
Note: The top output has the native thread id in decimal format while the jstack output has the nid in hexadecimal. You can match the high cpu thread from the top output to the jstack output by converting the thread id to hexadecimal.
Thread Dump Tool for Adobe Experience Manager
If you are using Adobe Experience Manager product then you can install this tool to have a simple UI for generating thread dumps.
Alternative ways to obtain a thread dump
If the jstack tool is not available to you then you can take thread dumps as follows:
Note: Some tools cannot take thread dumps from the JVM if the commandline parameter -Xrs is enabled. If you are having trouble taking thread dumps then please see if this option is enabled.
UNIX, Mac OS X, and Linux (JDK 1.4 or lesser version)
On UNIX, Mac OS X, and Linux, you can send a QUIT signal to the Java process to tell it to output a thread dump to standard output.
- Run this command to do this:
kill -QUIT
where «user» is the user that the Java process is running as.
Windows:
JDK 1.X
- Download javadump.exe (attached below).
- Start the JVM with these three arguments (they must be in the right order):
-XX:+UnlockDiagnosticVMOptions -XX:+LogVMOutput -XX:LogFile=C:\temp\jvmoutput.log - Press Ctrl+Shift+Esc to open the Task Manager.
- Find the PID of the Java process.
- From the command line, run
javadump.exe
JDK 1.6
Get a thread dump from jconsole tool, by using a plugin: [0]
Here’s how you can request a thread dump:
- Add the following parameter to the jvm running Communique : -Dcom.sun.management.jmxremote
- Download and install JDK 1.6 (if not done yet).
- Download and extract the Thread Dump Analyzer utility. [1]
- Run jconsole.exe of JDK 1.6:
jconsole.exe -pluginpath /path/to/file/tda.jar - Click the Thread dumps tab.
- Click the Request Thread Dump link.
Note: If you are running AEM 6.* and want to observe the running threads, you can request http:// :
/system/console/status-Threads to get a thread list. However, please note that these thread dumps will not work with thread dump analysis tools such as samurai or tda.
Источник
Take thread dumps from a JVM

某些 Creative Cloud 应用程序、服务和功能在中国不可用。
How can I take thread dumps from a JVM on Linux, UNIX or Windows?
A thread dump is a list of all the Java threads that are currently active in a Java Virtual Machine (JVM).
There are several ways to take thread dumps from a JVM. It is highly recommended to take more than 1 thread dump. A good practice is to take 10 thread dumps at a regular interval (for example, one thread dump every ten seconds).
Step 1: Get the PID of your Java process
The first piece of information you will need to be able to obtain a thread dump is your Java process’s PID.
The Java JDK ships with the jps command which lists all Java process ids. You can run this command like this:
jps -l 70660 sun.tools.jps.Jps 70305
Note: In Linux and UNIX, you may have to run this command as sudo -u user jps -l , where «user» is the username of the user that the Java process is running as.
If this doesn’t work or you still cannot find your Java process, (path not set, JDK not installed, or older Java version), use
- UNIX, Linux, and Mac OS X: ps -el | grep java
- Windows: Press Ctrl+Shift+Esc to open the task manager and find the PID of the Java process
Step 2: Request a thread dump from the JVM
jstack
If installed/available, we recommend using the jstack tool. It prints thread dumps to the command line console.
To obtain a thread dump using jstack, run the following command:
jstack -l
You can output consecutive thread dumps to a file by using the console output redirect/append directive:
jstack -l
- The jstack tool is available since JDK 1.5 (for JVM on Windows, it’s available in some versions of JDK 1.5 and JDK 1.6 only).
- jstack works even if the -Xrs jvm parameter is enabled
- It’s not possible to use the jstack tool from JDK 1.6 to take threaddumps from a process running on JDK 1.5.
- In Linux and UNIX, you need to run the command as the user that owns the java process:
sudo -u java-user jstack -l
( should be replaced with the id of the user that the Java process is running as) - In Windows, if you run jstack and get the error «Not enough storage is available to process this command» then you must run jstack as the windows SYSTEM user or the user that owns the java process. You can do this by using psexec which you can download here. To run jstack as SYSTEM user, use a command like this:
psexec -s jstack >> threaddumps.log
If you are unable to install psexec on the server, then you can create a .bat file containing the command and run it using the Windows task scheduler (as a different user). - If the java process isn’t responding, then it can sometimes help to use the option -J-d64 (on 64 bit systems), for example:
jstack -J-d64 -l
>> threaddumps.log
If the jstack command ( jstack -l
>> threaddumps.log ) throws the error [1] below, then run the command as the user that owns the java process. For example:
sudo -u sling jstack -l
jstack script
Here’s a script (adapted from the one on eclipse.org) that will take a series of thread dumps using jstack. It also takes the thread level cpu usage using top command as well.
Just run it like this:
sudo -u jstackSeries.sh
For example:
sudo -u aemuser jstackSeries.sh 1234 aemserveruser 10 3
- 1234 is the pid of the Java process
- cq5serveruser is the Linux or UNIX user that the Java process runs as
- 10 is how many thread dumps to take
- 3 is the delay between each dump
Note: The top output has the native thread id in decimal format while the jstack output has the nid in hexadecimal. You can match the high cpu thread from the top output to the jstack output by converting the thread id to hexadecimal.
Thread Dump Tool for Adobe Experience Manager
If you are using Adobe Experience Manager product then you can install this tool to have a simple UI for generating thread dumps.
Alternative ways to obtain a thread dump
If the jstack tool is not available to you then you can take thread dumps as follows:
Note: Some tools cannot take thread dumps from the JVM if the commandline parameter -Xrs is enabled. If you are having trouble taking thread dumps then please see if this option is enabled.
UNIX, Mac OS X, and Linux (JDK 1.4 or lesser version)
On UNIX, Mac OS X, and Linux, you can send a QUIT signal to the Java process to tell it to output a thread dump to standard output.
- Run this command to do this:
kill -QUIT
where «user» is the user that the Java process is running as.
Windows:
JDK 1.X
- Download javadump.exe (attached below).
- Start the JVM with these three arguments (they must be in the right order):
-XX:+UnlockDiagnosticVMOptions -XX:+LogVMOutput -XX:LogFile=C:\temp\jvmoutput.log - Press Ctrl+Shift+Esc to open the Task Manager.
- Find the PID of the Java process.
- From the command line, run
javadump.exe
JDK 1.6
Get a thread dump from jconsole tool, by using a plugin: [0]
Here’s how you can request a thread dump:
- Add the following parameter to the jvm running Communique : -Dcom.sun.management.jmxremote
- Download and install JDK 1.6 (if not done yet).
- Download and extract the Thread Dump Analyzer utility. [1]
- Run jconsole.exe of JDK 1.6:
jconsole.exe -pluginpath /path/to/file/tda.jar - Click the Thread dumps tab.
- Click the Request Thread Dump link.
Note: If you are running AEM 6.* and want to observe the running threads, you can request http:// :
/system/console/status-Threads to get a thread list. However, please note that these thread dumps will not work with thread dump analysis tools such as samurai or tda.
Источник


