- Installation
- Installing on Linux #
- Installing with PECL #
- Installing on Windows #
- Installation From Source #
- Obtain #
- Compile #
- Configure PHP #
- Related Settings and Functions
- Settings
- string xdebug.log = #
- integer xdebug.log_level = 7 #
- string xdebug.mode = develop #
- Functions
- xdebug_info() : void #
- Xdebug. Установка отладчика (дебагера) PhpStorm для Windows
- Установка Xdebug
- Проверка работы отладчика Xdebug
Installation
This section describes on how to install Xdebug.
How you install Xdebug depends on your system. There are the following possibilities:
- Linux with a package manager such as apt , yum , or something else.
- Linux without an Xdebug package with PECL.
- macOSX with homebrew, through PECL.
- Windows, with help from a wizard.
- Unix-like operating systems, from source.
Installing on Linux #
Installing Xdebug with a package manager is often the fastest way. Depending on your distribution, run the following command:
- Alpinelinux:
sudo apk add php7-pecl-xdebug - Arch Linux:
sudo pacman -S xdebug - CentOS:
sudo yum install php-xdebug - CentOS (Remi Repro):
sudo yum install php74-php-xdebug - Debian (9/stretch, testing/buster/bullseye/sid):
sudo apt-get install php-xdebug - Fedora (32):
sudo yum install php-xdebug - Fedora (Remi Repro):
sudo yum install php74-php-xdebug - Gentoo:
emerge dev-php/xdebug - Manjaro (20.1/Mikah):
sudo pacman -S xdebug - RHEL:
sudo yum install php-xdebug - RHEL (Remi Repro):
sudo yum install php74-php-xdebug - SUSE (openSUSE, Enterprise):
sudo zypper in php7-xdebug - Ubuntu (18.04 LTS/Bionic, 20.04 LTS/Focal):
sudo apt-get install php-xdebug - Ubuntu (Ondřej Surý’s PPA):
sudo apt-get install php7.4-xdebug
Linux distributions might be providing an old and/or outdated version. If the package manager installs a version that is no longer supported (see Supported Versions), please install Xdebug with PECL, or from source instead.
Xdebug’s latest version is 3.0.4.
Installing with PECL #
You can install Xdebug through PECL on Linux & macOS with Homebrew. Run:
On Apple M1 hardware, you might instead need to use:
Warning: You should ignore any prompts to add «extension=xdebug.so» to php.ini — this will cause problems.
In some cases pecl will change the php.ini file to add a configuration line to load Xdebug. You can check whether it did by running php -v . If Xdebug shows up with a version number, than you’re all set and you can configure Xdebug’s other functions, such as Step Debugging, or Profiling.
If pecl did not add the right line, skip to the Configure PHP section.
1 On macOS, you should have PHP installed with Homebrew.
Installing on Windows #
There are a few precompiled modules for Windows, they are all for the non-debug version of PHP. You can get those at the download page. Follow these instructions to get Xdebug installed.
Installation From Source #
Obtain #
You can download the source of the latest stable release 3.0.4.
Alternatively you can obtain Xdebug from GIT:
This will checkout the latest development version which is currently 3.1.0-dev. This development branch might not always work as expected, and may have bugs.
You can also browse the source on GitHub at https://github.com/xdebug/xdebug.
Compile #
There is a wizard available that provides you with the correct file to download, and which paths to use.
You compile Xdebug separately from the rest of PHP. You need access to the scripts phpize and php-config . If your system does not have phpize and php-config , you will need to install the PHP development headers.
Debian users can do that with:
And RedHat and Fedora users with:
It is important that the source version matches the installed version as there are slight, but important, differences between PHP versions. Once you have access to phpize and php-config , take the following steps:
Unpack the tarball:
tar -xzf xdebug-3.0.4.tgz
You should not unpack the tarball inside the PHP source code tree. Xdebug is compiled separately, all by itself, as stated above.
If phpize is not in your path, please make sure that it is by expanding the PATH environment variable. Make sure you use the phpize that belongs to the PHP version that you want to use Xdebug with. See this FAQ entry if you’re having some issues with finding which phpize to use.
Configure PHP #
Add the following line to php.ini :
To find out which php.ini file to modify, run a script with the following:
Alternatively, you can run php —ini on the command line.
Note: There could be more than one php.ini file. In many set-ups there is a different one for the command line (often cli/php.ini ) and the web server (often fpm/php.ini ).
Note: If you want to use Xdebug and OPCache together, you must have the zend_extension line for Xdebug below the line for OPCache. Otherwise, they won’t work properly together.
Restart your webserver, or PHP-FPM, depending on what you are using.
Verify that Xdebug is now loaded.
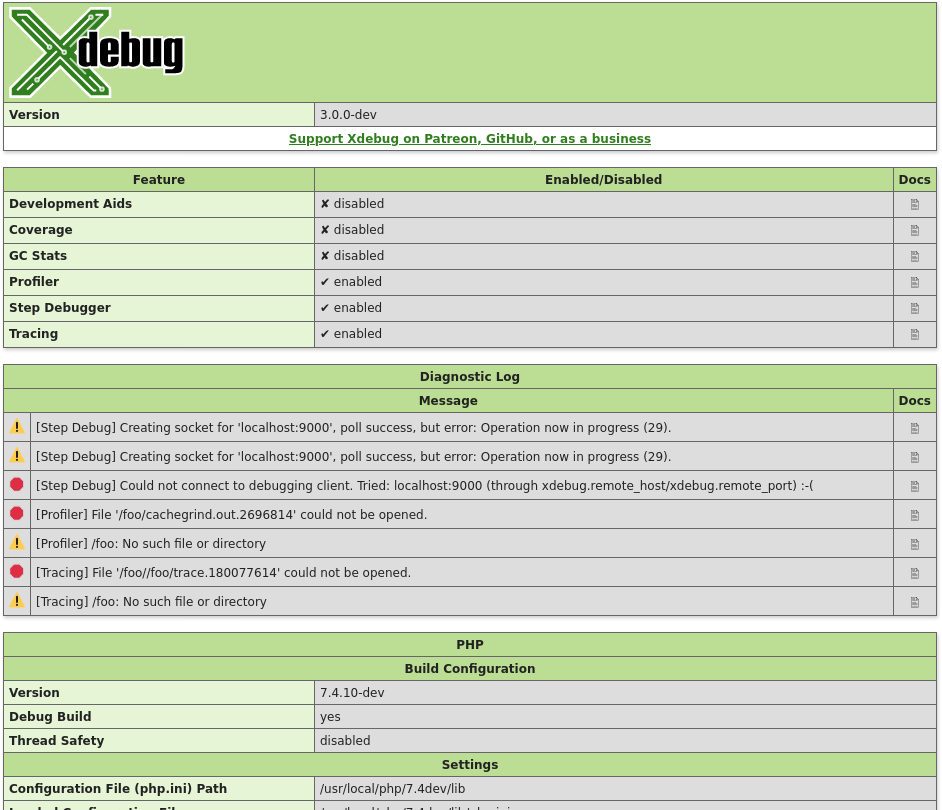
Create a PHP page that calls xdebug_info(). If you request the page through the browser, it should show you an overview of Xdebug’s settings and log messages.
On the command line, you can also run php -v . Xdebug and its version number should be present as in:
With Xdebug loaded, you can now enable individual features, such as Step Debugging, or Profiling.
Related Settings and Functions
- string xdebug.log =
- integer xdebug.log_level = 7
- string xdebug.mode = develop
- xdebug_info () : void
Settings
string xdebug.log = #
Configures Xdebug’s log file.
Xdebug will log to this file all file creations issues, Step Debugging connection attempts, failures, and debug communication.
Enable this functionality by setting the value to a absolute path. Make sure that the system user that PHP runs at (such as www-data if you are running with Apache) can create and write to the file.
The file is opened in append-mode, and will therefore not be overwritten by default. There is no concurrency protection available.
The log file will include any attempt that Xdebug makes to connect to an IDE:
It includes the opening time ( 2020-09-02 07:19:09.616195 ), the IP/Hostname and port Xdebug is trying to connect to ( localhost:9003 ), and whether it succeeded ( Connected to client 🙂 ). The number in brackets ( [2693358] ) is the Process ID.
It includes: [2693358] process ID in brackets 2020-09-02 07:19:09.616195 opening time
All warnings and errors are described on the Description of errors page, with detailed instructions on how to resolve the problem, if possible. All errors are always logged through PHP’s internal logging mechanism (configured with error_log in php.ini ). All warnings and errors also show up in the diagnostics log that you can view by calling xdebug_info().
Step Debugger Communication
The debugging log can also log the communication between Xdebug and an IDE. This communication is in XML, and starts with the XML element:
The fileuri attribute lists the entry point of your application, which can be useful to compare to breakpoint_set commands to see if path mappings are set-up correctly.
Beyond the element, you will find the configuration of features:
You can read about DBGP — A common debugger protocol specification at its dedicated documation page.
The xdebug.log_level setting controls how much information is logged.
Note: Many Linux distributions now use systemd, which implements private tmp directories. This means that when PHP is run through a web server or as PHP-FPM, the /tmp directory is prefixed with something akin to:
This setting can additionally be configured through the XDEBUG_CONFIG environment variable.
integer xdebug.log_level = 7 #
Configures which logging messages should be added to the log file.
The log file is configured with the xdebug.log setting.
The following levels are supported:
| Level | Name | Example |
|---|---|---|
| 0 | Criticals | Errors in the configuration |
| 1 | Errors | Connection errors |
| 3 | Warnings | Connection warnings |
| 5 | Communication | Protocol messages |
| 7 | Information | Information while connecting |
| 10 | Debug | Breakpoint resolving information |
Criticals, errors, and warnings always show up in the diagnostics log that you can view by calling xdebug_info().
Criticals and errors are additionally logged through PHP’s internal logging mechanism (configured with error_log in php.ini ).
This setting can additionally be configured through the XDEBUG_CONFIG environment variable.
string xdebug.mode = develop #
This setting controls which Xdebug features are enabled.
This setting can only be set in php.ini or files like 99-xdebug.ini that are read when a PHP process starts (directly, or through php-fpm), but not in .htaccess and .user.ini files, which are read per-request.
The following values are accepted:
off Nothing is enabled. Xdebug does no work besides checking whether functionality is enabled. Use this setting if you want close to 0 overhead. develop Enables Development Aids including the overloaded var_dump(). coverage Enables Code Coverage Analysis to generate code coverage reports, mainly in combination with PHPUnit. debug Enables Step Debugging. This can be used to step through your code while it is running, and analyse values of variables. gcstats Enables Garbage Collection Statistics to collect statistics about PHP’s Garbage Collection Mechanism. profile Enables Profiling, with which you can analyse performance bottlenecks with tools like KCacheGrind. trace Enables the Function Trace feature, which allows you record every function call, including arguments, variable assignment, and return value that is made during a request to a file.
You can enable multiple modes at the same time by comma separating their identifiers as value to xdebug.mode: xdebug.mode=develop,trace .
You can also set the mode by setting the XDEBUG_MODE environment variable on the command-line; this will take precedence over the xdebug.mode setting, but will no change the value of the xdebug.mode setting.
Functions
xdebug_info() : void #
Show diagnostic information
This function returns an HTML page which shows diagnostic information. It is analogous to PHP’s phpinfo() function.
The HTML output includes which mode is active, what the settings are, and diagnostic information in case there are problems with debugging connections, opening of files, etc.
Each warning and error in the diagnostics log also links through to the Description of errors documentation page.
This site and all of its contents are Copyright © 2002-2021 by Derick Rethans.
All rights reserved.
Xdebug. Установка отладчика (дебагера) PhpStorm для Windows
В этой статье мы рассмотрим возможность подключения интерпретатора PHP, отладчика Xdebug к PhpStorm на OC Windows и использование встроенного в IDE web-сервера.
Начнем с установки отладчика Xdebug в PHP.
Установка Xdebug
Первым делом убедимся в том, что интерпретатор PHP установлен в систему и доступен, открыв командную строку и введя следующую команду: php -v
Должна появится информация о версии PHP, подобно этой:
Если этого не произошло, тогда делаем следующее:
- Скачиваем интерпретатор PHP по ссылке: http://windows.php.net/downloads/releases/php-5.6.29-nts-Win32-VC11-x64.zip и распаковываем его, например, в директорию C:\php
- Далее, нажав правой кнопкой мыши на значке Этот компьютер, выбираем пункт Свойства -> Дополнительные параметры системы

- В открывшемся окне выбираем вкладку Дополнительно, кнопка Переменные среды

- В разделе Переменные среды пользователя ищем переменную PATH. Если её нет, то создаем:
- Имя переменной: PATH
- Путь до директории, в которую вы распаковали архив с PHP. В моем случае будет так:
- Значение переменной: C:\php

- Сохраняем и обязательно перезапускаем консоль!
Теперь можно снова проверить работу PHP командой php -v. Должна вывестись корректно версия PHP, как было показано выше.
Теперь можно перейти к установке отладчика Xdebug, для которого существует специальный помощник, значительно упрощающий процедуру установки. Для его использования перейдем по ссылке:
На этой странице, необходимо ввести в поле ввода информацию об установленном PHP-интерпретаторе, которая генерируется с помощью PHP-функции phpinfo(). Вводить нужно весь скопированный текст со страницы.
Или, введя в консоль команду php -i, которая генерирует информацию о PHP.
Копируем полученную информацию, нажимаем кнопку Analyse my phpinfo() output и получаем инструкцию по установке Xdebug.
В зависимости от вашей версии PHP и пути установки инструкция может отличаться от моей:
Перемещаем её в папку C:\php\ext
В файл C:\php\php.ini (если такого файла нет, ищем файл файл php.ini-development и переименовываем его в php.ini) находим секцию Dynamic Extensions и добавляем следующую строку:
Подключение интерпретатора PHP к PhpStorm
Теперь перейдем в PhpStorm и откроем настройки комбинацией клавиш Ctrl+Alt+S.
Далее, в секции Languages & Frameworks выберем пункт PHP. В этой секции необходимо назначить интерпретатор для IDE в пункте Interpreter нажав на кнопку …

В открывшемся окне, нажимаем на кнопку +, выбираем пункт Other local… в поле Name вводим любое имя для удобства дальнейшей идентификации, например: PHP 5.6.
В поле PHP executable указываем путь до интерпретатора, например: C:\php\php.exe. Обратите внимание на появившуюся версию PHP и дебагера, что свидетельствует о правильности установки.

Чтобы убедиться в том, что правильно отрабатывает подключенный интерпретатор PHP, создадим в PhpStorm новый проект, добавим к нему файл index.php и запишем в этот файл, например, функцию var_dump([ 1, 2, 3 ]) с переданным в нее массивом.
Работа с отладчиком Xdebug в PhpStorm
Прежде чем приступить к отладке PHP-скриптов с помощью Xdebug произведем необходимую настройку в файле php.ini. В секции Dynamic Extensions, после подключения расширения Xdebug, добавим следующие настройки:
Теперь зайдем в PhpStorm и откроем настройки. Перейдем в Languages & Frameworks -> PHP -> Debug. В секции Xdebug убедимся, что установлены следующие настройки:

Проверка работы отладчика Xdebug
Чтобы проверить, что все действия были проведены верно, создадим в новом проекте файл index.php и напишем следующий код:

И поставим точку остановки на строке с var_dump().
Теперь запустим отладку этого скрипта, нажав правую кнопку мыши и выбрав пункт Debug ‘index.php’.

Если все было сделано правильно, то в PhpStorm появится вывод дебага, как показано на скриншоте.


