- 5 commands to check memory usage on Linux
- Memory Usage
- 1. free command
- 2. /proc/meminfo
- 3. vmstat
- 4. top command
- 5. htop
- RAM Information
- Summary
- 66 thoughts on “ 5 commands to check memory usage on Linux ”
- How to Monitor CPU and Memory on Linux?
- Install htop on Ubuntu
- Install htop on CentOS/RHEL 8.x
- glances
- Monit
- Monitorix
- Netdata
- Conclusion
- 9 команд для проверки информации о CPU в Linux
5 commands to check memory usage on Linux
Memory Usage
On linux, there are commands for almost everything, because the gui might not be always available. When working on servers only shell access is available and everything has to be done from these commands. So today we shall be checking the commands that can be used to check memory usage on a linux system. Memory include RAM and swap.
It is often important to check memory usage and memory used per process on servers so that resources do not fall short and users are able to access the server. For example a website. If you are running a webserver, then the server must have enough memory to serve the visitors to the site. If not, the site would become very slow or even go down when there is a traffic spike, simply because memory would fall short. Its just like what happens on your desktop PC.
1. free command
The free command is the most simple and easy to use command to check memory usage on linux. Here is a quick example
The m option displays all data in MBs. The total os 7976 MB is the total amount of RAM installed on the system, that is 8GB. The used column shows the amount of RAM that has been used by linux, in this case around 6.4 GB. The output is pretty self explanatory. The catch over here is the cached and buffers column. The second line tells that 4.6 GB is free. This is the free memory in first line added with the buffers and cached amount of memory.
Linux has the habit of caching lots of things for faster performance, so that memory can be freed and used if needed.
The last line is the swap memory, which in this case is lying entirely free.
2. /proc/meminfo
The next way to check memory usage is to read the /proc/meminfo file. Know that the /proc file system does not contain real files. They are rather virtual files that contain dynamic information about the kernel and the system.
Check the values of MemTotal, MemFree, Buffers, Cached, SwapTotal, SwapFree.
They indicate same values of memory usage as the free command.
3. vmstat
The vmstat command with the s option, lays out the memory usage statistics much like the proc command. Here is an example
The top few lines indicate total memory, free memory etc and so on.
4. top command
The top command is generally used to check memory and cpu usage per process. However it also reports total memory usage and can be used to monitor the total RAM usage. The header on output has the required information. Here is a sample output
Check the KiB Mem and KiB Swap lines on the header. They indicate total, used and free amounts of the memory. The buffer and cache information is present here too, like the free command.
5. htop
Similar to the top command, the htop command also shows memory usage along with various other details.
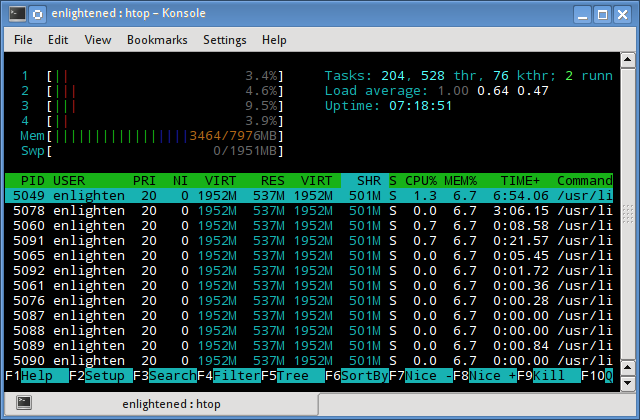
The header on top shows cpu usage along with RAM and swap usage with the corresponding figures.
RAM Information
To find out hardware information about the installed RAM, use the demidecode command. It reports lots of information about the installed RAM memory.
Provided information includes the size (2048MB), type (DDR2) , speed(667 Mhz) etc.
Summary
All the above mentioned commands work from the terminal and do not have a gui. When working on a desktop with a gui, it is much easier to use a GUI tool with graphical output. The most common tools are gnome-system-monitor on gnome and
ksysguard on KDE. Both provide resource usage information about cpu, ram, swap and network bandwidth in a graphical and easy to understand visual output.
A Tech Enthusiast, Blogger, Linux Fan and a Software Developer. Writes about Computer hardware, Linux and Open Source software and coding in Python, Php and Javascript. He can be reached at [email protected] .
66 thoughts on “ 5 commands to check memory usage on Linux ”
You have explained the topic very well. Thanks for sharing a nice article.
Thanks for these commands. It saved a lots of time.
How about explaining what we are looking for? Most people would know these commands. Waste of time.
Please correct the typo in “RAM Information” section. The command for viewing hardware info about RAM is “dmidecode” and not “demidecode”.
And it also requires root privileges.
Источник
How to Monitor CPU and Memory on Linux?
![]()
Geekflare is supported by our audience. We may earn affiliate commissions from buying links on this site.
Know how much an individual process or system-wide consume CPU or memory.
As a sysadmin, you often have to deal with an incident where the application is slow or unresponsive due to high CPU/memory/network utilization. If the server host just one process, then it’s easy to find out when the process consumes all the resources. However, imagine a shared server where multiple services are running, and you need to find which one is eating all the resources.
There are many monitoring software which does this out of the box. But if you don’t have one or looking for a command-based solution, then here you go. They are all FREE!
You may want to start by looking into top or htop result to see the processes overview.
As you can see below, it gives an excellent idea about what all processes are utilizing. If you look at the first one, which is MySQL is taking 11.9% of CPU and 2.5% of CPU.
The top is installed on almost all Linux distribution.
Once you identify the suspect, then you may want to focus on that process instead of everything like you saw above. You can still use top command but with some argument.
Let’s say you know the process id (PID); you can use the below command.
Below an example of top -p 3102
You may also use grep with top . Below an example of checking Docker utilization.
Similar to the top but with more information. As you can, it got the command column, which is handy to identify the process path. And also it is colorful.

htop may not be installed by default, but you can always do it as below.
Install htop on Ubuntu
Install htop on CentOS/RHEL 8.x
glances
As the name says, you get a system utilization view on a single screen. Running processes are sorted by their CPU utilization.

You can install glances on CentOS 8 using DNF as below.
for CentOS7, you can use YUM
A similar to the above listed but with a brilliant feature to record the output in a file so you can view them later. Imagine there is a pattern of having an issue at a specific time window. You can schedule to write the output in a file through crontab or other, and later you can playback.
To record the output in a file:
and, to playback:
It supports multiple arguments like interval, samples, etc. and I would strongly recommend taking a look at the man page.
If you are just interested in real-time troubleshooting, then just execute atop and you should see like below.

You can install atop as below.
Let’s check ps command now.
You can use the ps command with PID to print their CPU and memory utilization.
The output should look like this.
Interactive command-line monitoring tool for CPU, memory, disks, network, NFS, and virtual memory utilization. To view the top process (by utilization), you can execute nmon and press t button.

You can install nmon as below.
Monit
Monit is a web-based and command-line open-source solution to monitor server resources, daemons, files, directory, file systems, etc.

Monit also got a cool widget.
Its light-weight monitoring software. But, there is more to explore here.
Monitorix
A lightweight open-source utility to monitor the Linux server. Monitorix got in-built HTTP so you can check the utilization and other stuff on the web. Some of the other usage reports include:
- Kernal/temperature
- Filesystem and I/O
- Network traffic
- Apache/Mail/FTP/Nginx
- MySQL/Varnish/Memcached
Monitorix also offers alert configuration so you can get notified when things are not right. It will be a good choice when you are managing cloud-based servers and looking for a proactive monitoring solution.
Netdata
Netdata is a real-time performance monitoring for system resources, applications, web servers, databases, DNS, mail, hardware sensors, and a lot more. It is open-source and getting started is easy. All the data is collected, stored, and streamed for you to visualize interactively. Data is collected every second, so you never miss anything.

Loved by many industry leaders.

So what you are waiting for, try and take control of your Linux servers.
Conclusion
I hope the above tools help you to visualize the server utilization in real-time so you can take necessary action. If you just started as a system administrator and looking to get hands-on training, then check out this Udemy course.
Источник
9 команд для проверки информации о CPU в Linux

Информация об аппаратном обеспечении CPU
Информация о CPU (Central Processing Unit. Центральный процессор) включает в себя подробные сведения о процессоре, такие как архитектура, название производителя, модель, количество ядер, скорость каждого ядра и т.д.
В linux существует довольно много команд для получения подробной информации о CPU.
В этой статье мы рассмотрим некоторые из часто встречающихся команд, которые можно использовать для получения подробной информации о CPU.
1. /proc/cpuinfo
Файл /proc/cpuinfo содержит подробную информацию об отдельных ядрах CPU.
Выведите его содержимое с помощью less или cat .
Каждый процессор или ядро перечислены отдельно, а различные подробности о скорости, размере кэша и названии модели включены в описание.
Чтобы подсчитать количество процессоров, используйте grep с wc
Количество процессоров, показанное в /proc/cpuinfo, может не соответствовать реальному количеству ядер процессора. Например, процессор с 2 ядрами и гиперпоточностью будет показан как процессор с 4 ядрами.
Чтобы получить фактическое количество ядер, проверьте идентификатор ядра на наличие уникальных значений
Соответственно, есть 4 разных идентификатора ядра. Это указывает на то, что существует 4 реальных ядра.
2. lscpu — отображение информации об архитектуре CPU
lscpu — это небольшая и быстрая команда, не требующая никаких опций. Она просто выводит информацию об аппаратном обеспечении CPU в удобном для пользователя формате.
3. hardinfo
Hardinfo — это gui инструмент на базе gtk, который генерирует отчеты о различных аппаратных компонентах. Но он также может запускаться из командной строки, в случае если отсутствует возможность отображения gui (Graphical User Interface — графический интерфейс пользователя).
Он создаст большой отчет о многих аппаратных частях, читая файлы из каталога /proc. Информация о CPU находится в начале отчета. Отчет также может быть записан в текстовый файл.
Hardinfo выполняет несколько эталонных тестов, занимающих несколько минут, прежде чем вывести отчет на экран.
4. lshw
Команда lshw может отобразить ограниченную информацию о CPU. lshw по умолчанию показывает информацию о различных аппаратных частях, а опция ‘ -class ‘ может быть использована для сбора информации о конкретной аппаратной части.
Производитель, модель и скорость процессора отображаются правильно. Однако из приведенного выше результата невозможно определить количество ядер в процессоре.
Чтобы узнать больше о команде lshw, ознакомьтесь с этой статьей:
5. nproc
Команда nproc просто выводит количество доступных вычислительных блоков. Обратите внимание, что количество вычислительных блоков не всегда совпадает с количеством ядер.
6. dmidecode
Команда dmidecode отображает некоторую информацию о CPU, которая включает в себя тип сокета, наименование производителя и различные флаги.
7. cpuid
Команда cpuid собирает информацию CPUID о процессорах Intel и AMD x86.
Программа может быть установлена с помощью apt на ubuntu
А вот пример вывода
8. inxi
Inxi — это скрипт, который использует другие программы для создания хорошо структурированного легко читаемого отчета о различных аппаратных компонентах системы. Ознакомьтесь с полным руководством по inxi.
Вывод соответствующей информации о CPU/процессоре
Чтобы узнать больше о команде inxi и ее использовании, ознакомьтесь с этой статьей:
9. Hwinfo
Команда hwinfo — это программа для получения информации об оборудовании, которая может быть использована для сбора подробных сведений о различных аппаратных компонентах в системе Linux.
Она также отображает информацию о процессоре. Вот быстрый пример:
Если не использовать опцию «—short», команда отобразит гораздо больше информации о каждом ядре CPU, например, архитектуру и характеристики процессора.
Чтобы более подробно изучить команду hwinfo, ознакомьтесь с этой статьей:
Заключение
Это были некоторые команды для проверки информации о CPU в системах на базе Linux, таких как Ubuntu, Fedora, Debian, CentOS и др.
Примеры других команд для проверки информации о CPU смотрите в этой статье:
Большинство команд обрабатываются с помощью интерфейса командной строки и выводятся в текстовом формате. Для GUI интерфейса используйте программу Hardinfo.
Она показывает подробности об аппаратном обеспечении различных компонентов в простом для использования GUI интерфейсе.
Если вы знаете какую-либо другую полезную команду, которая может отображать информацию о CPU, сообщите нам об этом в комментариях ниже
Если вы хотели бы узнать подробнее о формате обучения и программе, познакомиться с преподавателем курса — приглашаем на день открытых дверей онлайн. Регистрация здесь.
А если вам интересно развитие в этой сфере с нуля до pro, рекомендуем ознакомиться с учебной программой специализации.
Источник


