- Linux – Determine / Find Ethernet Connection Speed
- How do I determine ethernet connection speed?
- 18 Commands to Monitor Network Bandwidth on Linux server
- Network monitoring on Linux
- 1. Nload
- 2. iftop
- 3. iptraf
- 4. nethogs
- 5. bmon
- 6. slurm
- 7. tcptrack
- 8. Vnstat
- 9. bwm-ng
- 10. cbm — Color Bandwidth Meter
- 11. speedometer
- 12. Pktstat
- 13. Netwatch
- 14. Trafshow
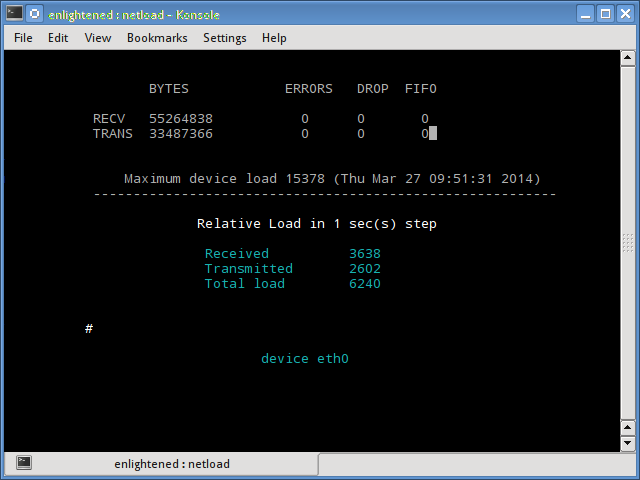
- 15. Netload
- 16. ifstat
- 17. dstat
- 18. collectl
- Summary
- 88 thoughts on “ 18 Commands to Monitor Network Bandwidth on Linux server ”
Linux – Determine / Find Ethernet Connection Speed
Most intelligent network devices use an autonegotiation protocol to communicate what media technologies they support, and then select the fastest mutually supported media technology.
How do I determine ethernet connection speed?
Type the following command to get speed for eth0:
$ ethtool eth0 | less
OR
$ ethtool eth0 | grep -i speed
Sample outputs:
Fig.01: Ubuntu Linux verify the speed of my NIC (network card)
- No ads and tracking
- In-depth guides for developers and sysadmins at Opensourceflare✨
- Join my Patreon to support independent content creators and start reading latest guides:
- How to set up Redis sentinel cluster on Ubuntu or Debian Linux
- How To Set Up SSH Keys With YubiKey as two-factor authentication (U2F/FIDO2)
- How to set up Mariadb Galera cluster on Ubuntu or Debian Linux
- A podman tutorial for beginners – part I (run Linux containers without Docker and in daemonless mode)
- How to protect Linux against rogue USB devices using USBGuard
Join Patreon ➔
🐧 Get the latest tutorials on Linux, Open Source & DevOps via
| Category | List of Unix and Linux commands |
|---|---|
| Documentation | help • mandb • man • pinfo |
| Disk space analyzers | df • duf • ncdu • pydf |
| File Management | cat • cp • less • mkdir • more • tree |
| Firewall | Alpine Awall • CentOS 8 • OpenSUSE • RHEL 8 • Ubuntu 16.04 • Ubuntu 18.04 • Ubuntu 20.04 |
| Linux Desktop Apps | Skype • Spotify • VLC 3 |
| Modern utilities | bat • exa |
| Network Utilities | NetHogs • dig • host • ip • nmap |
| OpenVPN | CentOS 7 • CentOS 8 • Debian 10 • Debian 8/9 • Ubuntu 18.04 • Ubuntu 20.04 |
| Package Manager | apk • apt |
| Processes Management | bg • chroot • cron • disown • fg • glances • gtop • jobs • killall • kill • pidof • pstree • pwdx • time • vtop |
| Searching | ag • grep • whereis • which |
| Shell builtins | compgen • echo • printf |
| Text processing | cut • rev |
| User Information | groups • id • lastcomm • last • lid/libuser-lid • logname • members • users • whoami • who • w |
| WireGuard VPN | Alpine • CentOS 8 • Debian 10 • Firewall • Ubuntu 20.04 |
Comments on this entry are closed.
Is there any similar functionality on Windows?
I want to see the Duplex and Speed on Windows as well.
yes you have to go to your Ethernet card properties which can me done through device manger and there select advance option and change the LAN link speed either to 10 or 100 Mbps full or half duplex
I’m using Ubuntu 8.10 alpha 3 32bits.
I tried “ethtool eth0 | grep -i speed ” but needed to add sudo to execute it.
Without sudo:
Cannot get device settings: Operation not permitted
Cannot get wake-on-lan settings: Operation not permitted
Cannot get link status: Operation not permitted
jp@jp-desktop810:
$ sudo ethtool eth0 | grep -i speed
Speed: 100Mb/s
Talk about difficult to find out what my nic link speed is with linux (fedora 8) …
I would have expected “settings/network or network status” to show me.
On windows just look at the properties/status of the network card object and it shows link speed, duplex and real time packet count.
On Windows, you type in a fairly long command to get it, instead of just “ethtool “, which is shorter. You’re comparing the graphical tools available on Windows to the command line of Linux. Apples and oranges.
Tried this on ubuntu, uhm, 8 or something (was some old usb livestick i often use to revive data from dead computers and laptops).
I had to install the ethtool first, but a permission denied. This command worked though:
sudo apt-get install ethtool
Then I tried the first command in this article, which gave me no info and I didn´t know howto get out of the program. Closed the terminal and opened it up again, then ran the second command. Permission denied. But a sudo !! did the trick. In short, this would work after doing the apt-get-install:
sudo ethtool eth0 | grep -i speed
Hope this helps others out who are just as newb as me 🙂
apt-get and ethtool are administrator tools hence the need to use sudo before the actual commands. Users are normally not able to use them as they can affect the system and possibly cause major failures in connectivty or software.
On amazon Linux on EC2, ethtool only says whether a link is detected or not.
ifconfig -a
cat /proc/net/bonding/bond0
cat /proc/net/bonding/bond1
If you don’t have ethtool installed, you may have mii-tool:
# mii-tool
eth0: negotiated 1000baseT-FD flow-control, link ok
eth1: negotiated 100baseTx-FD flow-control, link ok
Can any one tell me ,How to get Ethernet Link Speed(through command prompt i e Terminal ) in MAC OS X ?
Thank you
If your interface name is en6, enter:
ifconfig en6 | grep media
media: autoselect (100baseTX )
If your interface name is en0, enter:
ifconfig en0 | grep media
Источник
18 Commands to Monitor Network Bandwidth on Linux server
Network monitoring on Linux
This post mentions some linux command line tools that can be used to monitor the network usage.
These tools monitor the traffic flowing through network interfaces and measure the speed at which data is currently being transferred. Incoming and outgoing traffic is shown separately.
Some of the commands, show the bandwidth used by individual processes. This makes it easy to detect a process that is overusing network bandwidth.
The tools have different mechanisms of generating the traffic report.
Some of the tools like nload read the «/proc/net/dev» file to get traffic stats, whereas some tools use the pcap library to capture all packets and then calculate the total size to estimate the traffic load.
Here is a list of the commands, sorted by their features.
Now lets take a look at each of the commands and how to use them to monitor network usage:
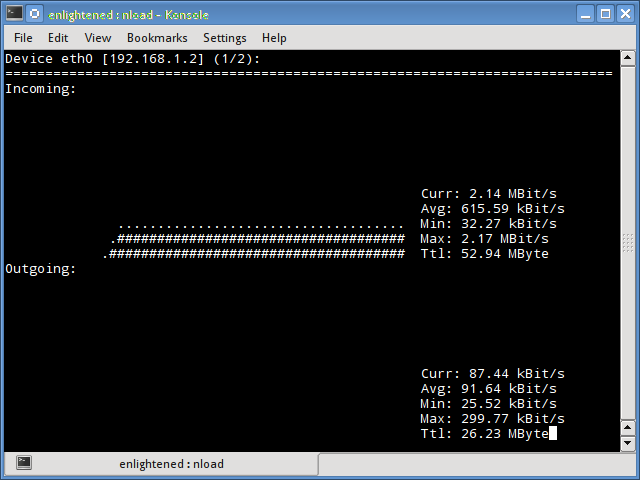
1. Nload
Nload is a commandline tool that allows users to monitor the incoming and outgoing traffic separately.
It also draws out a graph to indicate the same, the scale of which can be adjusted. Easy and simple to use, and does not support many options.
So if you just need to take a quick look at the total bandwidth usage without details of individual processes, then nload will be handy.
Installing Nload — Fedora and Ubuntu have got it in the default repos. CentOS users need to get nload from Epel repositories.
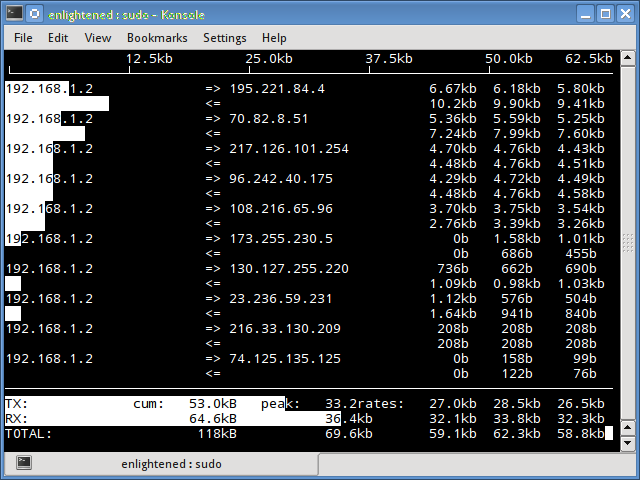
2. iftop
Iftop measures the data flowing through individual socket connections, and it works in a manner that is different from Nload.
Iftop uses the pcap library to capture the packets moving in and out of the network adapter, and then sums up the size and count to find the total bandwidth under use.
Although iftop reports the bandwidth used by individual connections, it cannot report the process name/id involved in the particular socket connection.
But being based on the pcap library, iftop is able to filter the traffic and report bandwidth usage over selected host connections as specified by the filter.
The n option prevents iftop from resolving ip addresses to hostname, which causes additional network traffic of its own.
Install iftop — Ubuntu/Debian/Fedora users get it from default repos. CentOS users get it from Epel.
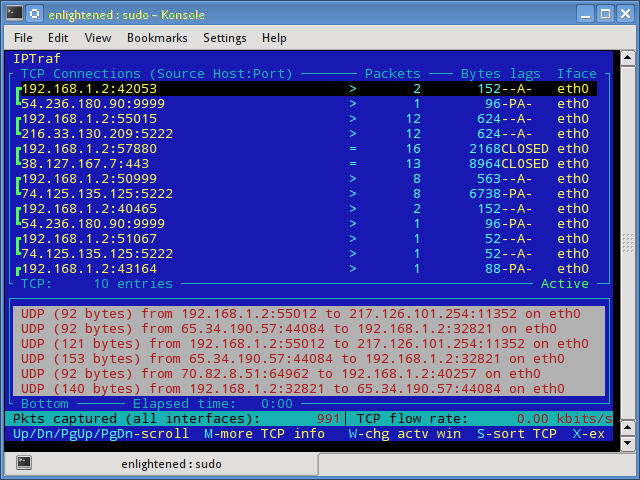
3. iptraf
Iptraf is an interactive and colorful IP Lan monitor. It shows individual connections and the amount of data flowing between the hosts. Here is a screenshot
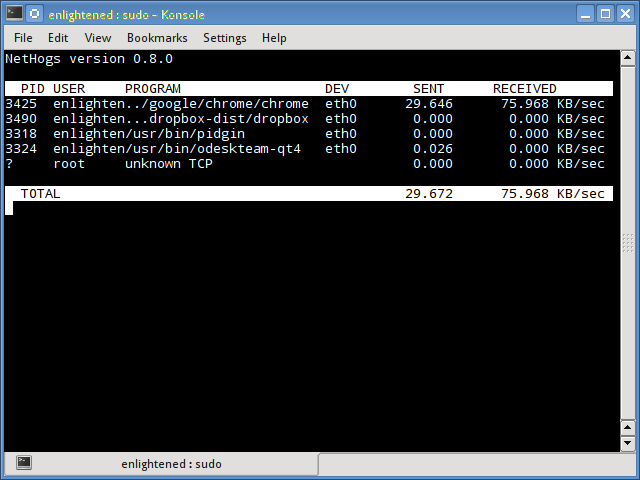
4. nethogs
Nethogs is a small ‘net top’ tool that shows the bandwidth used by individual processes and sorts the list putting the most intensive processes on top.
In the event of a sudden bandwidth spike, quickly open nethogs and find the process responsible. Nethogs reports the PID, user and the path of the program.
Install Nethogs — Ubuntu, Debian, Fedora users get from default repos. CentOS users need Epel
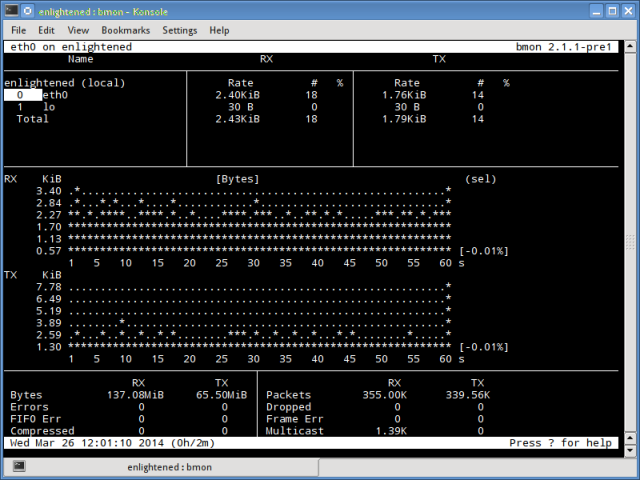
5. bmon
Bmon (Bandwidth Monitor) is a tool similar to nload that shows the traffic load over all the network interfaces on the system. The output also consists of a graph and a section with packet level details.
Install Bmon — Ubuntu, Debian and Fedora users can install from default repos. CentOS users need to setup repoforge, since its not available in Epel.
Bmon supports many options and is capable of producing reports in html format. Check the man page for more information
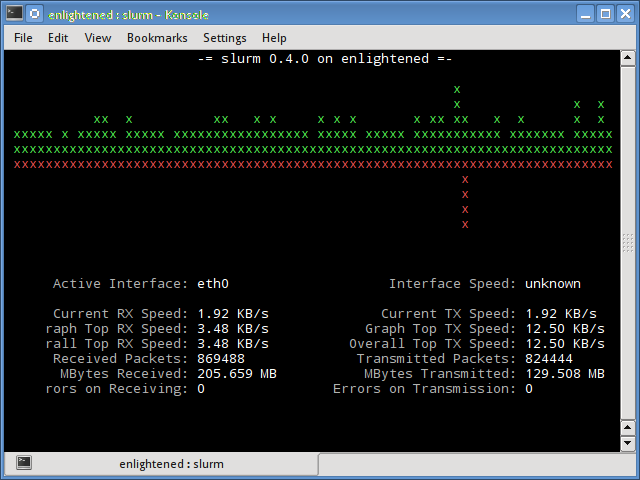
6. slurm
Slurm is ‘yet’ another network load monitor that shows device statistics along with an ascii graph. It supports 3 different styles of graphs each of which can be activated using the c, s and l keys. Simple in features, slurm does not display any further details about the network load.
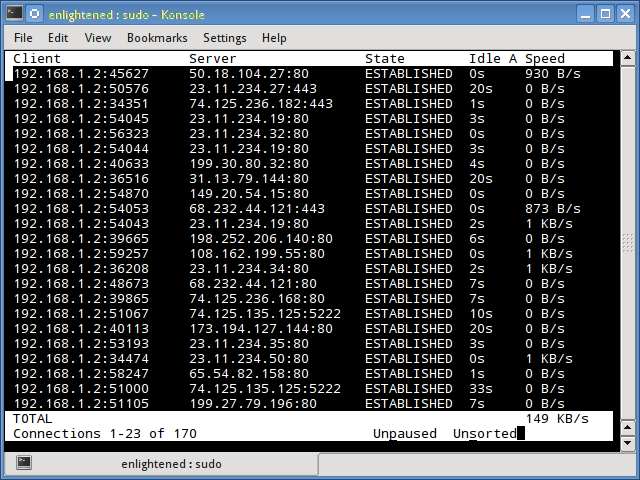
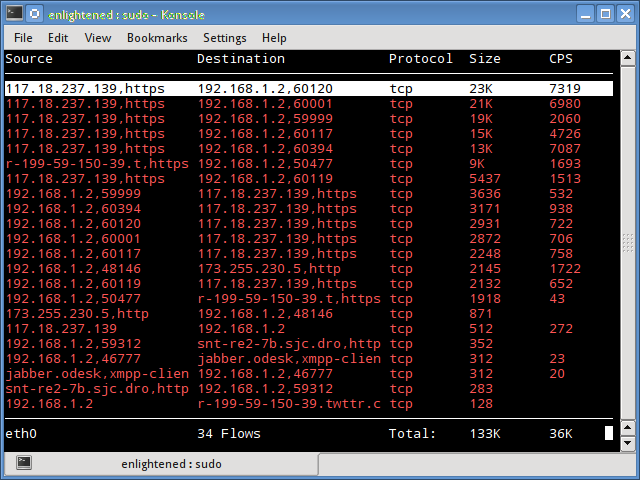
7. tcptrack
Tcptrack is similar to iftop, and uses the pcap library to capture packets and calculate various statistics like the bandwidth used in each connection.
It also supports the standard pcap filters that can be used to monitor specific connections.
Install tcptrack — Ubuntu, Debian and Fedora have it in default repos. CentOS users need to get it from RepoForge as it is not available in Epel either.
8. Vnstat
Vnstat is bit different from most of the other tools. It actually runs a background service/daemon and keeps recording the size of data transfer all the time.
Next it can be used to generate a report of the history of network usage.
Running vnstat without any options would simply show the total amount of data transfer that took place since the date the daemon is running.
To monitor the bandwidth usage in realtime, use the ‘-l’ option (live mode). It would then show the total bandwidth used by incoming and outgoing data, but in a very precise manner without any internal details about host connections or processes.
Vnstat is more like a tool to get historic reports of how much bandwidth is used everyday or over the past month. It is not strictly a tool for monitoring the network in real time.
Vnstat supports many options, details about which can be found in the man page.
9. bwm-ng
Bwm-ng (Bandwidth Monitor Next Generation) is another very simple real time network load monitor that reports a summary of the speed at which data is being transferred in and out of all available network interfaces on the system.
If the console size is sufficiently large, bwm-ng can also draw bar graphs for the traffic using the curses2 output mode.
Install Bwm-NG — On CentOS bwm-ng can be installed from Epel.
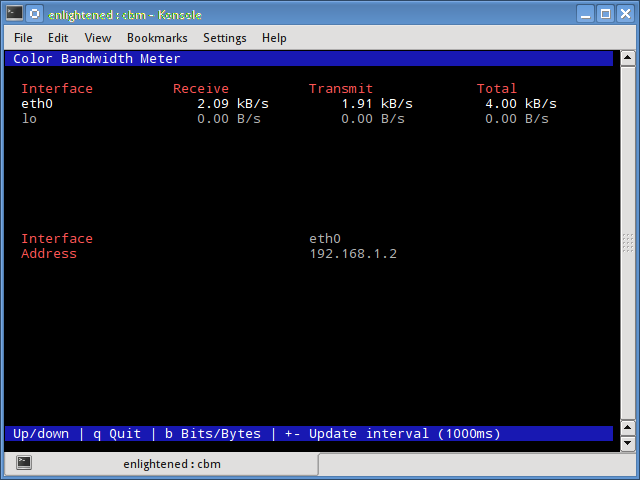
10. cbm — Color Bandwidth Meter
A tiny little simple bandwidth monitor that displays the traffic volume through network interfaces. No further options, just the traffic stats are display and updated in realtime.
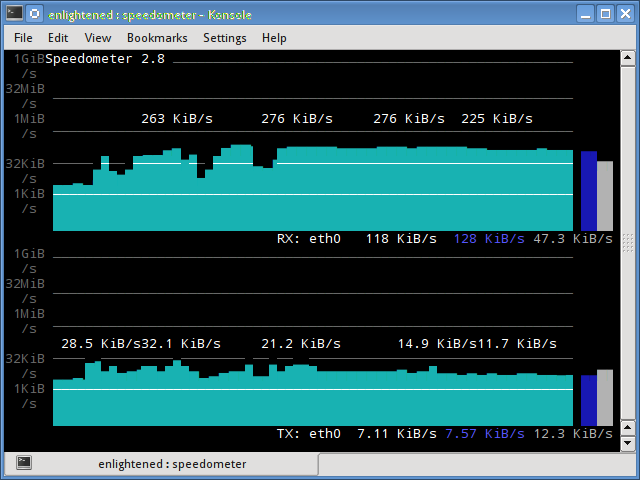
11. speedometer
Another small and simple tool that just draws out good looking graphs of incoming and outgoing traffic through a given interface.
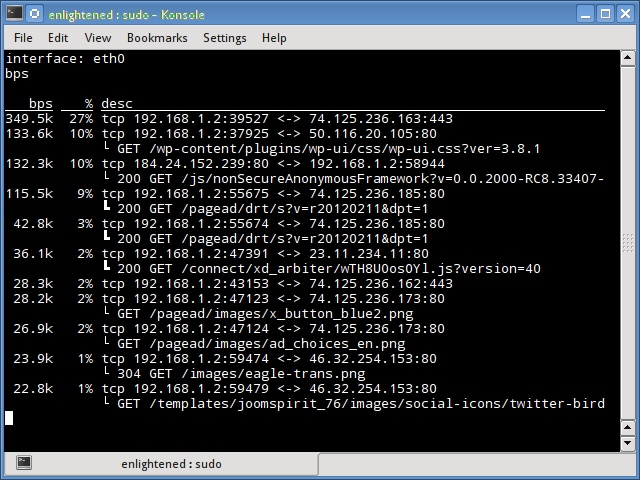
12. Pktstat
Pktstat displays all the active connections in real time, and the speed at which data is being transferred through them.
It also displays the type of the connection, i.e. tcp or udp and also details about http requests if involved.
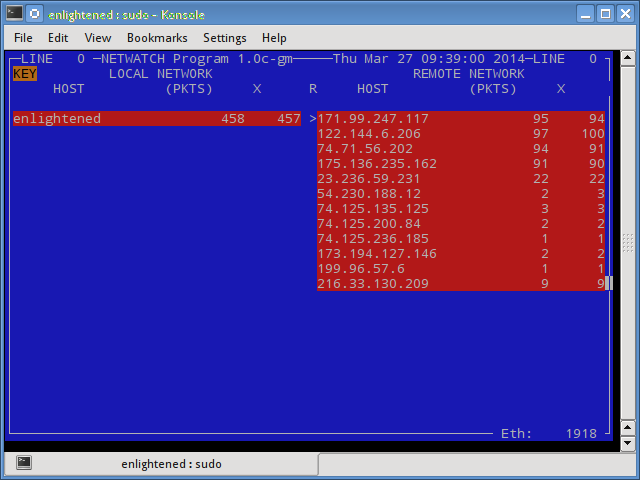
13. Netwatch
Netwatch is part of the netdiag collection of tools, and it too displays the connections between local host and other remote hosts, and the speed at which data is transferring on each connection.
14. Trafshow
Like netwatch and pktstat, trafshow reports the current active connections, their protocol and the data transfer speed on each connection. It can filter out connections using pcap type filters.
Monitor only tcp connections
15. Netload
The netload command just displays a small report on the current traffic load, and the total number of bytes transferred since the program start. No more features are there. Its part of the netdiag.
16. ifstat
The ifstat reports the network bandwidth in a batch style mode. The output is in a format that is easy to log and parse using other programs or utilities.
Install ifstat — Ubuntu, Debian and Fedora users have it in the default repos. CentOS users need to get it from Repoforge, since its not there in Epel.
17. dstat
Dstat is a versatile tool (written in python) that can monitor different system statistics and report them in a batch style mode or log the data to a csv or similar file. This example shows how to use dstat to report network bandwidth
18. collectl
Collectl reports system statistics in a style that is similar to dstat, and like dstat it is gathers statistics about various different system resources like cpu, memory, network etc.
Over here is a simple example of how to use it to report network usage/bandwidth.
Summary
Those were a few handy commands to quickly check the network bandwidth on your linux server. However these need the user to login to the remote server over ssh.
Alternatively web based monitoring tools can also be used for the same task.
Ntop and Darkstat are some of the basic web based network monitoring tools available for Linux.
Beyond these lie the enterprise level monitoring tools like Nagios that provide a host of features to not just monitor a server but entire infrastructure.
A Tech Enthusiast, Blogger, Linux Fan and a Software Developer. Writes about Computer hardware, Linux and Open Source software and coding in Python, Php and Javascript. He can be reached at [email protected] .
88 thoughts on “ 18 Commands to Monitor Network Bandwidth on Linux server ”
Amazing Article, Really useful information to all So, I hope you will share more information to be check and share here.thanks for sharing.
Thanks for sharing this amazing informative article. this is best for cs students mainly linux student to know about these commands.
Wow, so much loads of usefulness! Thank you for this! Lots of tools I never heard and surprise they are there by default on reposity, just apt install away!!
Based on nethogs, there’s a Qt software providing charts per application:
https://slist.lilotux.net/linux/nethogs-qt/index_en.html
thanks for mentioning.
Very informative and useful article. We can see all the commands at one shot.
Thanks for sharing
it is really a great article and helping to learn about Linux network.
Keep sharing such great knowledge
These are perfect 100% working commands. That is quite amazing. Thanks for such a useful article…
Great article.It’s a big collection for monitor, is any app can track daily bandwidth ?
Thanks! Nethogs is perfect for me as it shows usage per process: current bandwith and total used, great!
Thanks, it is saving a lot of time
Very informative and useful article.
Thanks for sharing
that was really useful
thanks
Thanks for sharing informative article I have been looking for these command with step by step guide you did a great job and i found a solution that I am looking for keep up the good work.
You are right.
Actually i was too looking about this commands.
At least i found these all here.
Thanks.
This commands its very helpful for me i want to i want to know how to create a server 2012 r2 in home
20+ year vet here. pure gold .. many of these are new to me.
excellent article
glad that you liked it.
thanks for the comment.
Very good and useful compilation.
Good job and thanks!!
Now an article about _graphical_ monitor network applications would be even better 🙂
This a gem for commands.
Thanks 🙂
Thank you for this article, I didn’t know about these tools.
Thank you, very good article, a treasure trove 🙂
In our company we are several clients which are connected to an Ubuntu Server. Sometimes there is problem in entire network of company and we have heavy load on server. We try to find which client causes this problem.
As part of solution should be monitored entire network 24 hour per day? And if yes, which network monitoring tool helps us to find bad client and how to log it to analyze later?
How can we get complete status of each client and its transaction with our server? For example, a client named A have connection with server, how can we see how many bandwidths is used by this client?
Use a proper router like opnsense. It can monitor per host traffic and even put quotas on certain hosts or otherwise profile them to use less bandwidth.
Thank you. We can see all the commands at one shot.
Great article. Thanks for all you have done here. Very good examples and a good read. Exceptionally useful information.
Источник


