Core dump
A core dump is a file containing a process’s address space (memory) when the process terminates unexpectedly. Core dumps may be produced on-demand (such as by a debugger), or automatically upon termination. Core dumps are triggered by the kernel in response to program crashes, and may be passed to a helper program (such as systemd-coredump) for further processing. A core dump is not typically used by an average user, but may be passed on to developers upon request where it can be invaluable as a post-mortem snapshot of the program’s state at the time of the crash, especially if the fault is hard to reliably reproduce.
Contents
Disabling automatic core dumps
Users may wish to disable automatic core dumps for a number of reasons:
- Performance: generating core dumps for memory-heavy processes can waste system resources and delay the cleanup of memory.
- Disk space: core dumps of memory-heavy processes may consume disk space equal to, if not greater, than the process’s memory footprint if not compressed.
- Security: core dumps, although typically readable only by root, may contain sensitive data (such as passwords or cryptographic keys), which are written to disk following a crash.
Using sysctl
sysctl can be used to set the kernel.core_pattern to nothing to disable core dump handling. Create this file[1]:
To apply the setting immediately, use sysctl :
Using systemd
systemd’s default behavior is defined in /usr/lib/sysctl.d/50-coredump.conf , which sets kernel.core_pattern to call systemd-coredump . It generates core dumps for all processes in /var/lib/systemd/coredump . systemd-coredump behavior can be overridden by creating a configuration snippet in the /etc/systemd/coredump.conf.d/ directory with the following content[2][3]:
Then reload systemd’s configuration.
This method alone is usually sufficient to disable userspace core dumps, so long as no other programs enable automatic core dumps on the system, but the coredump is still generated in memory and systemd-coredump run.
Using PAM limits
The maximum core dump size for users logged in via PAM is enforced by limits.conf. Setting it to zero disables core dumps entirely. [4]
Using ulimit
Command-line shells such as bash or zsh provide a builtin ulimit command which can be used to report or set resource limits of the shell and the processes started by the shell. See bash(1) § SHELL BUILTIN COMMANDS or zshbuiltins(1) for details.
To disable core dumps in the current shell:
Making a core dump
To generate a core dump of an arbitrary process, first install the gdb package. Then find the PID of the running process, for example with pgrep:
Attach to the process:
Then at the (gdb) prompt:
Now you have a coredump file called core.2071 .
Where do they go?
The kernel.core_pattern sysctl decides where automatic core dumps go. By default, core dumps are sent to systemd-coredump which can be configured in /etc/systemd/coredump.conf . By default, all core dumps are stored in /var/lib/systemd/coredump (due to Storage=external ) and they are compressed with zstd (due to Compress=yes ). Additionally, various size limits for the storage can be configured.
To retrieve a core dump from the journal, see coredumpctl(1) .
Examining a core dump
Use coredumpctl to find the corresponding dump:
You need to uniquely identify the relevant dump. This is possible by specifying a PID , name of the executable, path to the executable or a journalctl predicate (see coredumpctl(1) and journalctl(1) for details). To see details of the core dumps:
Pay attention to «Signal» row, that helps to identify crash cause. For deeper analysis you can examine the backtrace using gdb:
When gdb is started, use the bt command to print the backtrace:
See Debugging/Getting traces if debugging symbols are requested, but not found.
Источник
Dark Low Level

Explained in Low-mode
I’m not sure how you dump all the memory to a file without doing this repeatedly (if anyone knows an automated way to get gdb to do this please let me know), but the following works for any one batch of memory assuming you know the pid:
This will be in the format (example):
Pick one batch of memory (so for example 00621000-00622000) then use gdb as root to attach to the process and dump that memory:
Then analyse /root/output with the strings command, less you want the PuTTY all over your screen.
The following quick-and-dirty python script dumps the memory of a process to stdout. This has the side effect of loading any swapped out page or mapped file. Call it as cat_proc_mem 123 456 789 where the arguments are process IDs.
This script is completely specific to Linux. It may be adaptable to other systems with a similar /proc structure (Solaris?), but forget about running it on e.g. *BSD. Even on Linux, you may need to change the definition of c_pid_t and the values of PTRACE_ATTACH and PTRACE_DETACH. This is a proof-of-principle script, not meant as an example of good programming practices. Use at your own risk.
Linux makes the memory of a process available as /proc/$pid/mem. Only certain address ranges are readable. These ranges can be found by reading the memory mapping information from the text file /proc/$pid/maps. The pseudo-file /proc/$pid/mem cannot be read by all processes that have the permission to read it: the reader process must have called ptrace(PTRACE_ATTACH, $pid)
In this case, we are going to get dump information of a running apache. Append below code and execute.
Get the pid of your apache process.
Dump the process’s memory
grep all of the dump files for something that you expect to be in the apache config file.
open the matched dump file(s) in vim and search for the string.
Search by typing “/”, eg “/DocumentRoot”, then simply copy out the text that you want.
Источник
Linux dump process memory
What is this. thing?
This is a script which dumps as much allocated memory as possible from a running Linux system. The primary target is user data, which is arguably the most difficult thing to get from a Linux box these days that is relevant to a forensic investigation.
How does it work?
By parsing /proc/[pid]/maps and dumping the regions described in there from /proc/[pid]/mem.
Does it need root?
No! However, the success rate is significantly more limited when you run it as an unprivileged user. I still managed to pull quite a bit of information out running it under my normal unprivileged account.
For a forensics class, and generally because there’s a lack of memory dumping utilities for Linux these days since /dev/mem was deprecated.
My tool is not a replacement for /dev/mem. It dumps allocated memory from currently running user-space processes. The following are not dumped (this is not an exhaustive list):
- Unallocated pages
- Kernel threads
- I/O cache memory
- Files mapped with mmap()
- processes which restrict the use of ptrace(2)
It is also not a one-stop magical forensic report generator. If you think otherwise, consider a different career. Alongside the use of this tool you should be collecting lots more information from the system, the specifics of which are outside the scope of this document.
This script collects its list of PIDs at start-up, and then scans through each one. The process takes a while. By the time it makes it to a given process it may have died, and by the time it finishes new processes may have spawned. Since the goal of this script is to collect data from longer-running processes such as web browsers and editors, I don’t consider this a huge issue. Any competent forensic examiner uses this script alongside other techniques such as disk imaging anyway.
It’s slow as balls right now, I think because access to /proc is slow on my system, which is pretty up-to-date (kernel 3.8.4) probably because the kernel generates maps files and such on the fly.
It probably will not obtain dm-crypt encryption keys, as those are likely to be stored in the memory of kernel threads, but those can easily be obtained (if you have root) with «dmsetup table —showkeys».
Everything about this script is also based on virtual memory addresses, not physical. This will complicate the process of verifying results. Memory imaging in general is, in my opinion, very difficult to verify because RAM by its very nature is constantly changing, and it is impossible to image a box’s memory without changing it in some way. Thus, the ability of this tool’s output to stand up in court is questionable.
This tool is not intended to image every byte on the box, and is incapable of doing so. This applies in particular to free (unallocated) and I/O cache memory.
The good folks on /r/netsec have proposed compiling your kernel with CONFIG_GRKERNSEC_PROC, CONFIG_GRKERNSEC_PROC_MEMMAP, and CONFIG_GRKERNSEC_HARDEN_PTRACE.
I’ve written this utility in good faith. It’s open source, you can see exactly how it gathers its data, and you can go back to the Linux kernel docs or even the kernel source to examine its behavior. All this said, I cannot and will not be held liable for any inaccurate results returned by this tool, nor is any warranty provided (please see the license below).
Also, if you are a forensic examiner, please do not exclude the possibility that a smart enemy/target has modified their kernel to lie about memory regions or lie in /proc/[pid]/mem. It’s pretty easy to do.
The MIT License (MIT)
Copyright (c) 2013 Dan Fuhry (dan@fuhry.com)
Permission is hereby granted, free of charge, to any person obtaining a copy of this software and associated documentation files (the «Software»), to deal in the Software without restriction, including without limitation the rights to use, copy, modify, merge, publish, distribute, sublicense, and/or sell copies of the Software, and to permit persons to whom the Software is furnished to do so, subject to the following conditions:
The above copyright notice and this permission notice shall be included in all copies or substantial portions of the Software.
THE SOFTWARE IS PROVIDED «AS IS», WITHOUT WARRANTY OF ANY KIND, EXPRESS OR IMPLIED, INCLUDING BUT NOT LIMITED TO THE WARRANTIES OF MERCHANTABILITY, FITNESS FOR A PARTICULAR PURPOSE AND NONINFRINGEMENT. IN NO EVENT SHALL THE AUTHORS OR COPYRIGHT HOLDERS BE LIABLE FOR ANY CLAIM, DAMAGES OR OTHER LIABILITY, WHETHER IN AN ACTION OF CONTRACT, TORT OR OTHERWISE, ARISING FROM, OUT OF OR IN CONNECTION WITH THE SOFTWARE OR THE USE OR OTHER DEALINGS IN THE SOFTWARE.
About
Script that dumps running process memory from Linux systems using /proc.
Источник
Получаем образ оперативной памяти
Содержание оперативной памяти является очень важной информацией при изучении предыдущих действий с машиной. Оперативная память может содержать как части самих исполняемых процессов, так и части удаленных файлов, пользовательских сессий, криптографических ключей. При современном распространении сложных систем защиты информации, основанных на криптовании восстановление их ключей становиться чуть-ли не одной из основных задач для исследования. В защищенных системах зачастую оперативная память это единственное место где могут сохраниться защитные ключи и другая временная, но очень важная информация.
Процесс получения информации, которая содержится в оперативной памяти состоит из двух этапов: изъятие содержимого оперативной памяти
и
анализ полученных во время изъятия данных.
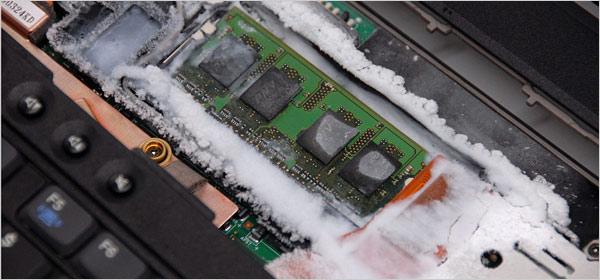
Обращая внимание на первый этап стоит заметить, что изъятие оперативной памяти может быть выполнено с помощью ряда средств: непосредственный доступ к памяти с использованием специальных плат расширения, порта FireWire, и даже физическом изъятии запоминающего устройства оперативной памяти (потребует замораживания плат),
но в данном материале мы рассмотрим программные средства, которые позволяют изъять содержимое оперативной памяти защищенных машин путем так называемой «горячей» перезагрузки и запуска машины в Live-режиме.
Для выполнения этой задачи будем использовать специальный дистрибутив Ubuntu CyberPack (IRF) 1.0, состоящий из минимального набора компонент, а именно, только те, которые необходимы для изъятия данных из памяти. Соответственно отсутствует и графический интерфейс.
Использование такого подхода к изъятию содержимого оперативной памяти имеет ряд преимуществ и недостатков сравнительно с другими перечисленными выше средствами.
Плюсы:
— использование Live-дистрибутива позволяет проводить действие не зависимо от того какая операционная система установлена на исследуемой машине;
— отсутствуют затраты на приобретение дорогостоящих специальных устройств, кабелей, плат, и др.
Недостаток:
— содержимое оперативной памяти будет неполным — ее часть будет перезаписана данными, необходимыми для запуска Live-дистрибутива (приблизительно 125 Мб).
Для использования доступны специально собранные дистрибутивы для машин с памятью объемом до 3 Гб (і386) и свыше 3 Гб (amd64). С их помощью можно создать загрузочный CD/DVD-диск или загрузочный USB-диск.
Замечания:
— второго шанса система нам не дает — у нас есть только одна попытка. т. е. при повторной перезагрузке исследуемого компьютера большая вероятность того что мы уже не найдем необходимой информации. Отсюда следует что не надо перезагружать его несколько раз, экспериментировать, прицеливаться.
Необходимо заранее подготовится и знать как компьютер себя поведет после перезагрузки.
Большинство современных компьютеров позволяют прямо при старте указать откуда производить загрузку, но если этого нет, тогда необходимого настроить BIOS машины на загрузку с CD/DVD-привода или USB-привода/накопителя, после чего загрузить Live-дистрибутив с указанного устройства.
Перезагружаем компьютер.
ВАЖНО: перезагрузка ни в коем случае не должна быть холодной (путем нажатия кнопки «ресет» или выключение\включение питания), а именно — перезагрузка должна быть осуществлена средствами самой работающей системы (например нажатием кнопок Ctrl-Alt-Del или путем выбора пункта «перезагрузка» в системе)
После загрузки дистрибутива пользователю доступна привычная строка консоли Linux, и краткая информация для запуска модуля. 
Подготовка к работе программы fmem заключается в выполнении следующих команд:
$ sudo -s
# cd /opt (переход в папку где находиться программа);
# ./run-fmem.sh (скрипт запуска модуля съема памяти);
Замечание: Для дальнейших действий понадобиться примонтировать заранее подготовленный носитель (внешний жесткий диск, флеш-накопитель) с файловой системой ext2/3/4, в который будет сохраняться файл с содержимым оперативной памяти.
Для того, что бы узнать какой идентификатор присоединенному носителю присвоила система, необходимо после его подключения к компьютеру ввести следующую команду:
# dmesg | tail (Команда выводит на экран информацию буфера сообщений ядра. Нас будет интересовать последняя запись.)
Как например вот это:
[16091.995428] sd 9:0:0:0: Attached scsi generic sg2 type 0
[16091.995996] sd 9:0:0:0: [sdb] 32096120 512-byte logical blocks: (16.4 GB/15.3 GiB)
[16091.998192] sd 9:0:0:0: [sdb] Write Protect is off
[16091.998205] sd 9:0:0:0: [sdb] Mode Sense: 0b 00 00 08
[16091.999433] sd 9:0:0:0: [sdb] No Caching mode page found
[16091.999447] sd 9:0:0:0: [sdb] Assuming drive cache: write through
[16092.003486] sd 9:0:0:0: [sdb] No Caching mode page found
[16092.003495] sd 9:0:0:0: [sdb] Assuming drive cache: write through
[16092.004251] sdb: sdb1
(где «sdb» — присвоенное обозначение физического накопителя, а «sdb1» — присвоенное обозначение логического раздела накопителя).
Далее следует примонтировать логический раздел накопителя к папке /tmp загруженной в Live-режиме операционной системы:
# mount /dev/sdb1 /tmp
(где
«mount» — команда монтирования устройства
«/dev/sdb1» — адрес файла логического раздела присоединенного накопителя
«/tmp» — папка в которую необходимо подключить накопитель).
Все подготовительные шаги сделаны — можно переходить к изъятию содержимого оперативной памяти:
# dd if=/dev/fmem of=/tmp/ram-image.mem bs=1K count=`head -1 /proc/meminfo | awk ‘
(где
«dd» — команда создания образа
«if=/dev/fmem» — источник данных, а именно оперативная память
«of=/tmp/ram-image.mem» — запись в файл «ram-image.mem» в папку «/tmp»
«bs=1K» — размер блока информации — 1 Кб
«count=`head -1 /proc/meminfo | awk ‘
И ждем…
В результате удачного выполнения команды, мы получим сообщение похожее на это:
521453568 bytes (521 MB) copied, 158.405 s, 3.3 MB/s
(где
«521453568 bytes (521 MB) copied» — объем скопированной информации
«158.405 s» — время в течении которого проводилась операция
«3.3 MB/s» — скорость при которой проводилась операция)
В результате мы получили содержимое оперативной памяти машины в файле «ram-image.mem» на накопителе. Теперь его можно обрабатывать в т.ч. извлекая части исполняемых процессов, удаленных файлов, информацию о пользовательских сессиях, криптографических ключах и многое другое.
P.S.
Также стоит обратить внимание что все современные системы используют в своей работе и swap-память (так называемый «файл подкачки»)
Файл подкачки – это своеобразное дополнение к оперативной памяти (которая занимается временным хранением данных для быстрой доставки их на обработку процессору) Вашего компьютера. Даже не столько дополнение, сколько её уширение или, можно сказать, продолжение. Дело в том, что когда не хватает оперативной памяти система может переносить данные из памяти на диск (так называемая дополнительная память), в котором соответственно также хранятся данные.
И для полной картины анализа памяти необходимо также получить и их.
Различные операционные системы используют разные способы их хранения.
В случае с Windows это обычно файлы в корне на системном диске С:
pagefile.sys для Win XP и Win 7 и достаточно просто скопировать файл
Для Linux — это отдельный раздел на носителе.
Например:
Команда sudo fdisk -l /dev/sda
покажет нам все разделы в системе
/dev/sda1 * 2048 78125055 39061504 83 Linux
/dev/sda2 78125056 117186559 19530752 82 Linux своп / Solaris
/dev/sda3 117186560 625141759 253977600 83 Linux
Исходя из чего мы видим что раздел подкачки находиться в /dev/sda2
Скопировать его можно также с помощию команды dd.
Например:
dd if=/dev/sda2 of=/media/ /linux-swap.dd
Для MacOS необходимо скопировать все файлы из директории /private/var/vm/swapfile*
Обработка и анализ полученных результатов (как дампа оперативной памяти так и swap-памяти) может проводиться как в ручную с помощью например HEX-редактора, так и с помощью ряда программ о которых будет рассказано в следующий раз.
Источник


