- Landoflinux
- Displaying system log files with journalctl
- What is journalctl?
- journalctl
- journalctl -r
- How to tail a log file
- Limiting the size of output
- Display events within a certain time
- Display events specific to a user
- Display events for a specific Unit
- Formatting the Output
- Display Boot information
- Display kernel messages
- Enabling persistent journals
- Beginner’s Guide to Analyzing Logs in Linux With journalctl Command
- What is journald? What is journalctl?
- Check if journal logs are enabled on your system
- Using journalctl commands
- Read and search through logs with journalctl
- Show logs in reverse chronological order
- Display only N recent lines of journal logs
- Show journal logs in real time
- Display logs in UTC time
- Show only kernel messages with -k
- Tip: Use sudo to see all journal logs
- Show messages from a particular boot session
- Filter journal logs for a specific systemd service
- Filter logs for a certain time interval
- Filter logs based on UID, GID and PID
- Tip: Combine more than one options for more tailored log viewing
- Using journalctl -xe for viewing last few logs
- Show only errors in logs with journalctl
- Check how much disk space logs are taking
- Enjoy log analyzing with journalctl command
Landoflinux
Displaying system log files with journalctl
What is journalctl?
From as early as 2012, many Linux distributions moved away from the traditional «System V» init system to a new system called «systemd«. Systemd is used for the booting of a system and managing of processes. Included within systemd is an ancillary component called «journalctl» whose prime purpose is to manage the event logging of a system. journalctl is a system utility that gives you the ability to query the contents of the systemd journal. journalctl is used to view your systems log files. By default, the command when used with no other parameters will display the full contents of your journal, starting with the oldest entry collected. All users by default are granted access to their own journals, however, access to the main system log files and other users log areas are restricted to privileged users («wheel» group and «systemd-journal» groups) and the root user. Because the system logs can be quite verbose and contain a lot of information, journalctl allows you to pass parameters that can limit the output to specific entries or time frames.
When the journalctl command is issued and executed with no additional parameters, the full journal is displayed. By default, the oldest entries are displayed first. The output is displayed a screen at a time, however, you may scroll through the output using the cursor keys (arrow keys) or by pressing the «space» bar to scroll a whole page at a time. By default, lines are truncated, however, you may use the arrow keys to scroll «left» and «right«.
Below are some examples of the journalctl command in use. The commands below were executed on a «CentOS» system and an «Ubuntu» system, however, the majority of Linux systems now have adopted «systemd» and this command may be executed.
journalctl
When passed with no additional parameters, all output is displayed with the oldest entries first.
Command Issued: journalctl
The above output is displayed with a header indicating the start of the journal entry. Where the lines have been truncated, you may use the arrow keys to scroll to the right to display the missing information.
journalctl -r
When the «journalctl» command is passed with the «-r» parameter. This instructs the system to display the output in reverse order. This means the latest output will be displayed first.
Command Issued: journalctl -r
The above journal entries are displayed with the newest entries first.
How to tail a log file
To tail a log file (read the latest entries) using journalctl, you simply pass the parameter «-f» after the command. By default, this will start displaying the most entries that are written to the main journal area.
Command Issued: journalctl -f
As and when new information is written to the journal, this information will be displayed to your screen.
Limiting the size of output
When displaying output, you may limit the number of lines that are displayed by passing either the «-n» or «—lines=» parameter.
Command Issued: journalctl -n 5
The above command displayed only the most recent journal entries and limited the number of lines displayed to the specified number passed.
Display events within a certain time
journalctl has the ability to allow you to showing entries on or newer than the specified date, or on or older than the specified date. These time frames are specified after the parameter «—since«. Dates have to be specified in the format «YYYY-MM-DD HH:MM:SS«. You may also pass a time frame as «1 hour ago«, or «3 days ago«.
Command Issued: journalctl —since 1 hour ago
The above command shows only output from the last hour. To see the exact times, look at the line that begins «— logs begin. «
Command Issued: journalctl —since «2016-08-04 20:00:00» —until «2016-08-04 20:15:00»
The above command will now only output information between the time frames specified.
Display events specific to a user
journalctl has the ability to filter the output by specifying a the «UID» of a particular user. A «UID» is a unique number that identifies a user on a system. To find out the id of a specific user, you can issue either the command «id» followed by the userid.
Command Issued: id john
From the above we can see that the UID for the user «john» is «1000«. We can now use this information to construct our next command.
Command Issued: journalctl _UID=1000 -n 5
Using journalctl we are able to show only the output for the user «john«. In this particular example, the additional parameter of «-n 5» was also used to limit the size of the output.
Display events for a specific Unit
journalctl has the ability also to display events for a particular Unit (service). For example, if you are running a web server (Apache), you may use the parameter «-u» to specify the unit you wish to see output for.
Command Issued: journalctl -u httpd.service
From the above we can see that the «Apache» web-server has been started, stopped and then restarted from the output. To just check on the status of a unit, you may use the command:
«systemctl status httpd.service«. This command will show whether the service is running, and the command «systemctl list-unit-files httpd.service» will show you whether the service is set to automatically start.
It is also possible to specify more than one unit for display.
Command Issued: journalctl -u httpd.service -u crond.service
From the above output you can see that both entries have now been included within the displayed output.
Formatting the Output
Various formatting options are available to the journalctl command. The option » -o» or «—output=» can be passed with one of the following formatting options. There are numerous formatting options available to the journalctl command. For a full list, please take a look at the man pages for «journalctl». Below are some examples of the journalctl formatting option being specified.
Command Issued: journalctl -o short
The above is an extract of the output from the journal. The «short» option is the default option when no formatting option is specified.
Command Issued: journalctl -o short-precise
The «short-precise» formatting option will show the same output, however, it will included a full time stamp with microseconds.
Command Issued: journalctl -o verbose
The above is only a small extract of the «verbose» formatting option. The «verbose» option will show full entries with all fields.
Display Boot information
The «-b» parameter may be passed to journalctl to display information relating to a specific system boot. Various parameters may be passed after the «-b» which allow you to specify a particular boot. For a list of boot numbers, you may issue the command «journalctl —list-boots«. This will show you a list of boot numbers that are relative to the current boot, their IDs and the timestamp of the first and last message of the boot.
Command Issued: journalctl —list-boots
From the above output, we can see that we only have one entry. The ID is displayed along with the relevant timestamp information.
To see ALL boot info, see the section enabling persistent journals.
Command Issued: journalctl -b
If no arguments are passed, the «journalctl -b» command will display information from the most recent boot.
Display kernel messages
The command «journalctl -k» or «journalctl —dmesg» may used to display only «kernel» messages.
Command Issued: journalctl —k
The above is an extract of the kernel messages from the journal.
Enabling persistent journals
By default the journalctl command retrieves its information from files held within memory or from a small ring buffer. To enable persistency, first you will need to create a directory where the journals will be stored. Once the directory is in place, you will then need to restart «journald«.
Command Issued: mkdir -p /var/log/journals
Once the above has been done, you will now have persistency. As an example I have rebooted my system and issued the «list—boots» option «journalctl —list-boots«. This time we can see previous boots as well as the most recent boot of our system.
Источник
Beginner’s Guide to Analyzing Logs in Linux With journalctl Command
systemd is the default on most of the major Linux distributions. One of the main features of systemd is the way it collects logs and the tools it gives for analyzing those logs.
In traditional SysVinit system, you have syslog that stores logs in plain text files. Reading and analyzing those files require the use of find, grep, cut and many other commands.
systemd collects logs from more sources than syslogs, keeps the journal logs in binary format and gives you a command line tool to read, analyze and manipulate the logs. This is more streamlined than the syslogs.
What is journald? What is journalctl?
journald is the daemon from systemd that collects the logs from various log sources like syslog.
journalctl is the command line tool that lets you interact with the journal logs.
With journalctl, you can read logs, monitor the logs in real time, filter the logs based on time, service, severity and other parameters.
In this tutorial, I’ll show you how to use journalctl to for reading, monitoring and analyzing the logs in Linux.
Check if journal logs are enabled on your system
Some Linux distributions, specially the desktop ones, don’t enable the journal logs by default.
The default location of journald logs is /var/log/journal directory. You should make sure that this directory exists. If not, create it yourself.
Next, in the /etc/systemd/journald.conf file make sure that the value Storage is set to either auto or persistent .
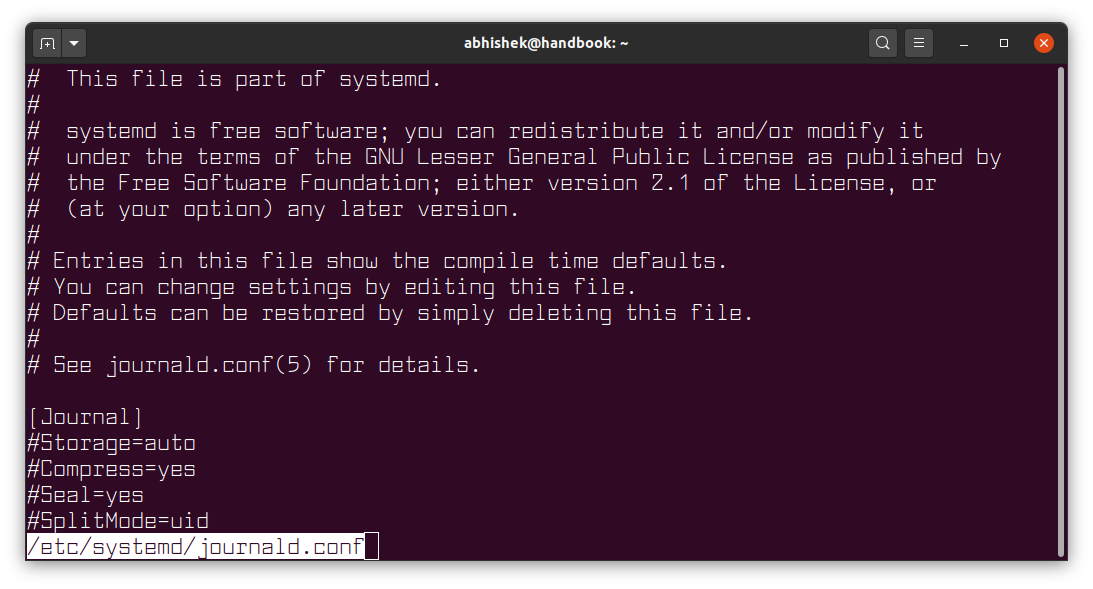
The journald.conf file shows the default values. So even if there is a # in front of the entries, it means those are the default settings being used. If you want to change anything, you remove the # from that line.

Using journalctl commands
Let me show you some of the most basic yet useful examples of journalctl command.
Read and search through logs with journalctl
If you just type journalctl in the terminal, it will show the journal logs in chronological order.
journalctl uses less underneath to show you the logs. Which means you can use the same keys to move around the logs as you do with the less command.
If you don’t remember that, here’s a quick recall:
| Key | Description |
|---|---|
| Arrow | Move by one line |
| Space | Move down one page |
| b | Move up one page |
| g | Go to the first line |
| G | Go to the last line |
| 100g | Go to the 100th line |
| /string | Search for the string from current position |
| n/N | Go to the next or previous search match |
| q | Exit the logs |
If you don’t want the logs to be displayed in less-like viewing mode, you can use the —no-pager flag. This will display entire logs directly on the screen.
This is not very useful and it will flood your screen if you have a huge amount of logs.
Show logs in reverse chronological order
As you noticed, the logs are shown in chronological order. This means the oldest stored logs are displayed first.
If you want to see the recent logs first, you can display the journal logs in reverse order with the option -r :
It still uses a less command like view. So, press q to exit the log viewing mode.
Display only N recent lines of journal logs
Instead of showing all logs, you can choose to display only a certain number of lines from log using the -n option.
For example, the command below will display most recent 25 lines of the logs:
Show journal logs in real time
Viewing recent logs is one thing, if you want to see the logs in real time, you can use the -f option of journalctl command:
Like the -f option of the tail command, this will display the logs in real time in the follow mode.
Use Ctrl+C command to exit the real time view.
Display logs in UTC time
By default, the journal logs are shown in the local time of your system. If your system’s time is set to a time other than UTC and you want to see the logs in UTC, you can do that using the —utc flag.
Show only kernel messages with -k
The systemd journal accumulates logs from different sources. If you just want to see Linux kernel logs, you can use the option -k .
Tip: Use sudo to see all journal logs
Systemd is protective about what kind of logs to show to which user.
It may show some logs but not all the logs if you are a regular user:
If you want access to all the logs, you should use sudo if you are a sudo user:
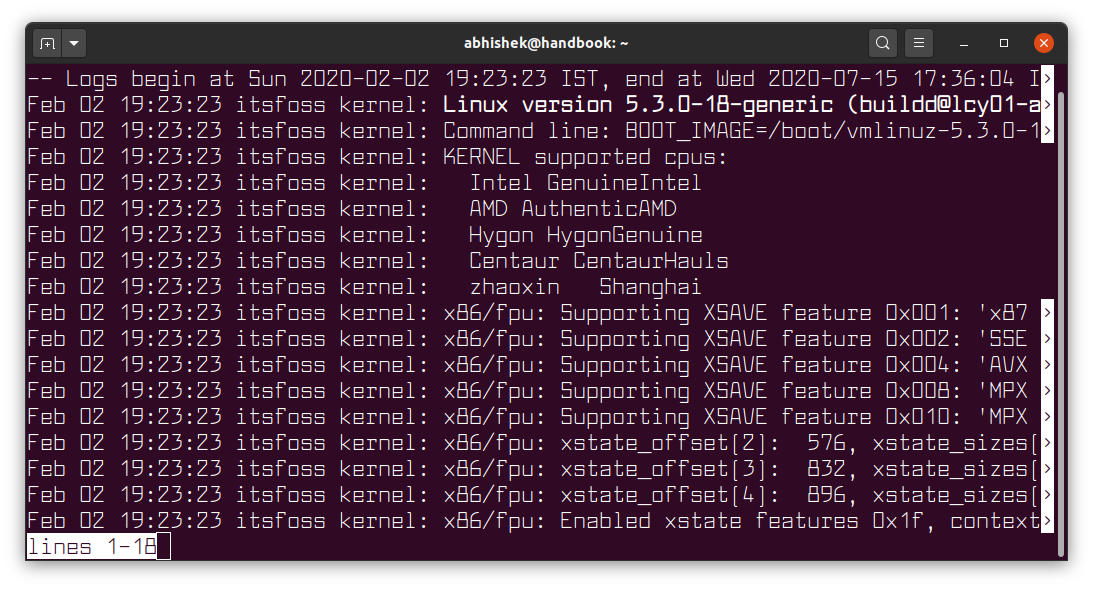
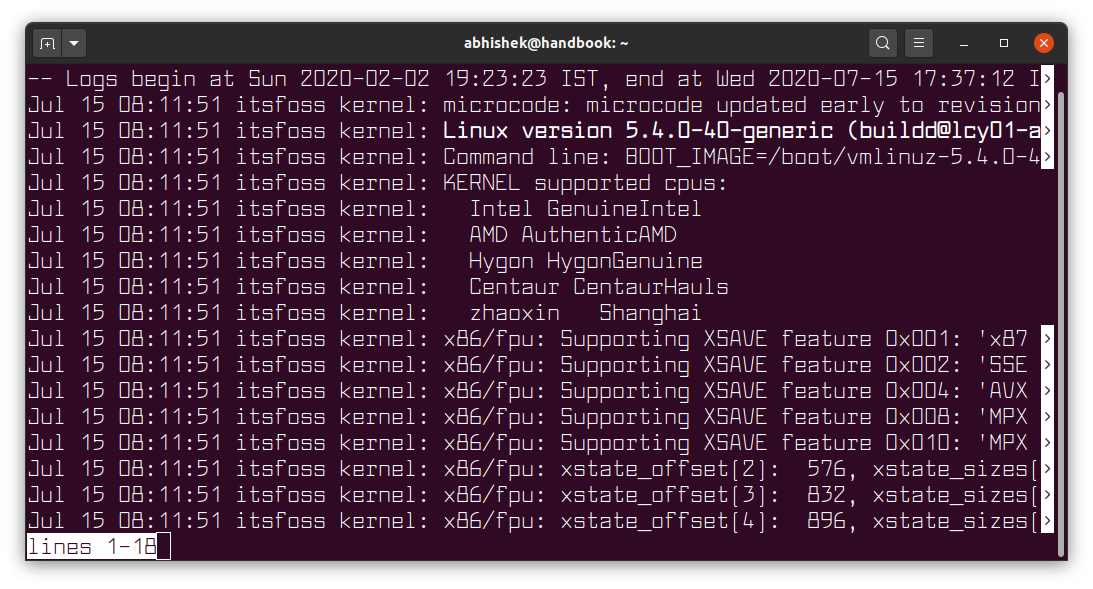
Show messages from a particular boot session
This is an excellent feature of jounrald. The journalctl command allows you to access logs belonging to a specific boot session using the option -b .
You can list all the boot sessions with —list-boots flag.
The output will show the boot sessions with the boot time and an integer assigned to the boot sessions:
Boot session 0 is the current boot sessions. Boot session -1 is the last booted session and so on.
Imagine trying to do this in the old syslog system!
You cannot only get the boot logs like what you see in /var/log/boot.log . However, the boot logs are always at the beginning of logs if you are in the boot session view.
Filter journal logs for a specific systemd service
Filtering is a strong point of journal logs. You can filter logs based on the systemd services.
For example, if you want to see logs generated by SSH, you can use it like this:
You’ll need to know the systemd service name of course.
Filter logs for a certain time interval
This is another example of the string filtering capability of the journal logs. You can filter logs for a certain time period and there are various ways to do that.
You may use natural language to filter the logs. Terms like yesterday, today and tomorrow are recognized.
You can also specify date or date time combination:
You can also specify a time period with the dates and time:
Time starts at 00:00:00 and it determines the day and date.
You can also use relative time like -1h20min to specify 1 hour 20 minutes in the past.
Filter logs based on UID, GID and PID
If you are debugging an issue, you may want to check the logs for a certain process using its PID.
The journal logs can also be filtered on User ID (UID), Group ID (GID) and Process ID (PID). Below is an example:
Tip: Combine more than one options for more tailored log viewing
You can combine several options to view the desired logs.
For example, if you want to see only SSH logs from yesterday in UTC timestamps, you can use:
Another common usage is to filter logs based on boot sessions. If you want to see only the SSH logs in the current session, you can use:
Possibilities are endless and you can combine the options based on your need.
Using journalctl -xe for viewing last few logs
You’ll often find people suggesting to use journalctl -xe command.
- -e : Jump to the end of the journal logs
- -x : Show extra information on the log entries (if available)
Some log entries have additional information that are not displayed in the normal log viewing. Using the -x option may display such information.
What you see as a single line like this:
It could display more information like this:
The additional info helps explain the context of an error or log event and the possible solutions.
Show only errors in logs with journalctl
To show all the errors in the current session, you can use:
- -p 3 : filter logs for priority 3 (which is error)
- -x : provides additional information on the log (if available)
- b : since last boot (which is the current session)
You can also use other priority level to get debug, or warning or even critical level logs. This table lists all the priority levels.
| Priority | Code |
|---|---|
| 0 | emerg |
| 1 | alert |
| 2 | crit |
| 3 | err |
| 4 | warning |
| 5 | notice |
| 6 | info |
| 7 | debug |
You can also display logs for a range of severity. For example, if you want to see all the warning, notice and info logs from the current session, you can use:
You could have also used warning..info in the above command instead of 4..6 .
Check how much disk space logs are taking
The journald collects logs from various sources and it stores logs of various levels including debug logs. Trust me, while retaining logs help in analyzing and auditing, they can take considerable amount of disk space.
You can check how much disk space the journal logs are taking with this journalctl command:
You might get a surprise (or a shock) when you see the output:
2.8 GB? That’s a lot. You may want to clear the journal logs.
![]()
Enjoy log analyzing with journalctl command
There are many more options and usage of the journalctl command and I cannot possibly cover them all. I recommend reading its manpage if you want more details on it.
I believe that I have given you enough to use journalctl command for regular log analysis. I hope you like this detailed tutorial on journald.
If you have suggestions or questions, don’t hesitate to leave a comment.
Источник


