- Мониторинг сети Linux
- Мониторинг сети Linux
- Nload
- iftop
- iptraf
- Nethogs
- Slurm
- Tcptrack
- Vnstat
- bwm-ng
- speedometer
- Pktstat
- Netwatch
- Trafshow
- Netload
- ifstat
- dstat
- collectl
- Выводы
- 18 Commands to Monitor Network Bandwidth on Linux server
- Network monitoring on Linux
- 1. Nload
- 2. iftop
- 3. iptraf
- 4. nethogs
- 5. bmon
- 6. slurm
- 7. tcptrack
- 8. Vnstat
- 9. bwm-ng
- 10. cbm — Color Bandwidth Meter
- 11. speedometer
- 12. Pktstat
- 13. Netwatch
- 14. Trafshow
- 15. Netload
- 16. ifstat
- 17. dstat
- 18. collectl
- Summary
- 88 thoughts on “ 18 Commands to Monitor Network Bandwidth on Linux server ”
Мониторинг сети Linux
В этой статье мы поговорим про некоторые инструменты командной строки Linux, которые можно использовать для мониторинга использования сети. Мониторинг сети Linux осуществляется множеством способов. Эти инструменты контролируют трафик, проходящий через сетевые интерфейсы, и измеряют скорость, с которой в настоящее время передаются данные. Входящий и исходящий трафик отображается отдельно.
В некоторых командах показана пропускная способность, используемая отдельными процессами. Это упрощает обнаружение процесса, который перегружает пропускную способность сети.
Инструменты имеют разные механизмы формирования отчета о трафике. Некоторые из инструментов, таких как nload, читают файл «/ proc / net / dev» для получения статистики трафика, тогда как некоторые инструменты используют библиотеку pcap для захвата всех пакетов, а затем вычисляют общий размер для оценки нагрузки трафика.
Мониторинг сети Linux
Ниже приведен список команд, отсортированных по их функциям.
- Общая пропускная способность — nload, bmon, slurm, bwm-ng, cbm, спидометр, netload
- Общая пропускная способность (выход пакетного стиля) — vnstat, ifstat, dstat, collectl
- Ширина полосы пропускания для каждого сокета — iftop, iptraf, tcptrack, pktstat, netwatch, trafshow
- Пропускная способность для каждого процесса — nethogs
Nload
Nload — это инструмент командной строки, который позволяет пользователям контролировать входящий и исходящий трафик отдельно. Он также выводит график, указывающий то же самое, масштаб которого можно отрегулировать. Прост в использовании и не поддерживает множество опций.
Поэтому, если вам просто нужно быстро взглянуть на использование общей пропускной способности без подробностей отдельных процессов, то достаточно будет ввести nload в терминал.
Чтобы выйти мониторинга сети, достаточно нажать клавишу Q

Установить nload в Debian или Ubuntu можно из репозиториев по-умолчанию:
Пользователи CentOS или Fedora могут установить nload командой:
Если в CentOS при установке возникли проблемы, то скорее всего вам нужно подключить epel
А затем ввести команду установки nload заново.
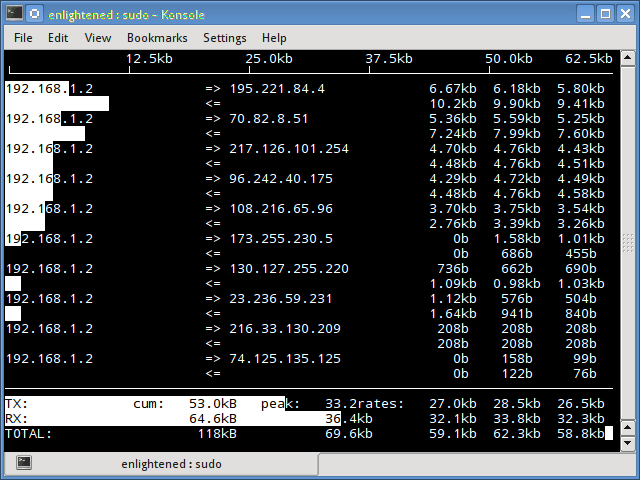
iftop
Мониторинг сети Linux является довольно легким в освоении. Для этого существует огромное количество вариантов. Вы можете выбрать самый удобный для вас. Iftop измеряет данные, проходящие через отдельные соединения сокетов, и работает таким образом, который отличается от Nload. Iftop использует библиотеку pcap для захвата пакетов, перемещающихся в и из сетевого адаптера, а затем суммирует размер и количество, чтобы найти общую используемую ширину полосы пропускания.
Несмотря на то, что iftop сообщает пропускную способность, используемую отдельными соединениями, он не может сообщить имя / идентификатор процесса, участвующего в конкретном подключении сокета. Но, основываясь на библиотеке pcap, iftop может фильтровать трафик и использовать пропускную способность для передачи по выбранным узловым соединениям, как это определено фильтром.
Опция n не позволяет iptop отыскивать IP-адреса на имя хоста, что вызывает дополнительный сетевой трафик.
Установить iftop в Debian или Ubuntu можно из репозиториев по-умолчанию.
Пользователи CentOS или Fedora могут установить iftop командой:
Если в CentOS при установке возникли проблемы, то скорее всего вам нужно подключить Epel
А затем ввести команду установки iftop заново.
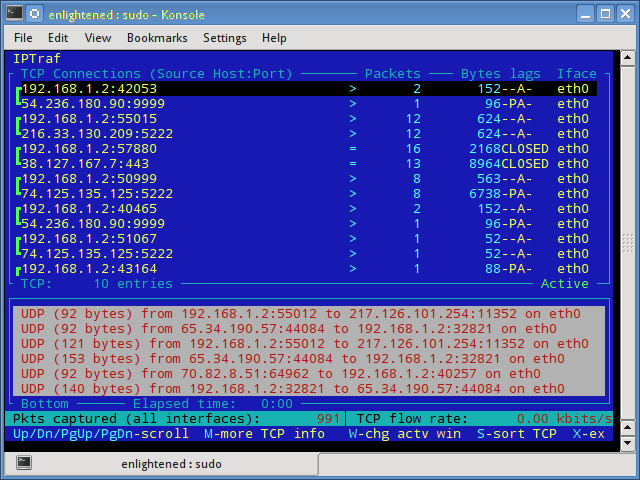
iptraf
Iptraf — это интерактивный и красочный монитор IP Lan. Он показывает индивидуальные соединения и объем данных, передаваемых между хостами. Вот скриншот
Установка iptraf в Ubuntu или Debian:
Установка iptraf в CentOS или Fedora
Если в CentOS при установке возникли проблемы, то скорее всего вам нужно подключить epel
А затем ввести команду установки iptraf заново.
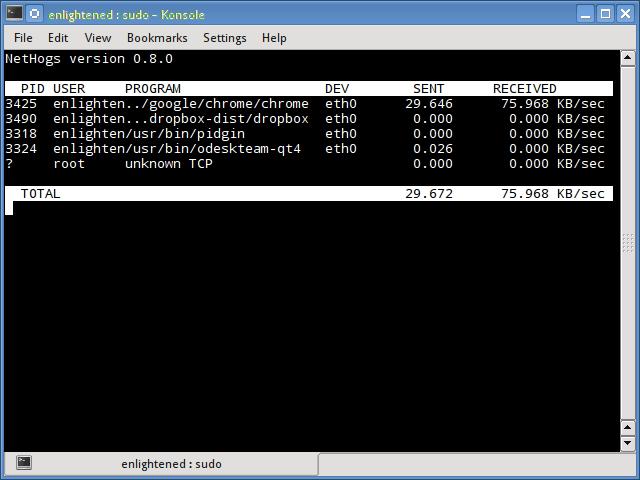
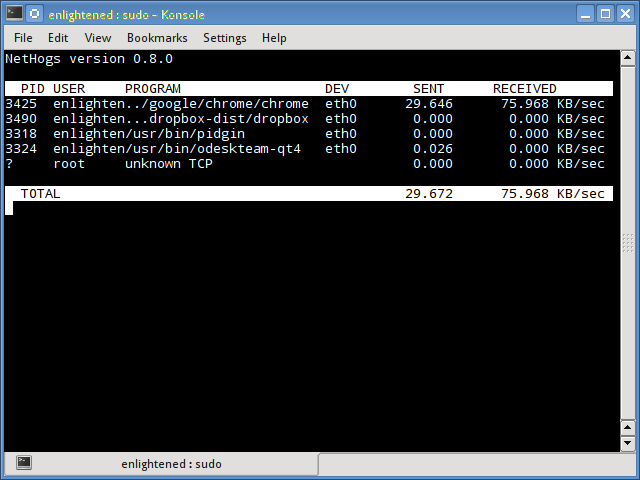
Nethogs
Nethogs — это небольшой инструмент «net top», который показывает пропускную способность, используемую отдельными процессами, и сортирует список, в котором самые интенсивные процессы находятся сверху. В случае внезапного скачка полосы пропускания быстро открывайте nethogs и найдите ответственный за процесс. Nethogs сообщает PID, пользователя и путь программы.
Установка nethogs в Ubuntu или Debian:
Установка nethogs в CentOS или Fedora
Если в CentOS при установке возникли проблемы, то скорее всего вам нужно подключить epel
А затем ввести команду установки nethogs заново.
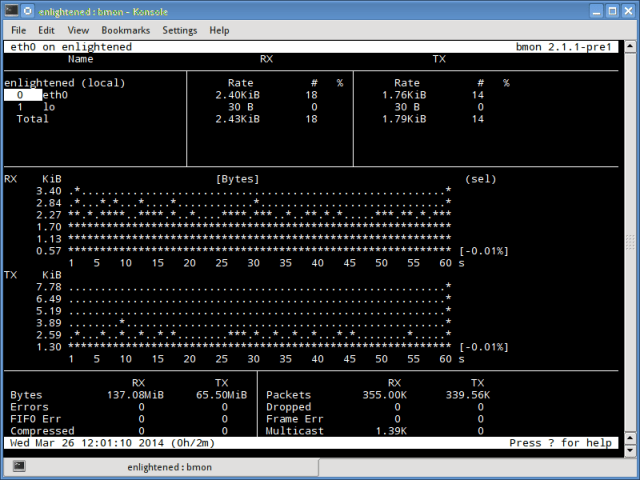
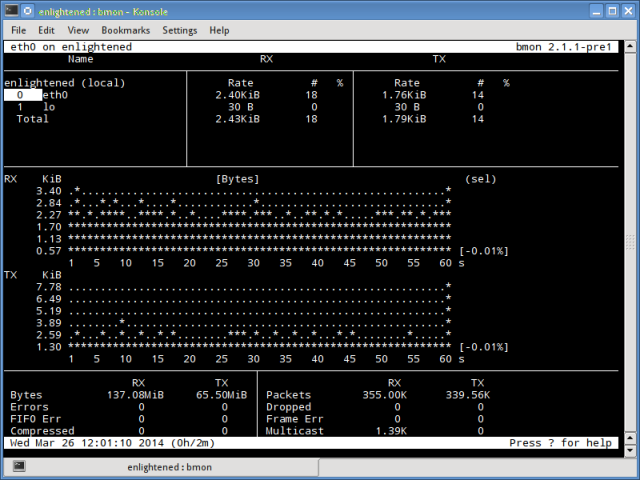
Bmon (Bandwidth Monitor) — это инструмент, аналогичный nload, который показывает нагрузку на трафик по всем сетевым интерфейсам в системе. Вывод также состоит из графика и раздела с деталями уровня пакета. Bmon поддерживает множество опций и способен создавать отчеты в формате html.
Монитор сети bmon linux
Установка bmon в Ubuntu или Debian:
Установка bmon в Fedora
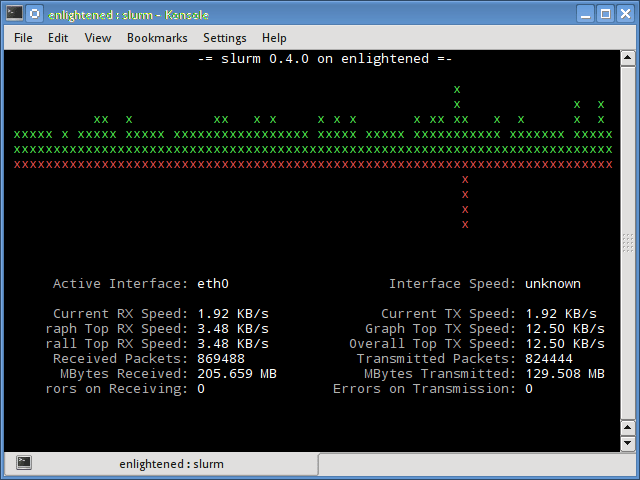
Slurm
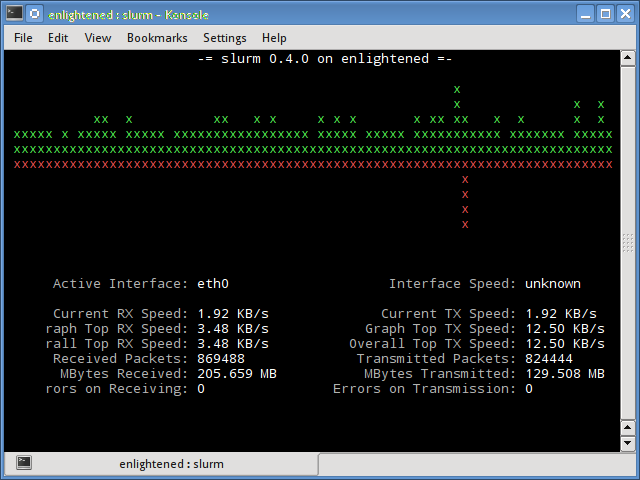
Slurm является еще одним монитором сетевой нагрузки, который показывает статистику устройства вместе с графиком ascii. Он поддерживает 3 разных стиля графиков, каждый из которых может быть активирован с помощью клавиш c, s и l. Простой в функциях, slurm не отображает никаких дополнительных сведений о сетевой нагрузке.
Установить slurm в Debian или Ubuntu
Установить slurm в Fedora или CentOS
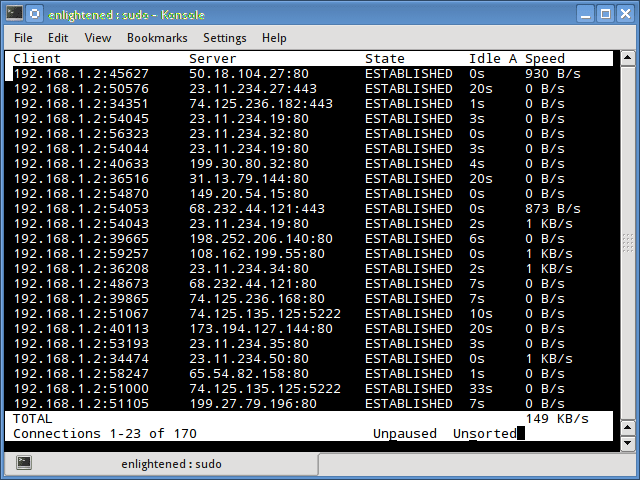
Tcptrack
Tcptrack похож на iftop и использует библиотеку pcap для захвата пакетов и вычисления различной статистики, такой как пропускная способность, используемая в каждом соединении. Он также поддерживает стандартные фильтры pcap, которые можно использовать для контроля определенных соединений.
Установка tcptrack в Ubuntu или Debian:
Установка tcptrack в Fedora
Vnstat
Vnstat немного отличается от большинства других инструментов где Мониторинг сети Linux является основой. На самом деле он запускает фоновый сервис / daemon и постоянно фиксирует размер передачи данных. Кроме того, его можно использовать для создания отчета об истории использования сети.
Запуск vnstat без каких-либо параметров просто покажет общий объем передачи данных, который произошел с момента запуска демона.
Чтобы отслеживать использование полосы пропускания в реальном времени, используйте параметр «-l» (режим «вживую»). Затем она покажет общую пропускную способность, используемую входящими и исходящими данными, но очень точным образом, без каких-либо внутренних сведений о хостах или процессах.
Vnstat больше походит на инструмент для получения исторических отчетов о том, как много трафика используется каждый день или в течение последнего месяца. Это не строго инструмент для мониторинга сети в реальном времени.
Vnstat поддерживает множество опций, подробности о которых можно найти на странице руководства.
Установить vnstat в Debian или Ubuntu
Установить vnstat в Fedora или CentOS
Если в CentOS при установке возникли проблемы, то скорее всего вам нужно подключить epel
А затем ввести команду установки vnstat заново.
bwm-ng
Bwm-ng (Bandwidth Monitor Next Generation) является еще одним очень простым монитором сетевой нагрузки в режиме реального времени, который сообщает сводную информацию о скорости передачи данных и из всех доступных сетевых интерфейсов в системе.
Если размер консоли достаточно велик, bwm-ng также может отображать гистограммы для трафика, используя режим вывода curses2.
Установка bwm-ng в Ubuntu или Debian
Установка bwm-ng в Fedora или CentOS
Если в CentOS при установке возникли проблемы, то скорее всего вам нужно подключить epel
А затем ввести команду установки bwm-ng заново.
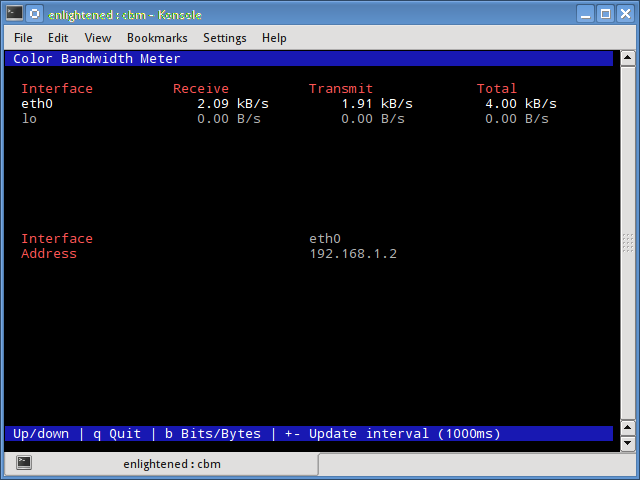
Небольшой простой монитор пропускной способности, отображающий объем трафика через сетевые интерфейсы. Нет дополнительных параметров, просто статистика трафика отображается и обновляется в реальном времени.

Установка cbm в Ubuntu или Debian
Установка cbm в Fedora или CentOS
Если в CentOS при установке возникли проблемы, то скорее всего вам нужно подключить epel
А затем ввести команду установки cbm заново.
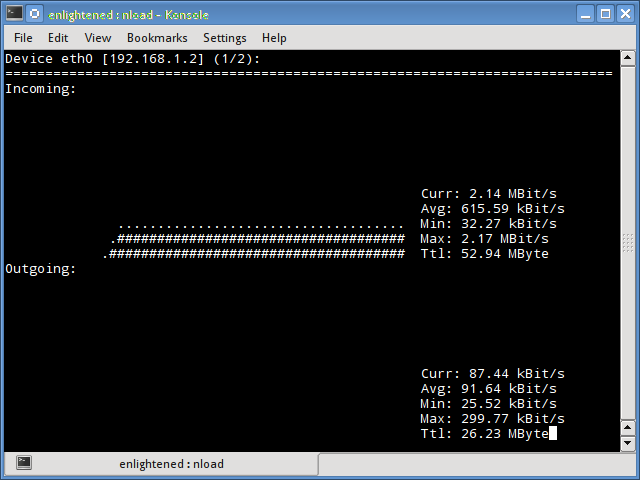
speedometer
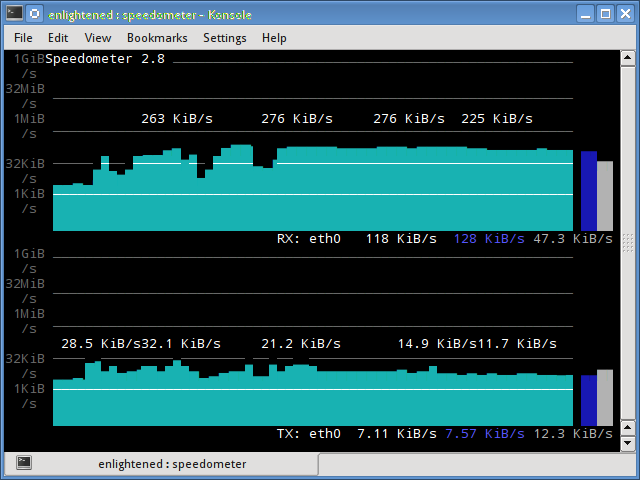
Еще один маленький и простой инструмент, который мы должны были добавить в статью про Мониторинг сети Linux, который просто рисует красиво выглядящие графики входящего и исходящего трафика через данный интерфейс.

Установка speedometer в Ubuntu или Debian
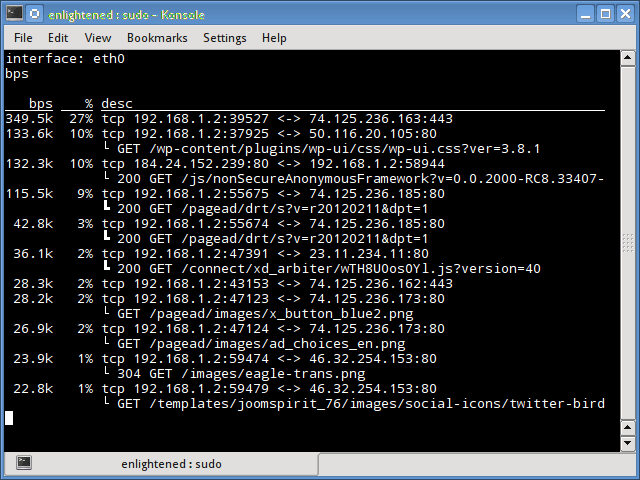
Pktstat
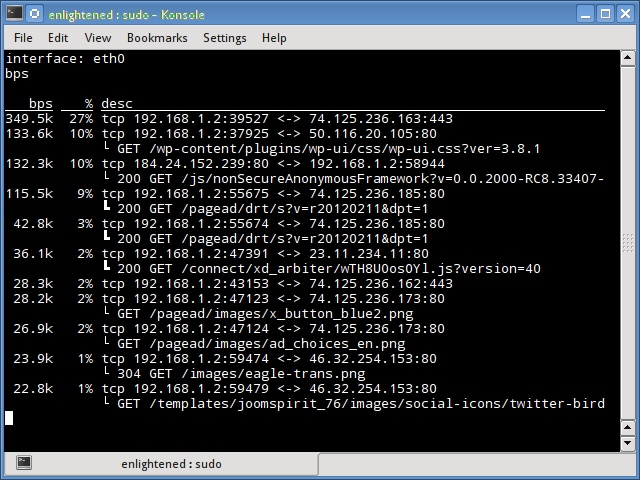
Pktstat отображает все активные соединения в реальном времени и скорость, с которой данные передаются через них. Он также отображает тип соединения, т. Е. Tcp или udp, а также информацию о HTTP-запросах, если они задействованы.
Установка speedometer в Ubuntu или Debian
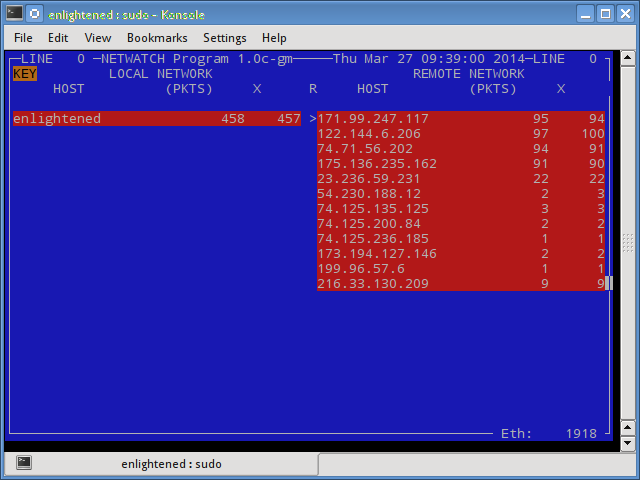
Netwatch
Netwatch является частью коллекции инструментов netdiag, и она также отображает соединения между локальным хостом и другими удаленными узлами и скорость передачи данных по каждому соединению.

Установка netwatch в Ubuntu или Debian (является частью netdiag)
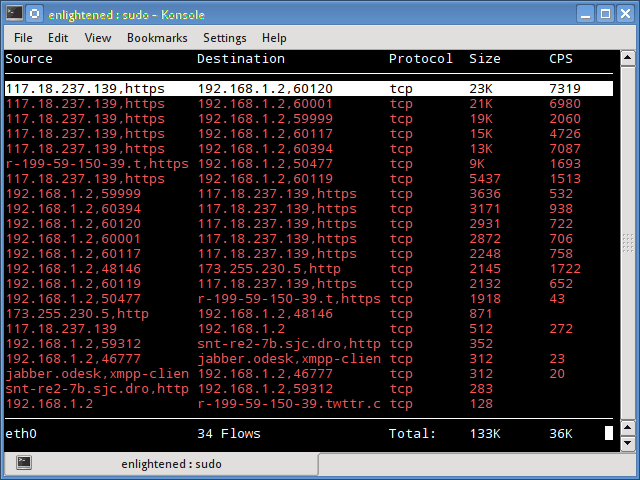
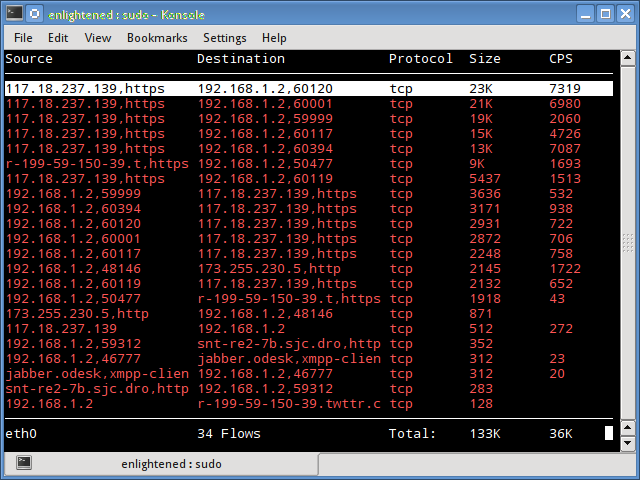
Trafshow
Как и netwatch и pktstat, trafshow сообщает о текущих активных соединениях, их протоколе и скорости передачи данных в каждом соединении. Он может отфильтровывать соединения, используя фильтры типа pcap.
Кстати, если говорить про Мониторинг сети Linux то здесь можно отметить также и этот способ. Trafshow является таким же удобным как и его аналоги.
Мониторинг только соединений TCP
Установка trafshow в Ubuntu или Debian (является частью netdiag)
Установка trafshow в Fedora или Centos
Если в CentOS при установке возникли проблемы, то скорее всего вам нужно подключить epel
А затем ввести команду установки trafshow заново.
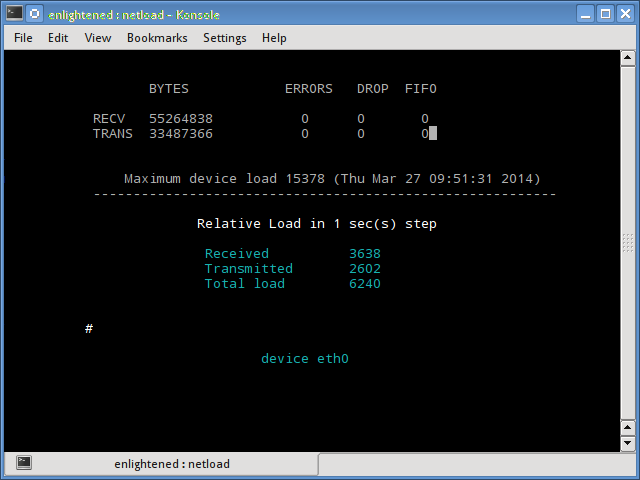
Netload
Команда netload просто отображает небольшой отчет о текущей нагрузке на трафик и общее количество байтов, переданных с момента запуска программы. Нет больше функций. Его часть netdiag.

Установка netload в Ubuntu или Debian (является частью netdiag)
ifstat
Ifstat сообщает о пропускной способности сети в режиме пакетного стиля. Выходной файл находится в формате, который легко регистрируется и анализируется с помощью других программ или утилит.
Установка ifstat в Ubuntu или Debian
Установка ifstat в Fedora
Установка ifstat в CentOS. Необходимо сначала подключить RepoForge. Инструкцию можно увидеть здесь. Затем ввести:
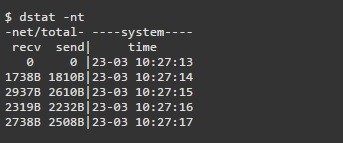
dstat
Dstat — это универсальный инструмент (написанный на python), который может отслеживать различные системные статистики и сообщать о них в режиме пакетного стиля или записывать данные в файл csv или аналогичный файл. В этом примере показано, как использовать dstat для передачи информации о пропускной способности сети
Установка dstat в Ubuntu или Debian
collectl
Collectl сообщает системную статистику в стиле, подобном dstat, и, подобно dstat, собирает статистику о различных различных системных ресурсах, таких как процессор, память, сеть и т. Д. Ниже приведен простой пример того, как использовать его для отчета об использовании сети / пропускной способности .
Установка collectl в Ubuntu или Debian
Установка collectl в Fedora
Выводы
Как и говорили вначале, мы рассказали про несколько удобных команд, для того чтобы быстро проверить пропускную способность сети на вашем Linux-сервере. Однако им нужно, чтобы пользователь заходил на удаленный сервер через ssh. В качестве альтернативы для одной и той же задачи можно использовать веб-инструменты мониторинга.
Ntop и Darkstat — это одни из основных сетевых средств мониторинга сети, доступных для Linux. Помимо этого, инструменты мониторинга уровня предприятия, такие как Nagios, предоставляют множество функций, позволяющих не только контролировать сервер, но и всю инфраструктуру.
Если у вас остались какие-то вопросы по теме «Мониторинг сети Linux» то, пишите нам про них в форму комментариев на сайте. Спасибо за визит!
Если вы нашли ошибку, пожалуйста, выделите фрагмент текста и нажмите Ctrl+Enter.
Источник
18 Commands to Monitor Network Bandwidth on Linux server
Network monitoring on Linux
This post mentions some linux command line tools that can be used to monitor the network usage.
These tools monitor the traffic flowing through network interfaces and measure the speed at which data is currently being transferred. Incoming and outgoing traffic is shown separately.
Some of the commands, show the bandwidth used by individual processes. This makes it easy to detect a process that is overusing network bandwidth.
The tools have different mechanisms of generating the traffic report.
Some of the tools like nload read the «/proc/net/dev» file to get traffic stats, whereas some tools use the pcap library to capture all packets and then calculate the total size to estimate the traffic load.
Here is a list of the commands, sorted by their features.
Now lets take a look at each of the commands and how to use them to monitor network usage:
1. Nload
Nload is a commandline tool that allows users to monitor the incoming and outgoing traffic separately.
It also draws out a graph to indicate the same, the scale of which can be adjusted. Easy and simple to use, and does not support many options.
So if you just need to take a quick look at the total bandwidth usage without details of individual processes, then nload will be handy.
Installing Nload — Fedora and Ubuntu have got it in the default repos. CentOS users need to get nload from Epel repositories.
2. iftop
Iftop measures the data flowing through individual socket connections, and it works in a manner that is different from Nload.
Iftop uses the pcap library to capture the packets moving in and out of the network adapter, and then sums up the size and count to find the total bandwidth under use.
Although iftop reports the bandwidth used by individual connections, it cannot report the process name/id involved in the particular socket connection.
But being based on the pcap library, iftop is able to filter the traffic and report bandwidth usage over selected host connections as specified by the filter.
The n option prevents iftop from resolving ip addresses to hostname, which causes additional network traffic of its own.

Install iftop — Ubuntu/Debian/Fedora users get it from default repos. CentOS users get it from Epel.
3. iptraf
Iptraf is an interactive and colorful IP Lan monitor. It shows individual connections and the amount of data flowing between the hosts. Here is a screenshot

4. nethogs
Nethogs is a small ‘net top’ tool that shows the bandwidth used by individual processes and sorts the list putting the most intensive processes on top.
In the event of a sudden bandwidth spike, quickly open nethogs and find the process responsible. Nethogs reports the PID, user and the path of the program.
Install Nethogs — Ubuntu, Debian, Fedora users get from default repos. CentOS users need Epel
5. bmon
Bmon (Bandwidth Monitor) is a tool similar to nload that shows the traffic load over all the network interfaces on the system. The output also consists of a graph and a section with packet level details.
Install Bmon — Ubuntu, Debian and Fedora users can install from default repos. CentOS users need to setup repoforge, since its not available in Epel.
Bmon supports many options and is capable of producing reports in html format. Check the man page for more information
6. slurm
Slurm is ‘yet’ another network load monitor that shows device statistics along with an ascii graph. It supports 3 different styles of graphs each of which can be activated using the c, s and l keys. Simple in features, slurm does not display any further details about the network load.
7. tcptrack
Tcptrack is similar to iftop, and uses the pcap library to capture packets and calculate various statistics like the bandwidth used in each connection.
It also supports the standard pcap filters that can be used to monitor specific connections.

Install tcptrack — Ubuntu, Debian and Fedora have it in default repos. CentOS users need to get it from RepoForge as it is not available in Epel either.
8. Vnstat
Vnstat is bit different from most of the other tools. It actually runs a background service/daemon and keeps recording the size of data transfer all the time.
Next it can be used to generate a report of the history of network usage.
Running vnstat without any options would simply show the total amount of data transfer that took place since the date the daemon is running.
To monitor the bandwidth usage in realtime, use the ‘-l’ option (live mode). It would then show the total bandwidth used by incoming and outgoing data, but in a very precise manner without any internal details about host connections or processes.
Vnstat is more like a tool to get historic reports of how much bandwidth is used everyday or over the past month. It is not strictly a tool for monitoring the network in real time.
Vnstat supports many options, details about which can be found in the man page.
9. bwm-ng
Bwm-ng (Bandwidth Monitor Next Generation) is another very simple real time network load monitor that reports a summary of the speed at which data is being transferred in and out of all available network interfaces on the system.
If the console size is sufficiently large, bwm-ng can also draw bar graphs for the traffic using the curses2 output mode.
Install Bwm-NG — On CentOS bwm-ng can be installed from Epel.
10. cbm — Color Bandwidth Meter
A tiny little simple bandwidth monitor that displays the traffic volume through network interfaces. No further options, just the traffic stats are display and updated in realtime.
11. speedometer
Another small and simple tool that just draws out good looking graphs of incoming and outgoing traffic through a given interface.
12. Pktstat
Pktstat displays all the active connections in real time, and the speed at which data is being transferred through them.
It also displays the type of the connection, i.e. tcp or udp and also details about http requests if involved.
13. Netwatch
Netwatch is part of the netdiag collection of tools, and it too displays the connections between local host and other remote hosts, and the speed at which data is transferring on each connection.
14. Trafshow
Like netwatch and pktstat, trafshow reports the current active connections, their protocol and the data transfer speed on each connection. It can filter out connections using pcap type filters.
Monitor only tcp connections
15. Netload
The netload command just displays a small report on the current traffic load, and the total number of bytes transferred since the program start. No more features are there. Its part of the netdiag.
16. ifstat
The ifstat reports the network bandwidth in a batch style mode. The output is in a format that is easy to log and parse using other programs or utilities.
Install ifstat — Ubuntu, Debian and Fedora users have it in the default repos. CentOS users need to get it from Repoforge, since its not there in Epel.
17. dstat
Dstat is a versatile tool (written in python) that can monitor different system statistics and report them in a batch style mode or log the data to a csv or similar file. This example shows how to use dstat to report network bandwidth
18. collectl
Collectl reports system statistics in a style that is similar to dstat, and like dstat it is gathers statistics about various different system resources like cpu, memory, network etc.
Over here is a simple example of how to use it to report network usage/bandwidth.
Summary
Those were a few handy commands to quickly check the network bandwidth on your linux server. However these need the user to login to the remote server over ssh.
Alternatively web based monitoring tools can also be used for the same task.
Ntop and Darkstat are some of the basic web based network monitoring tools available for Linux.
Beyond these lie the enterprise level monitoring tools like Nagios that provide a host of features to not just monitor a server but entire infrastructure.
A Tech Enthusiast, Blogger, Linux Fan and a Software Developer. Writes about Computer hardware, Linux and Open Source software and coding in Python, Php and Javascript. He can be reached at [email protected] .
88 thoughts on “ 18 Commands to Monitor Network Bandwidth on Linux server ”
Amazing Article, Really useful information to all So, I hope you will share more information to be check and share here.thanks for sharing.
Thanks for sharing this amazing informative article. this is best for cs students mainly linux student to know about these commands.
Wow, so much loads of usefulness! Thank you for this! Lots of tools I never heard and surprise they are there by default on reposity, just apt install away!!
Based on nethogs, there’s a Qt software providing charts per application:
https://slist.lilotux.net/linux/nethogs-qt/index_en.html
thanks for mentioning.
Very informative and useful article. We can see all the commands at one shot.
Thanks for sharing
it is really a great article and helping to learn about Linux network.
Keep sharing such great knowledge
These are perfect 100% working commands. That is quite amazing. Thanks for such a useful article…
Great article.It’s a big collection for monitor, is any app can track daily bandwidth ?
Thanks! Nethogs is perfect for me as it shows usage per process: current bandwith and total used, great!
Thanks, it is saving a lot of time
Very informative and useful article.
Thanks for sharing
that was really useful
thanks
Thanks for sharing informative article I have been looking for these command with step by step guide you did a great job and i found a solution that I am looking for keep up the good work.
You are right.
Actually i was too looking about this commands.
At least i found these all here.
Thanks.
This commands its very helpful for me i want to i want to know how to create a server 2012 r2 in home
20+ year vet here. pure gold .. many of these are new to me.
excellent article
glad that you liked it.
thanks for the comment.
Very good and useful compilation.
Good job and thanks!!
Now an article about _graphical_ monitor network applications would be even better 🙂
This a gem for commands.
Thanks 🙂
Thank you for this article, I didn’t know about these tools.
Thank you, very good article, a treasure trove 🙂
In our company we are several clients which are connected to an Ubuntu Server. Sometimes there is problem in entire network of company and we have heavy load on server. We try to find which client causes this problem.
As part of solution should be monitored entire network 24 hour per day? And if yes, which network monitoring tool helps us to find bad client and how to log it to analyze later?
How can we get complete status of each client and its transaction with our server? For example, a client named A have connection with server, how can we see how many bandwidths is used by this client?
Use a proper router like opnsense. It can monitor per host traffic and even put quotas on certain hosts or otherwise profile them to use less bandwidth.
Thank you. We can see all the commands at one shot.
Great article. Thanks for all you have done here. Very good examples and a good read. Exceptionally useful information.
Источник


