- Linux Performance
- Tools
- Documentation
- Talks
- 1. Linux Systems Performance (USENIX LISA 2019)
- 2. Linux Performance 2018 (PerconaLive 2018)
- 3. Linux Performance Tools (Velocity 2015)
- 4. How Netflix Tunes EC2 Instances for Performance (AWS re:Invent, 2017)
- 5. Container Performance Analysis (DockerCon, 2017)
- 6. Broken Linux Performance Tools (SCaLE14x, 2016)
- 7. Using Linux perf at Netflix (Kernel Recipes, 2017)
- 8. Give me 15 minutes and I’ll change your view of Linux tracing (LISA, 2016)
- 9. Performance analysis superpowers with Linux eBPF (O’Reilly Velocity, 2017)
- 10. Linux Performance Analysis: New Tools and Old Secrets (ftrace) (LISA 2014)
- 11. Performance Checklists for SREs (SREcon, 2016)
- Resources
Linux Performance
This page links to various Linux performance material I’ve created, including the tools maps on the right. These use a large font size to suit slide decks. You can also print them out for your office wall. They show: Linux observability tools, Linux static performance analysis tools, Linux benchmarking tools, Linux tuning tools, and Linux sar. Check the year on the image (bottom right) to see how recent it is.
There is also a hi-res diagram combining observability, static performance tuning, and perf-tools/bcc: png, svg (see discussion), but it is not as complete as the other diagrams. For even more diagrams, see my slide decks below.
Tools
- perf: perf one-liners, examples, visualizations.
- eBPF tools: BPF/bcc tracing tools and examples.
- perf-tools: Ftrace perf tools (github).
- bcc: BPF/bcc perf tools (github).
- bpftrace: BPF/bpftrace perf tools (github).
- Flame Graphs: using perf and other profilers.
Documentation
- Linux Performance Analysis in 60,000 Milliseconds shows the first ten commands to use in an investigation (video, PDF). Written by myself and the performance engineering team at Netflix (2015).
- My post Performance Tuning Linux Instances on EC2 includes the tunables we’re using at Netflix (2015).
- A post on Linux Load Averages: Solving the Mystery, explaining what they are and why they include the uninterruptible sleep state (2017).
- A gdb Debugging Full Example (Tutorial), including the use of some perf/debugging tools (2016).
- The book Systems Performance: Enterprise and the Cloud, 2nd Edition (2020) covers performance analysis methods and Linux tools, including perf, Ftrace, and eBPF.
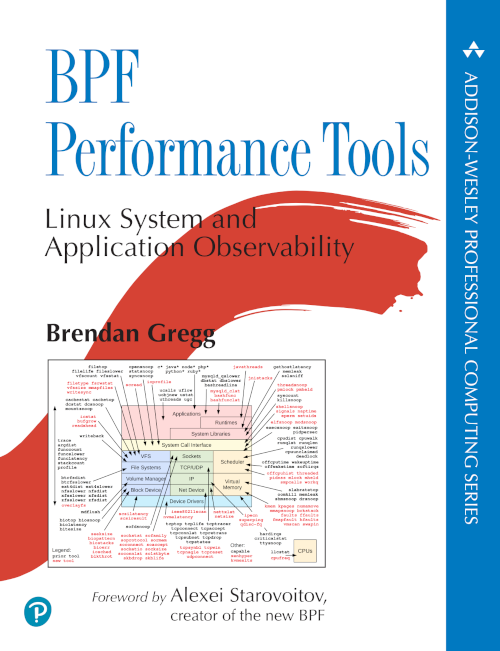
- The book BPF Performance Tools: Linux System and Application Observability tours over 100 eBPF performance analysis tools, while including short summaries of the traditional tools. In a way, this is volume 2, and Systems Performance 2nd Edition is volume 1.
- Generating flame graphs on Linux using perf & eBPF:
- CPU Flame Graphs
Off-CPU Flame Graphs
Memory Flame Graphs
- Linux eBPF (2015)
bcc: Taming Linux 4.3+ Tracing Superpowers
tcpconnect and tcpaccept for Linux (bcc)
Linux eBPF Stack Trace Hack (bcc) (2016)
Linux eBPF Off-CPU Flame Graph (bcc)
Linux Wakeup and Off-Wake Profiling (bcc)
Linux chain graph prototype (bcc)
Linux eBPF/bcc uprobes
Linux BPF/bcc Road Ahead
Ubuntu Xenial bcc/BPF
Linux bcc/BPF Tracing Security Capabilities
Linux MySQL Slow Query Tracing with bcc/BPF
Linux bcc/BPF ext4 Latency Tracing
Linux bcc/BPF Run Queue (Scheduler) Latency
Linux bcc/BPF Node.js USDT Tracing
Linux bcc tcptop
Linux 4.9’s Efficient BPF-based Profiler
DTrace for Linux 2016
Linux 4.x Tracing Tools: Using BPF Superpowers
Linux bcc/BPF tcplife: TCP Lifespans
Golang bcc/BPF Function Tracing (2017)
7 BPF tools for performance analysis on Fedora
TCP Tracepoints (2018)
Linux bcc/eBPF tcpdrop
bpftrace (DTrace 2.0) for Linux 2018
Learn eBPF Tracing: Tutorial and Examples (2019)
A thorough introduction to bpftrace
BPF: A New Type of Software
BPF Theremin, Tetris, and Typewriters
BPF binaries: BTF, CO-RE, and the future of BPF perf tools (2020)
USENIX LISA2021 BPF Internals (eBPF) (2021)
How To Add eBPF Observability To Your Product
- iosnoop for Linux, iosnoop Latency Heat Maps, opensnoop for Linux, execsnoop for Linux, ftrace: The Hidden Light Switch, tcpretrans
Page Cache Hit Ratio, uprobe: User-Level Dynamic Tracing, Hacking Linux USDT
- perf CPU Sampling, perf Static Tracepoints, perf Heat Maps, perf Counting, perf Kernel Line Tracing,
perf Off-CPU Time Flame Graphs, Linux Profiling at Netflix, Java Mixed-Mode Flame Graphs (PDF), Linux 4.5 perf folded format,
perf sched for Linux CPU scheduler analysis
Talks
In rough order of recommended viewing or difficulty, intro to more advanced:
1. Linux Systems Performance (USENIX LISA 2019)
This is my summary of Linux systems performance in 40 minutes, covering six facets: observability, methodologies, benchmarking, profiling, tracing, and tuning. It’s intended for everyone as a tour of fundamentals, and some companies have indicated they will use it for new hire training.
A video of the talk is on usenix.org and youtube, and the slides are on slideshare or as a PDF.
For a lot more information on observability tools, profiling, and tracing, see the talks that follow.
For a lot more information on observability tools, profiling, and tracing, see the talks that follow.
2. Linux Performance 2018 (PerconaLive 2018)
This was a 20 minute keynote summary of recent changes and features in Linux performance in 2018.
A video of the talk is on youtube, and the slides are on slideshare or as a PDF.
3. Linux Performance Tools (Velocity 2015)
At Velocity 2015, I gave a 90 minute tutorial on Linux performance tools, summarizing performance observability, benchmarking, tuning, static performance tuning, and tracing tools. I also covered performance methodology, and included some live demos. This should be useful for everyone working on Linux systems. If you just saw my PerconaLive2016 talk, then some content should be familiar, but with many extras: I focus a lot more on the tools in this talk.
A video of the talk is on youtube (playlist; part 1, part 2) and the slides are on slideshare or as a PDF.
This was similar to my SCaLE11x and LinuxCon talks, however, with 90 minutes I was able to cover more tools and methodologies, making it the most complete tour of the topic I’ve done. I also posted about it on the Netflix Tech Blog.
4. How Netflix Tunes EC2 Instances for Performance (AWS re:Invent, 2017)
Instead of performance observability, this talk is about tuning. I begin by providing Netflix background, covering instance types and features in the AWS EC2 cloud, and then talk about Linux kernel tunables and observability.
A video of the talk is on youtube and the slides are on slideshare:
5. Container Performance Analysis (DockerCon, 2017)
At DockerCon 2017 in Austin, I gave a talk on Linux container performance analysis, showing how to find bottlenecks in the host vs the container, how to profiler container apps, and dig deeper into the kernel.
A video of the talk is on youtube and the slides are on slideshare.
6. Broken Linux Performance Tools (SCaLE14x, 2016)
At the Southern California Linux Expo (SCaLE 14x), I gave a talk on Broken Linux Performance Tools. This was a follow-on to my earlier Linux Performance Tools talk originally at SCaLE11x (and more recently at Velocity as a tutorial). This broken tools talk was a tour of common problems with Linux system tools, metrics, statistics, visualizations, measurement overhead, and benchmarks. It also includes advice on how to cope (the green «What You Can Do» slides).
A video of the talk is on youtube and the slides are on slideshare or as a PDF.
7. Using Linux perf at Netflix (Kernel Recipes, 2017)
At Kernel Recipes 2017 I gave an updated talk on Linux perf at Netflix, focusing on getting CPU profiling and flame graphs to work. This talk includes a crash course on perf_events, plus gotchas such as fixing stack traces and symbols when profiling Java, Node.js, VMs, and containers.
A video of the talk is on youtube and the slides are on slideshare:
There’s also an older version of this talk from 2015, which I’ve posted about. To learn more about flame graphs, see my flame graphs presentation.
In a post about this talk, I included the interactive CPU flame graph SVG I was demonstrating.
Posted by At Scale on Friday, February 26, 2016
8. Give me 15 minutes and I’ll change your view of Linux tracing (LISA, 2016)
I gave this demo at USENIX/LISA 2016, showing ftrace, perf, and bcc/BPF. A video is on youtube (sorry, the sound effects are a bit too loud):.
This was the first part of a longer talk on Linux 4.x Tracing Tools: Using BPF Superpowers. See the full talk video and talk slides.
9. Performance analysis superpowers with Linux eBPF (O’Reilly Velocity, 2017)
This talk covers using enhanced BPF (aka eBPF) features added to the Linux 4.x series for performance analysis, observability, and debugging. The front-end used in this talk is bcc (BPF compiler collection), an open source project that provides BPF interfaces and a collection of tools.
A video of the talk is on youtube, and the slides are on slideshare or as a PDF.
For another talk on BPF that discuses off-CPU analysis in detail, see my earlier talk Linux 4.x Performance: Using BPF Superpowers from Performance@Scale 2016.
10. Linux Performance Analysis: New Tools and Old Secrets (ftrace) (LISA 2014)
At USENIX LISA 2014, I gave a talk on the new ftrace and perf_events tools I’ve been developing: the perf-tools collection on github, which mostly uses ftrace: a tracer that has been built into the Linux kernel for many years, but few have discovered (practically a secret).
A video of the talk is on youtube, and the slides are on slideshare or as a PDF. In a post about this talk, I included some more screenshots of these tools in action.
The perf-tools collection, inspired by my earlier DTraceToolkit, provides advanced system performance analysis tools for Linux. Each tool has a man page and example file. They are unstable and unsupported, and they currently use shell scripting, hacks, and the ftrace and perf_events kernel tracing frameworks. They should be developed (and improved) as the Linux kernel acquires more tracing capabilities (eg, eBPF).
In a post about this talk, I included some more screenshots of these tools in action.
11. Performance Checklists for SREs (SREcon, 2016)
At SREcon 2016 Santa Clara, I gave the closing talk on performance checklists for SREs (Site Reliability Engineers). The later half of this talk included Linux checklists for incident performance response. These may be useful whether you’re analyzing Linux performance in a hurry or not.
A video of the talk is on youtube and usenix, and the slides are on slideshare and as a PDF. I included the checklists in a blog post.
This presentation also contains ponies. Lots of ponies. These are the unofficial mascots for DTrace, perf_events, SystemTap, ktap, and LTTng, and were designed by the same person (Deirdré) who designed the original (and popular) DTrace ponycorn.
Update 2018: This talk is now out of date, as Linux has come a long way in the last four years: Linux 3.13 to Linux 4.16. Solaris is also believed to have died in 2017, so I wrote the post Solaris to Linux Migration 2017.
Resources
Other resources (not by me) I’d recommend for the topic of Linux performance:
- Performance analysis & tuning of Red Hat Enterprise Linux — 2015 Red Hat Summit (video 2hrs): this is a great and in-depth tour of Linux performance tuning that should be largely applicable to all Linux distros.
- Linux Instrumentation: slides from a great talk in June 2010 by Ian Munsie, which summarizes the different Linux tracers very well. If you’re trying to understand all the tracers and frameworks, this is worth studying (keeping in mind it’s from 2010).
- Julia Evans blog has many posts about many topics, including performance tools.
- Davidlohr Bueso’s Linux performance posts.
BPF Performance Tools book
I’m speaking at AWS re:Invent 2019 —>
Recent posts:
- 26 Sep 2021 »
The Speed of Time - 06 Sep 2021 »
ZFS Is Mysteriously Eating My CPU - 30 Aug 2021 »
Analyzing a High Rate of Paging - 27 Aug 2021 »
Slack’s Secret STDERR Messages - 05 Jul 2021 »
USENIX LISA2021 Computing Performance: On the Horizon - 03 Jul 2021 »
How To Add eBPF Observability To Your Product - 15 Jun 2021 »
USENIX LISA2021 BPF Internals (eBPF) - 04 Jun 2021 »
An Unbelievable Demo - 29 May 2021 »
Moving my US tech job to Australia - 23 May 2021 »
What is Observability - 09 May 2021 »
Poor Disk Performance - 04 Nov 2020 »
BPF binaries: BTF, CO-RE, and the future of BPF perf tools - 15 Jul 2020 »
Systems Performance: Enterprise and the Cloud, 2nd Edition - 08 Mar 2020 »
LISA2019 Linux Systems Performance - 22 Dec 2019 »
BPF Theremin, Tetris, and Typewriters - 02 Dec 2019 »
BPF: A New Type of Software - 15 Oct 2019 »
Two kernel mysteries and the most technical talk I’ve ever seen - 19 Aug 2019 »
A thorough introduction to bpftrace - 15 Jul 2019 »
BPF Performance Tools: Linux System and Application Observability (book) - 26 Apr 2019 »
YOW! 2018 Cloud Performance Root Cause Analysis at Netflix
Blog index
About
RSS
I am program co-chair for LISA 2018 —>
Источник


