- Kali Linux — Reverse Engineering
- OllyDbg
- dex2jar
- jd-gui
- apktool
- GDB Tutorial for Reverse Engineers: Breakpoints, Modifying Memory and Printing its Contents
- GDB Setup With Plugins
- Program example
- First Steps with Debugging a Program
- Modifying Registers
- Modifying Memory
- Print xprint hexdump hexprint
- Final Thoughts
- Избранное: ссылки по reverse engineering
- 1. Тематики
- 1.a Reverse engineering
- 1.b Поиск уязвимостей
- 1.c Примеры эксплуатации найденных уязвимостей
- 1.d Анализ вредоносных программ
- 2. Необходимый инструментарий
- 2.a IDA Pro
- 2.b Radare2
- 2.c WinDBG (Ollydbg / Immunity Debugger / x64dbg)
- 2.d GDB
- 2.e DBI
- 2.f SMT
- 2.g Python для автоматизации
- 2.h BAF (Binary Analysis Frameworks)
- 3. Архитектуры
- 3.a x86-x86_64
- 3.b ARM
- 4.a Windows
- 4.b Linux
- 4.c Mac OS(OSX) / iOS
- 4.d Android
- 5. Форматы исполняемых файлов
- 5.a PE
- 5.b ELF
- 5.c Mach-O
- 6. Программирование
- 6.a C/C++
- 6.b ASM
- 7. Практика
- 7.a War Games
Kali Linux — Reverse Engineering
In this chapter, we will learn about the reverse engineering tools of Kali Linux.
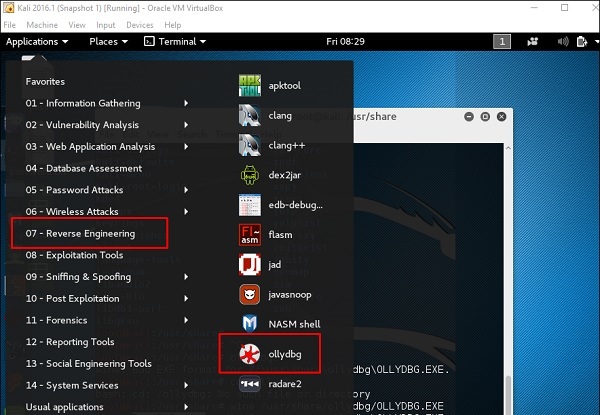
OllyDbg
OllyDbg is a 32-bit assembler level analyzing debugger for Microsoft Windows applications. Emphasis on binary code analysis makes it particularly useful in cases where the source is unavailable. Generally, it is used to crack the commercial softwares.
To open it, go to Applications → Reverse Engineering → ollydbg
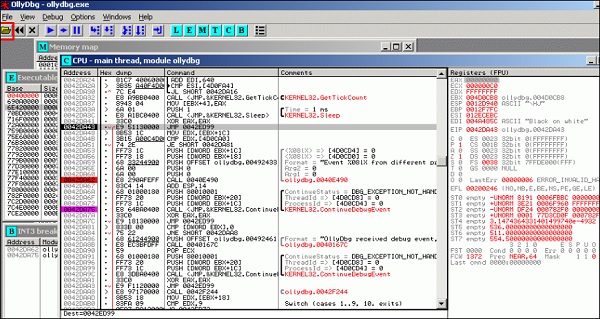
To load a EXE file, go the “Opening folder” in yellow color, which is shown in a red square in the above screenshot.
After loading, you will have the following view where you can change the binaries.
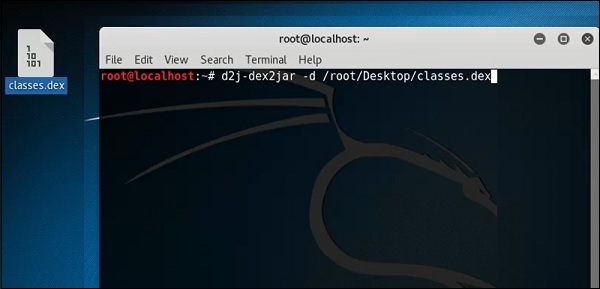
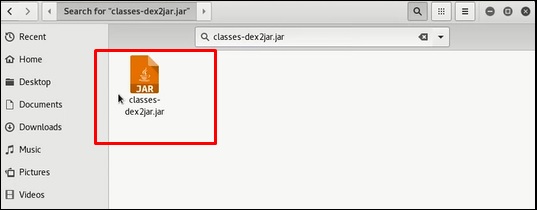
dex2jar
This is an application that helps convert APK file (android) to JAR file in order to view the source code. To use it, open the terminal and write ”d2j-dex2jar –d /file location”.
In this case, the file is “classes.dex” on the desktop.
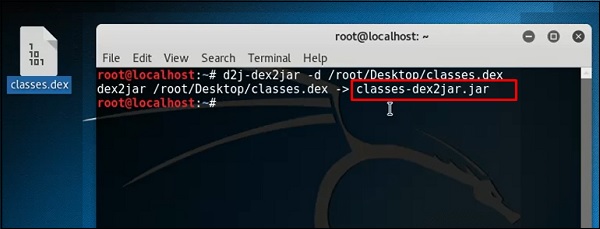
The following line shows that a JAR file has been created.
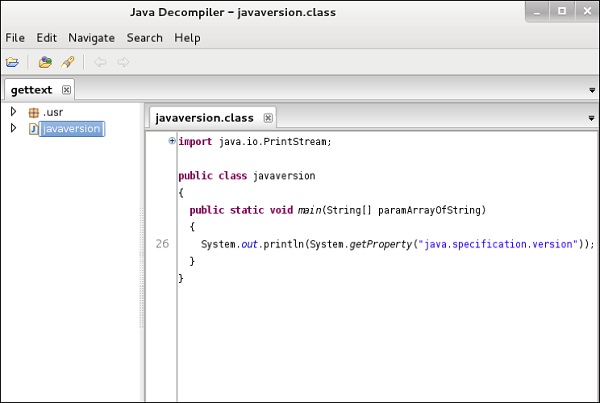
jd-gui
JD-GUI is a standalone graphical utility that displays Java source codes of “.class” files. You can browse the reconstructed source code. In this case, we can reconstruct the file that we extracted from the dex2jar tool.
To launch it, open the terminal and write “jd-gui” and the following view will open.
To import the file, click the open folder  icon on the left upper corner and then import the file.
apktool
Apktool is one of the best tools to reverse the whole android application. It can decode resources to nearly an original form and rebuild them after making modifications.
To open it, go to the terminal and write “ apktool”.
To decompile a apk file, write “apktool d apk file”.

Decompilation will start as shown in the following screenshot.
Источник
GDB Tutorial for Reverse Engineers: Breakpoints, Modifying Memory and Printing its Contents

GDB is THE debugger for Linux programs. It’s super powerful. But its user-friendliness or lack thereof can actually make you throw your PC out of the window. But what’s important to understand about GDB is that GDB is not simply a tool, it’s a debugging framework for you to build upon. In this video, I’m gonna walk you through GDB setup for reverse engineering and show you all of the necessary commands and shortcuts for your debugging workflow.
GDB Setup With Plugins
The most common mistake I see is that people perceive GDB as a standalone debugger tool. I suggest you think of GDB as a debugger framework that allows you to build your own tools. Or you can use premade tools. My GDB-based tool of choice is Peda. It’s pretty easy to install, just follow installation instructions from Peda repository: https://github.com/longld/peda
Program example
I’ll be using this simple program as our debugging target:
This code creates local variable X on the stack, prints its value to the console, then adds 5 to X, and prints its value again. Pretty simple, just what we need for our learning example.
First Steps with Debugging a Program
To open a file in GDB, type gdb [filename] in the console. GDB will open and load your file. Notice, that code execution hasn’t started. That’s because there’s a separate command to start the execution, it’s called run , or r for short.

And if we start it, our program successfully completes execution. That’s because we haven’t set any breakpoints yet. We can set a breakpoint using symbol name, for example, break main , or using address: `break *0x555555555149`. You can print a list of all your breakpoints with ‘info breakpoints’ and delete them with delete
.
Now if I issue run command, the execution conveniently stops at the beginning of the “main” function. And just to save us some time we can use command start which comes from Peda instead of doing all of this. This command will do all this work for us.
Of course, as with any other debugger, we can use single-stepping with command step or stepi .
And if you like to do single-stepping a lot, note, that pressing ‘Return’ on an empty line will make GDB execute the previous command you entered once more. Also, you can use command next to single step without entering function calls.
To step through several instructions at once you can use command next .
If you want to continue execution to a certain point in a program (for example to exit a loop), you can use command xuntil .
Modifying Registers
To modify registers, use following construction set$ = 1234 . For example, if I want to skip incrementing X, I can change the value of RIP register to 0x555555555176 with command set $RIP = 0x555555555176 .
As you might have noticed, you can treat registers like variables in GDB. So I can assign RIP value of EAX with set $rip = $eax command. Now I can issue context command to make Peda reprint its beautiful context “window” to make sure that RIP points to some nonsense.
And I want to start execution from the start of ‘main’ function I can just write set $rip = main .
By the way, with Peda you have a faster way to skip instructions without executing them with skipi command.
Modifying Memory
Modifying memory is similar to modifying registers in the sense that any memory location can be a variable in GDB. So in my example, I want to change the contents of the format string “x = %d”. This string is located at 0x555555556004 in my binary. I can use this address as a variable and type in the same command as with registers: set 0x555555556004 = “AAAA%d” . But in this case, we’ll see an error message. That’s because you should always provide a variable type when modifying memory in GDB. So let me correct my command to set
Print xprint hexdump hexprint
You can use the command x to examine memory. For example, if I want to print 20 8-byte words from the stack pointer, I’ll use command x/20xg $rsp : 20 — the number of words, x — hexadecimal format, g — giant (8-byte words).
By changing the second x to i you can print memory as instructions.
The full list of supported modifiers you can find in the documentation:
You can use the command x (for “examine”) to examine memory in any of several formats, independently of your program’s data types.
x/nfu addrx addrx Use the x command to examine memory.
n, f, and u are all optional parameters that specify how much memory to display and how to format it; addr is an expression giving the address where you want to start displaying memory. If you use defaults for nfu, you need not type the slash ‘/’. Several commands set convenient defaults for addr.
n, the repeat countThe repeat count is a decimal integer; the default is 1. It specifies how much memory (counting by units u) to display. If a negative number is specified, memory is examined backward from addr.f, the display formatThe display format is one of the formats used by print (‘x’, ‘d’, ‘u’, ‘o’, ‘t’, ‘a’, ‘c’, ‘f’, ‘s’), and in addition ‘i’ (for machine instructions). The default is ‘x’ (hexadecimal) initially. The default changes each time you use either x or print .u, the unit sizeThe unit size is any of b Bytes. h Halfwords (two bytes). w Words (four bytes). This is the initial default. g Giant words (eight bytes).
Also, Peda provides you with a convenient hexdump address /count (dump “count” lines, 16-bytes each) command which you can use… well, to display hex dump.
And if you want to print again all the stuff Peda shows to you (instructions, registers, stack, etc.), you command context .
Final Thoughts
So today we’ve seen a glimpse of GDB functionality. To sum up, I want you to take home 3 things:
use Peda or a different GDB plugin that suits you
use ‘break’ and ‘delete’ commands to control breakpoints
use ‘x’ command to print memory contents
If you have any further questions on GDB, please leave a comment below. Like the article, if you want more content like this. And happy hacking, you guys.
As always, instead of reading this article, you can watch the full video (bonus outtakes and cats included):
Источник
Избранное: ссылки по reverse engineering
Сегодня мы хотели бы поделиться своим списком материалов по тематике reverse engineering (RE). Перечень этот очень обширный, ведь наш исследовательский отдел в первую очередь занимается задачами RE. На наш взгляд, подборка материалов по теме хороша для старта, при этом она может быть актуальной в течение продолжительного времени.
Данный список ссылок, ресурсов, книг мы уже лет пять рассылаем людям, которые хотели бы попасть в наш исследовательский отдел, но не проходят пока по уровню знаний или только начинают свой путь в сфере информационной безопасности. Естественно, этому перечню, как и большинству материалов/подборок, через некоторая время потребуется обновление и актуализация.
Забавный факт: нам показывали, как некоторые компании рассылают наш список материалов от себя, но только в очень старой редакции. И вот после этой публикации они, наконец, смогут использовать его обновленную версию с чистой совестью 😉
Итак, перейдем к списку материалов!
1. Тематики
В данном разделе мы рассмотрим основные направления применения RE. Начнем непосредственно с самого процесса обратной разработки, перейдем к поиску уязвимостей и разработке эксплоитов, и, конечно, доберемся до анализа вредоносных программ.
1.a Reverse engineering
1.b Поиск уязвимостей
1.c Примеры эксплуатации найденных уязвимостей
1.d Анализ вредоносных программ
2. Необходимый инструментарий
Ниже представлены популярные инструменты, применяемые при RE.
2.a IDA Pro
2.b Radare2
2.c WinDBG (Ollydbg / Immunity Debugger / x64dbg)
Без знания принципов работы отладчика и умения им пользоваться тоже не обойтись. Ниже мы рассмотрим отладчики для ОС Windows, а в следующем пункте уделим внимание знаменитому GDB. Итак, поехали:
- Advanced Windows Debugging: Developing and Administering Reliable, Robust, and Secure Software — в первую очередь, эта книга пригодится для понимания и «отлова» ошибок типа повреждения кучи;
- «Inside Windows Debugging: A Practical Guide to Debugging and Tracing Strategies in Windows» — это издание хорошо дополнит предыдущую книгу;
- «Введение в крэкинг с нуля, используя OllyDbg» — к сожалению, старейший ресурс wasm.ru закрылся, но подобная подборка легко ищется, поскольку была продублирована на множество ресурсов. К тому же, в сети стали появляться «форки», только в них уже используется x64dbg или IDA.
2.d GDB
2.e DBI
Программируемая отладка — это сегодня неотъемлемый подход в арсенале любого реверсера. И DBI — один из инструментов. Подробнее:
- «Dynamic Binary Instrumentation в ИБ» — в этой статье уже собрана некоторая обобщенная информация про DBI;
- «Light And Dark Side Of Code Instrumentation» — данная презентация поможет вам ориентироваться в разновидностях различных инструментаций кода и в том, что и когда вам может помочь с анализом программ.
2.f SMT
Что такое SMT-решатель? Если кратко, SMT-решатель — это программа, которая может решать логические формулы.
Основная идея применения SMT в области безопасности ПО заключается в том, чтобы перевести программный код или алгоритм в логическую формулу, а затем с помощью SMT-решателя проверить то или иное свойство этого кода.
Другими словами, SMT предоставляет математический аппарат для семантического анализа кода.
SMT-решатели уже довольно давно применяются в нашей сфере. Они неплохо зарекомендовали себя для решения следующих задач:
- поиск багов (статический анализ/фаззинг);
- деобфускация;
- «домашний» криптоанализ;
- символьное исполнение (в качестве «движка»);
- также есть определенные успехи в области автоматической генерации эксплойтов (например, генерации ROP).
За это время SMT потеряла ореол таинственности, появились более-менее работающие инструменты для «простых» людей.
Ниже приведены источники, которые помогут погрузиться в тему:
- «SMT Solvers for Software Security, Sean Heelan, Rolf Rolles» — пожалуй, первая научная работа, в которой было предложено применение SMT для решения задач в области безопасности ПО. Дает представление о том, где и как SMT может найти свое место в данной сфере;
- Z3 — один из самых популярных и эффективных SMT-решателей;
- Z3 wiki – репозиторий проекта;
- «Getting Started with Z3: A Guide» — онлайн-учебник, SMT-решатель для экспериментов;
- Z3Py — обвязка на Python для Z3;
- «Experimenting with Z3 — Dead code elimination»;
- «Experimenting with Z3 — Proving opaque predicates»;
- «Theorem prover, symbolic execution and practical reverse-engineering» — хорошая обзорная презентация, с примерами решения реальных задач и применения Z3Py;
- «Quick introduction into SAT/SMT solvers and symbolic execution» (версия на русском) – хорошая книга с интересными практическими примерами.
- «An introduction to the use SMT solvers» — обзорный материал.
2.g Python для автоматизации
Сегодня без знаний основ языка Python будет очень сложно, потому что этот язык программирования считается самым популярном средством для автоматизации различных задач в сфере ИБ (и не только). К тому же, он используется в различных утилитах (к примеру, все указанные выше утилиты позволяют дополнять функционал с помощью этого ЯП):
- «Gray Hat Python» (перевод) — отличная книга, которая расскажет, чем полезен Python в реверсе;
- «The Beginner’s Guide to IDAPython» — бесплатная книга о IDAPython;
- «Python Arsenal for Reverse Engineering» — ресурс, посвященный различным утилитами и библиотекам для reverse engineering, использующим Python.
2.h BAF (Binary Analysis Frameworks)
Для немного более продвинутых мы рекомендуем обратить внимание на целые фреймворки, которые в своем составе используют ранее упомянутые механизмы и средства анализа для решения более сложных задач. Итак, вот они:
Несколько интересных фреймворков/инструментов:
3. Архитектуры
Мы рассмотрим только несколько популярных архитектур. В конце статьи в разделе с дополнительными материалами вы найдете информацию по многим другим (MIPS, PowerPC и т.д.).
3.a x86-x86_64
3.b ARM
Знание принципов работы популярных Операционных Систем.
4.a Windows
4.b Linux
4.c Mac OS(OSX) / iOS
4.d Android
5. Форматы исполняемых файлов
В этом разделе представлены ссылки, разъясняющие подробности популярных форматов исполняемых файлов.
5.a PE
5.b ELF
5.c Mach-O
Известный исследователь corkami делает очень полезные и интересные «постеры» со схемой различных форматов файлов, в том числе, упомянутых выше. Советуем использовать их как шпаргалку. А утилита Kaitai Sctruct поможет при анализе.
6. Программирование
Один наш знакомый как-то сказал, что хороший реверсер это на 80% хороший программист. Умение программировать и понимание того, что и зачем делается, упрощает процесс исследования чужой программы. Поэтому без программирования в реверсе никуда. Ну и конечно автоматизация рутинной задачи, как вы уже наверняка поняли, — очень полезная вещь 😉
6.a C/C++
6.b ASM
7. Практика
В этой секции представлены ссылки на виртуальные машины и online-ресурсы, позволяющие попрактиковаться.
7.a War Games
Ну и напоследок несколько ссылок с большим количеством материалов по вышеуказанным темам:
Источник


