- Основные log файлы в Ubuntu — загрузка, авторизация, ошибки и др.
- Основные log файлы Ubuntu
- Лог загрузки
- Логи авторизации, в том числе ssh
- Логи ошибок в Ubuntu
- Cron logs
- Лог действий пользователя
- How to Fix Common Nginx Web Server Errors
- Unable to connect/Refused to Connect
- The Connection Has Timed Out
- 404 Not Found
- 403 Forbidden
- 500 Internal Server Error
- Nginx Shows the default page
- The page isn’t redirecting properly
- 504 Gateway time-out
- Memory Size Exhausted
- PR_END_OF_FILE_ERROR
- PHP-FPM Upstream Time Out
- Resource temporarily unavailable
- Two Virtual Host file For the Same Website
- PHP-FPM Connection reset by peer
- Nginx Socket Leaks
- Cloudflare Errors
- 521 Web Server is Down
- The page isn’t redirecting properly
- Wrapping Up
Основные log файлы в Ubuntu — загрузка, авторизация, ошибки и др.
Приветствую читателей своего сайта. Сегодня я всесторонне рассмотрю тему тему логов в Ubuntu — ошибки, загрузка, системные логи, cron и остальное. Постараюсь дать обзорную информацию по основным моментам в этой теме. Материал в основном рассчитан на новичков, но возможно восполнит пробелы и специалистов.
Основные log файлы Ubuntu
Традиционно логи в Linux хранятся в директории /var/log . Вот описание стандартных лог файлов Ubuntu, которые там присутствуют. Кстати, если вы только планируете устанавливать ubuntu, то можете воспользоваться моей подробной статьей на этот счет — установка ubuntu server. Так же вам может быть интересен мой обзор и сравнение сервера убунту с другими linux системами — Ubuntu Server — обзор для начинающих, сравнение, отзывы.
- syslog или messages. Последнего чаще всего нет и вместо него только syslog. Это традиционные глобальные системные журналы операционной системы linux. Сюда пишутся события загрузки, ядра системы, системы инициализации systemd и т.д.
- auth.log — лог авторизации и аутентификации в системе.
- dmesg — в этом логе хранится информация о загрузке ядра и драйверов оборудования.
- alternatives.log — лог файл программы update-alternatives. Не знаю, за какие такие заслуги ей выделили отдельный лог файл, а cron, к примеру, нет.
- kern.log — лог сообщений ядра ubuntu, да и любой другой linux системы.
- maillog — сообщения почтовой системы. Обычно postfix или exim. Если на сервере ubuntu они не установлены, то и почтового лога не будет.
- dpkg.log — логирование работы пакетных менеджеров ubuntu. Обычно это apt или apt-get.
- lastlog и wtmp — информация о прошлых авторизациях пользователей.
Лог загрузки
Начнем с самого начала. В момент загрузки системы записывается вся основная информация, имеющая к ней отношение. Если у вас будут какие-то ошибки во время старта сервера, вы сможете их увидеть в этом логе. Посмотреть лог загрузки Ubuntu можно следующим образом.
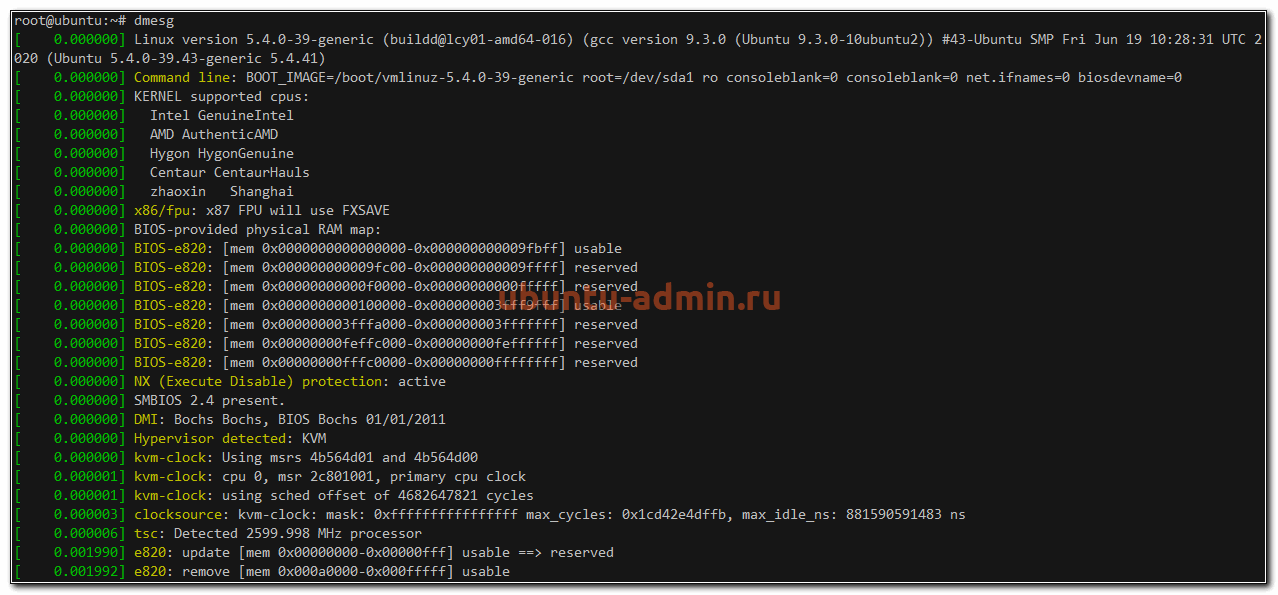
У вас получится очень длинный вывод всего того, что происходило с системой на старте. Если ищите что-то конкретное, то можете сделать фильтрацию вывода с помощью grep. Допустим, вам надо узнать информацию только о диске.
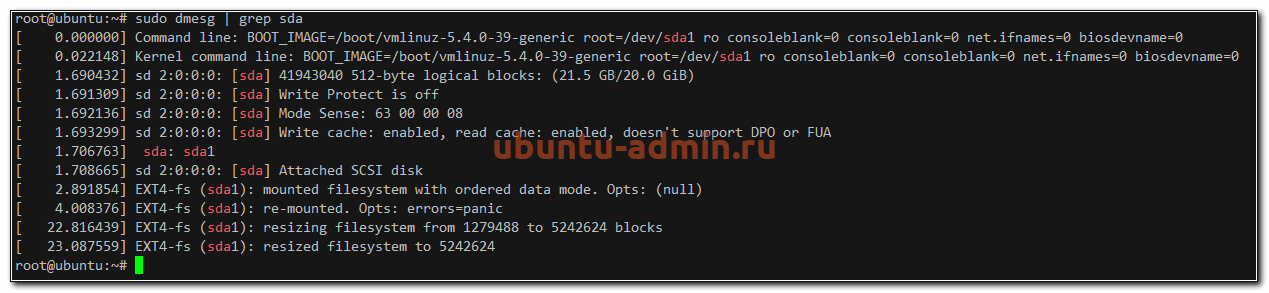
Вы увидите лог загрузки системы ubuntu, содержащий информацию только о диске sda. Аналогичным образом можно фильтровать вывод по другим темам. Например, посмотреть все ошибки, которые были во время загрузки.
И так далее. Информация, которую выводит команда dmesg, хранится в log файле /var/log/dmesg .
Логи авторизации, в том числе ssh
Для того, чтобы узнать, кто и когда проходил авторизацию на сервере ubuntu, можно воспользоваться логами из файла /var/log/auth.log . Авторизация по ssh там будет выглядеть следующим образом.

Здесь мы видим ip адрес, с которого произошло подключение и слепок сертификата, так как аутентификация была произведена с его помощью. Если хотите повысить уровень логирования подключений по ssh и получать больше информации, то можете отредактировать конфигурационный файл sshd — /etc/ssh/sshd_config , добавив туда следующий параметр.
Не забудьте перезапустить службу sshd для принятия изменений:
После этого логирование подключений по ssh будет более подробное.
Лог локального входа в ubuntu тоже хранится в файле auth.log . Информация о подключении через консоль выглядит следующим образом.
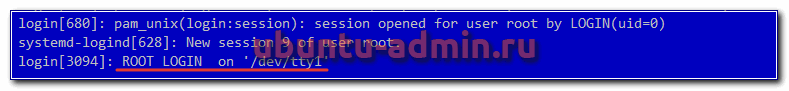
Устройство /dev/tty1 говорит о том, что вход локальный.
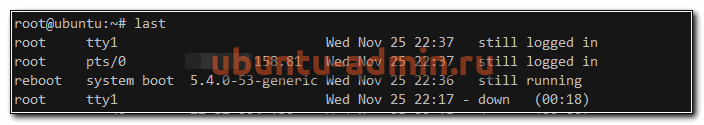
Вы можете быстро посмотреть информацию о последних входах в систему с помощью команды last. Эта информация хранится в бинарном логе /var/log/lastlog .
Примерно то же самое можно увидеть с помощью utmpdump.
Логи ошибок в Ubuntu
Рассмотрим теперь вопрос с расположением лога ошибок в Ubuntu. Как такового отдельного error log в традиционных linux системах нет. И Убунта тут не исключение. Ошибки придется искать по системным и программным логам выборкой ключевых слов. Обычно используют следующие фразы:
- error или err
- critical или crit
- debug
- warn
Например, посмотрим в логе загрузки dmesg все сообщения уровня предупреждений (warn).
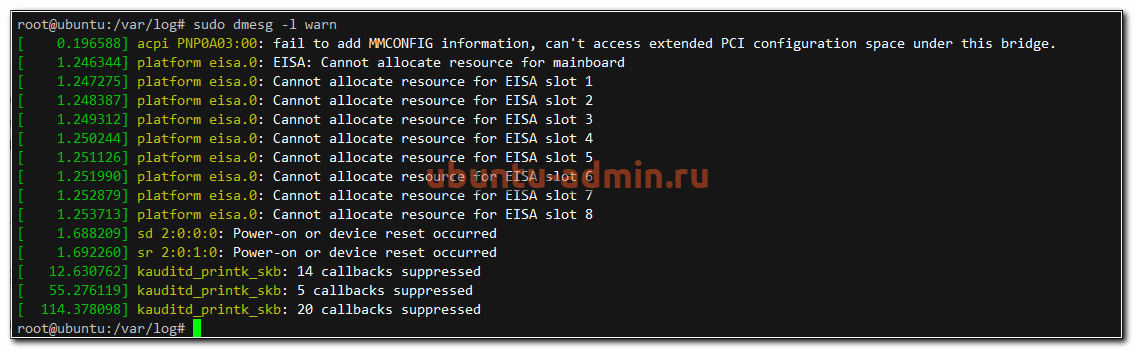
А теперь проверим ошибки в системном логе.
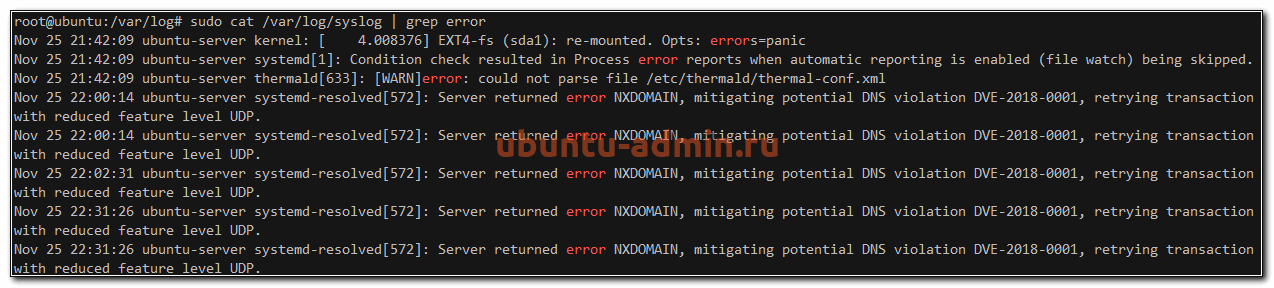
Видим некоторые ошибки в службе systemd-resolved.
Cron logs
Часто хочется проверить лог запуска периодических заданий cron. В Ubuntu, как мне кажется, сделали не удобно. По умолчанию, cron logs не выделены в отдельный файл. Искать их стоит в общем системном логе syslog. Например, в Centos существует отдельный лог-файл /var/log/cron, где собрана вся информация о запущенных заданиях. Предлагаю сделать так же в Ubuntu.
Для этого открываем конфигурационный файл /etc/rsyslog.d/50-default.conf и добавляем туда следующую информацию.
По умолчанию, она присутствует в конфиге, но закомментирована. Вам нужно убрать # в начале строки, чтобы раскомментировать ее. Так же я рекомендую сделать так, чтобы эти логи не дублировались в общий системный лог. Для этого немного измените следующую строку.
Я добавил в нее cron.none, чтобы логи cron не писались больше в системный лог syslog. После этого перезапустите службы rsyslog и cron и проверяйте изменения.
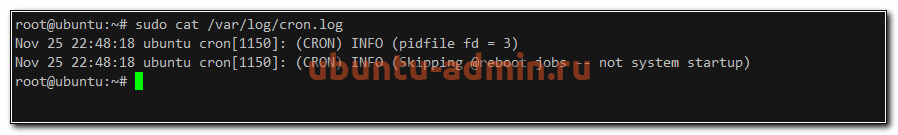
Теперь у нас все логи Cron в Ubuntu будут в отдельном файле.
Лог действий пользователя
Мне часто задают вопросы, как посмотреть лог действий пользователя в системе или как узнать, какие программы он запускал. По умолчанию, такие действия не логируются в ubuntu. Для этого нужно устанавливать какое-то дополнительное программное обеспечение. Я даже не знаю, кто умеет это делать. Обычно если надо фиксировать действия пользователя, включается лог работы sudo.
Для того, чтобы включить логирование действий пользователя через sudo, редактируем файл /etc/sudoers . Добавляем туда строку.
Теперь выполните какую-нибудь команду через sudo.
Выполненная команда пользователя сохранена в логе sudo.log. Теперь никто не сможет выполнить незаметно административные действия на сервере. Конечно, человек с полными правами сможет изменить любой лог файл, удалив свои действия при желании. Для этого важные логи нужно отправлять куда-то в другое место, но это уже тема отдельной статьи.
На сегодня по логам в Ubuntu у меня все. Желаю вам логов без ошибок и вечного аптайма (шутка, надо ставить обновы и перезагружаться).
Источник
How to Fix Common Nginx Web Server Errors
Nginx is a very popular web server these days. This article will show you some common errors when running an Nginx web server and possible solutions. This is not a complete list. If you still can’t fix the error after trying the advised solutions, please check your Nginx server logs under /var/log/nginx/ directory and search on Google to debug the problem.
Unable to connect/Refused to Connect
If you see the following error when trying to access your website:
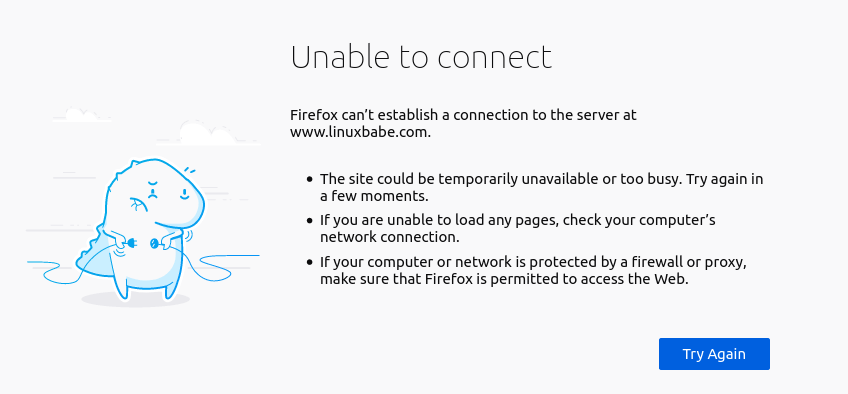
It could be that
- Nginx isn’t running. You can check Nginx status with sudo systemctl status nginx . Start Nginx with sudo systemctl start nginx . If Nginx fails to start, run sudo nginx -t to find if there is anything wrong with your configuration file. And check the journal ( sudo journalctl -eu nginx ) to find out why it fails to start.
- Firewall blocking ports 80 and 443. If you use the UFW firewall on Debian/Ubuntu, run sudo ufw allow 80,443/tcp to open TCP ports 80 and 443. If you use Firewalld on RHEL/CentOS/Rocky Linux/AlmaLinux, run sudo firewall-cmd —permanent —add-service=
- Fail2ban. If your server uses fail2ban to block malicious requests, it could be that fail2ban banned your IP address. Run sudo journalctl -eu fail2ban to check if your IP address is banned. You can add your IP address to the fail2ban ignoreip list, so it won’t be banned again.
- Nginx isn’t listening on the right network interface. For example, Nginx isn’t listening on the server’s public IP address.
The Connection Has Timed Out
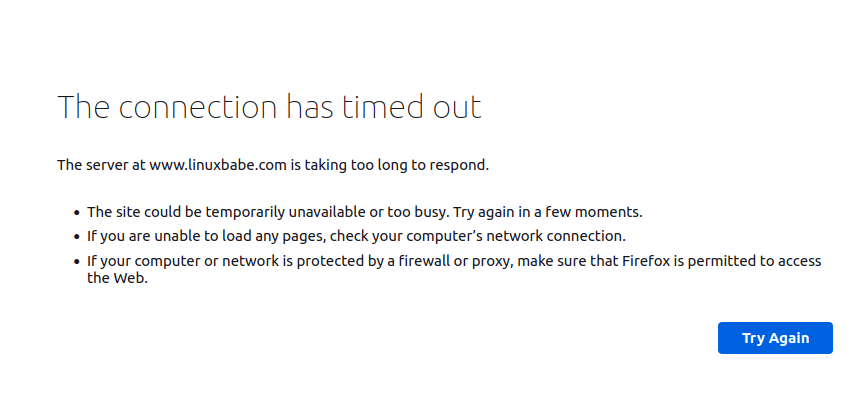
This could mean that your server is offline, or Nginx isn’t working properly. I once had an out-of-memory problem, which caused Nginx to fail to spawn the worker processes. If you can see the following error message in /var/log/nginx/error.log file, your server is short of memory.
404 Not Found
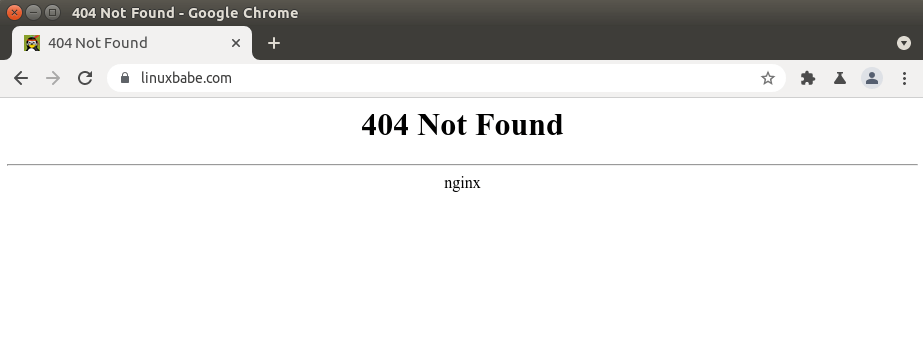
404 not found means Nginx can’t find the resources your web browser asks for. The reason could be:
- The web root directory doesn’t exist on your server. In Nginx, the web roor directory is configured using the root directive, like this: root /usr/share/nginx/linuxbabe.com/; . Make sure your website files (HTML, CSS, JavaScript, PHP) are stored in the correct directory.
- PHP-FPM isn’t running. You can check PHP-FPM status with sudo systemctl status php7.4-fpm (Debian/Ubuntu) or sudo systemctl status php-fpm .
- You forgot to include the try_files $uri /index.php$is_args$args; directive in your Nginx server config file. This directive is needed to process PHP code.
- Your server has no free disk space. Try to free up some disk space. You can use the ncdu utility ( sudo apt install ncdu or sudo dnf install ncdu ) to find out which directories are taking up huge amount of disk space.
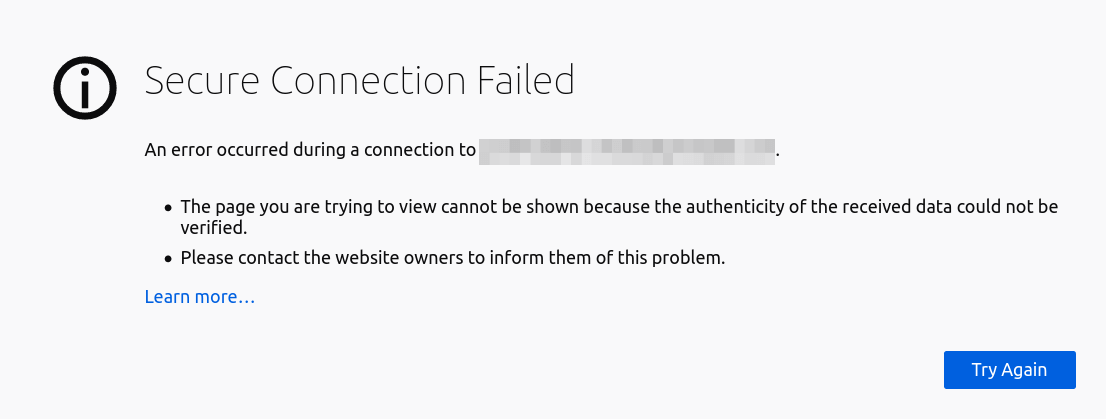
403 Forbidden
This error means that you are not allowed to access the request resources. Possible scenario includes:
- The website administrator blocks public access to the requested resources with an IP whitelist or other methods.
- The website could be using a web application firewall like ModSecurity, which detected an intrusion attack, so it blocked the request.
Some web applications may show a different error message when 403 forbidden happens. It might tell you that “secure connection failed”, while the cause is the same.
500 Internal Server Error
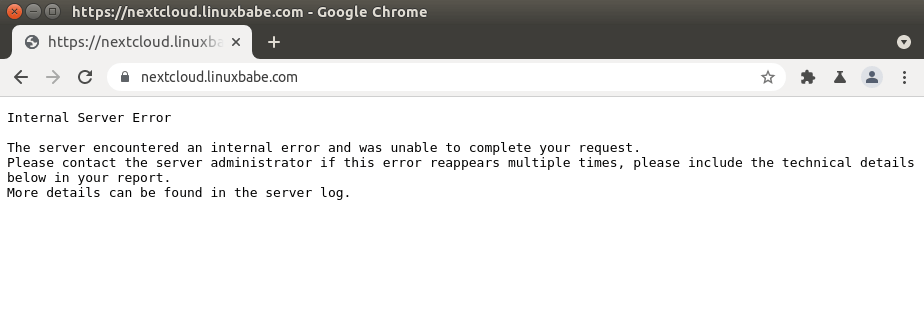
This means there is some error in the web application. It could be that
- The database server is down. Check MySQL/MariaDB status with sudo systemctl status mysql . Start it with sudo systemctl start mysql . Run sudo journalctl -eu mysql to find out why it fails to start. MySQL/MariaDB process could be killed due to out-of-memory issue.
- You didn’t configure Nginx to use PHP-FPM, so Nginx doesn’t know how to execute PHP code.
- If your web application has a built-in cache, you can try flushing the app cache to fix this error.
- Your web application may produce its own error log. Check this log file to debug this error.
- Your web application may have a debugging mode. Turn it on and you will see more detailed error messages on the web page. For example, you can turn on debugging mode in the Modoboa mail server hosting platform by setting DEBUG = True in the /srv/modoboa/instance/instance/settings.py file.
- PHP-FPM could be overloaded. Check your PHP-FPM log (such as /var/log/php7.4-fpm.log ). If you can find the [pool www] seems busy (you may need to increase pm.start_servers, or pm.min/max_spare_servers) warning message, you need to allocate more resources to PHP-FPM.
- Sometimes reloading PHP-FPM ( sudo systemctl reload php7.4-fpm ) can fix the error.
Nginx Shows the default page
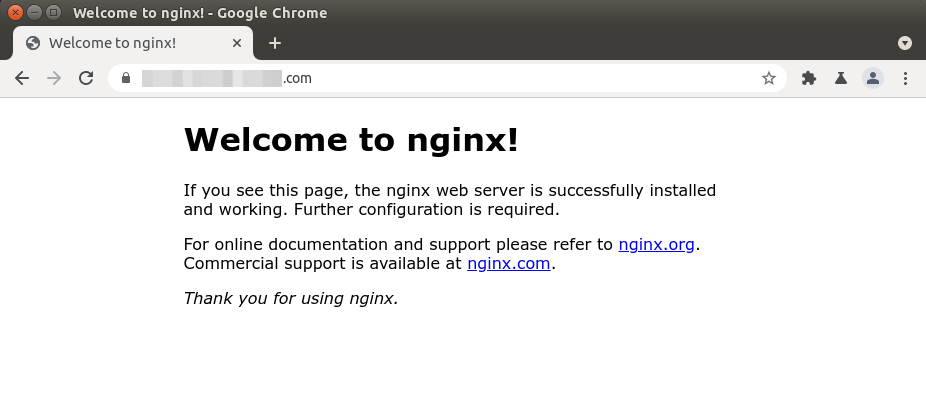
If you try to set up an Nginx virtual host and when you type the domain name in your web browser, the default Nginx page shows up, it might be
- You didn’t use a real domain name for the server_name directive in your Nginx virtual host.
- You forgot to reload Nginx.
The page isn’t redirecting properly
Firefox displays this error as The page isn’t redirecting properly . Google Chrome shows this error as www.example.com redirected you too many times .
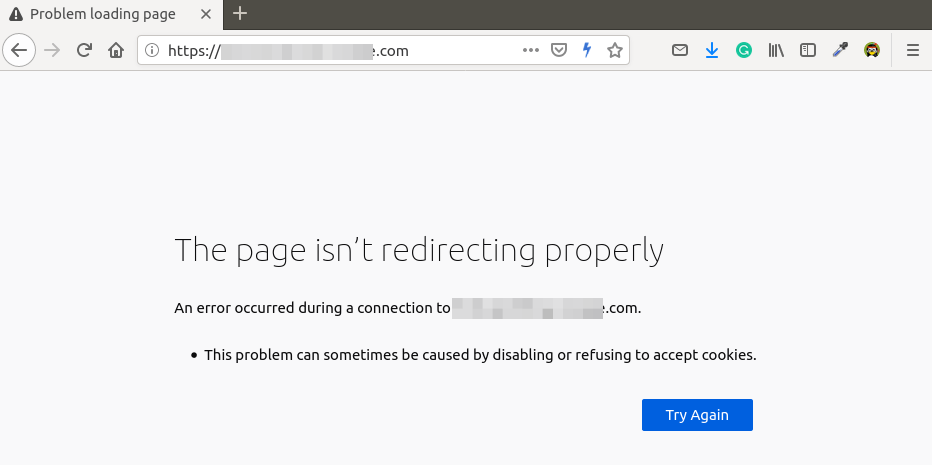
This means you have configured Nginx redirection too many times. For example, you may have added an unnecessary return 301 directive in the https server block to redirect HTTP to HTTPS connection.
If you have set up a page cache such as Nginx FastCGI cache, you need to clear your server page cache.
504 Gateway time-out
This means the upstream like PHP-FPM/MySQL/MariaDB isn’t able to process the request fast enough. You can try restarting PHP-FPM to fix the error temporarily, but it’s better to start tuning PHP-FPM/MySQL/MariaDB for faster performance.
Here is the InnoDB configuration in my /etc/mysql/mariadb.conf.d/50-server.cnf file. This is a very simple performance tunning.
- The InnoDB buffer pool size needs to be at least half of your RAM. ( For VPS with small amount of RAM, I recommend setting the buffer pool size to a smaller value, like 400M, or your VPS would run out of RAM.)
- InnoDB log file size needs to be 25% of the buffer pool size.
- Set the read IO threads and write IO thread to the maximum (64) and
- Make MariaDB use 3 instances of InnoDB buffer pool. The number of instances needs to be the same number of CPU cores on your system.
After saving the changes, restart MariaDB.
You can also set a longer timeout value in Nginx to reduce the chance of gateway timeout. Edit your Nginx virtual host file and add the following lines in the server <. >block.
If you use Nginx with PHP-FPM, then set the fastcgi_read_timeout to a bigger value like 300 seconds. Default is 60 seconds.
Then reload Nginx.
PHP-FPM also has a max execution time for each script. Edit the php.ini file.
You can increase the value to 300 seconds.
Then restart PHP-FPM
Memory Size Exhausted
If you see the following line in your Nginx error log, it means PHP reached the 128MB memory limit.
You can edit the php.ini file ( /etc/php/7.4/fpm/php.ini ) and increase the PHP memory limit.
Then restart PHP7.4-FPM.
If the error still exists, it’s likely there’s bad PHP code in your web application that eats lots of RAM.
PR_END_OF_FILE_ERROR
- You configured Nginx to rediect HTTP request to HTTPS, but there’s no server block in Nginx serving HTTPS request.
- Maybe Nginx isn’t running?
- Sometimes, the main Nginx binary is running, but a worker process can fail and exit due to various reasons. Check the Nginx error log ( /var/log/nginx/error.log ) to debug.
PHP-FPM Upstream Time Out
Some folks can find the following error in Nginx error log file ( under /var/log/nginx/ ).
Resource temporarily unavailable
Some folks can find the following error in Nginx error log file ( under /var/log/nginx/ ).
This usually means your website has lots of visitors and PHP-FPM is unable to process the huge amounts of requests. You can adjust the number of PHP-FPM child process, so it can process more requests.
Edit your PHP-FPM www.conf file. (The file path varies depending on your Linux distribution.)
The default child process config is as follows:
The above configuration means
- PHP-FPM dynamically create child processes. No fixed number of child processes.
- It creates at most 5 child processes.
- Start 2 child processes when PHP-FPM starts.
- There’s at least 1 idle process.
- There’s at most 3 idle process.
The defaults are based on a server without much resources, like a server with only 1GB RAM. If you have a high traffic website, you probabaly want to increase the number of child proceses, so it can serve more requests.
Make sure you have enough RAM to run more child processes. Save and close the file. Then restart PHP-FPM. (You might need to change the version number.)
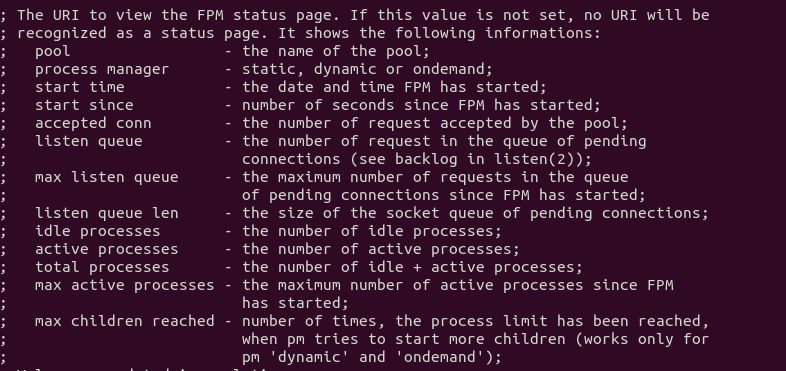
To monitor the health of PHP-FPM, you can enable the status page. Find the following line in the PHP-FPM www.conf file. Note that the following
Remove the semicolon to enable PHP-FPM status page. Then restart PHP-FPM.
Then edit your Nginx virtual host file. Add the following lines. The allow and deny directives are used to restrict access. Only the whitelisted IP addresses can access the status page.
Save and close the file. Then test Nginx configurations.
If the test is successful, reload Nginx for the changes to take effect.
Sample PHP-FPM status page.
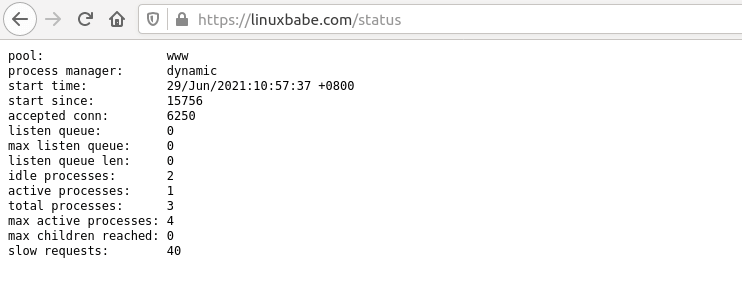
The PHP-FPM www.conf file give you good explanation about what each parameter means.
If PHP-FPM is very busy and unable to serve a request immediately, it will queue this request. By default, there can be at most 511 pending requests, determinted by the listen.backlog parameter.
If you see the following value on the PHP-FPM status page, it means there has never been a request put in the queue, i.e. your PHP-FPM can process requests quickly.
If there are 511 pending requests in the queue, it means your PHP-FPM is very busy, so you should increase the number of child processes.
You may also need to change the Linux kernel net.core.somaxconn setting, which defines max number of connections allowed to a socket file on Linux, such as the PHP-FPM Unix socket file. By default, its value is 128 before kernel 5.4 and 4096 starting with kernel 5.4.
If you run a high traffic website, you can use a big value. Edit /etc/sysctl.conf file.
Add the following two lines.
Save and close the file. Then apply the settings.
Note: If your server has enough RAM, you can allocated a fixed number of child processes for PHP-FPM like below. In my experience, this fixed the 500 internal error for a Joomla + Virtuemart website.
Two Virtual Host file For the Same Website
If you run sudo nginx -t and see the following warning.
It means there are two virtual host files that contain the same server_name configuration. Don’t create two virtual host files for one website.
PHP-FPM Connection reset by peer
Nginx error log file shows the following message.
This may be caused by a restart of PHP-FPM. If it’s retarted manually by yourself, then you can ignore this error.
Nginx Socket Leaks
If you find the following error message in the /var/log/nginx/error.log file, your Nginx has a socket leaks problem.
You can restart the OS to solve this problem. If it doesn’t work, you need to compile a debug version of Nginx, which will show you debug info in the log.
Cloudflare Errors
Here are some common errors and solutions if your website runs behind Cloudflare CDN (Content Delivery Network).
521 Web Server is Down
- Nginx isn’t running.
- You didn’t open TCP ports 80 and 443 in the firewall.
- You changed the server IP address, but forgot to update DNS record in Cloudflare.
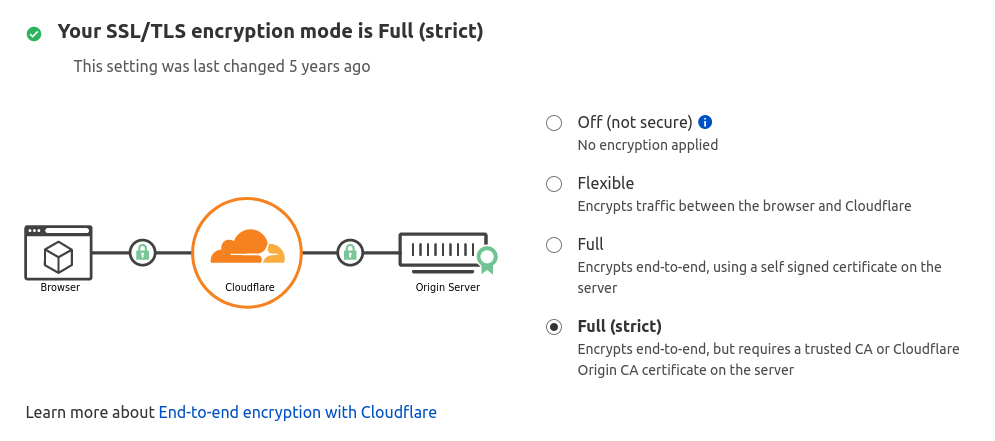
The page isn’t redirecting properly
If your SSL setting on the SSL/TLS app is set to Flexible , but your origin server is configured to redirect HTTP requests to HTTPS, Your Nginx server sends reponse back to Cloudflare in encrypted connection. Since Cloudflare is expecting HTTP traffic, it keeps resending the same request, resulting in a redirect loop. In this case, you need to use the Full (strict) SSL/TLS option in your Cloudflare settings.
Wrapping Up
I hope this article helped you to fix common Nginx web server errors. As always, if you found this post useful, then subscribe to our free newsletter to get more tips and tricks 🙂
Источник


