С некоторого времени на одном из серверов с мониторингом Zabbix начал срабатывать триггер «High memory utilization».
На самом сервере 100 гигов памяти, занято всегда не больше 20. Причем сообщение выходит в нерабочее время, когда сервер по идее вообще не должен быть нагружен. Сервер виндовый, терминальный.
Также не до конца понятно, что означает сам триггер. На вики Заббикса это выражение просто не ищется. Залезла внутрь элемента данных. Ключ vm.memory.util, формула last(«vm.memory.size[used]») / last(«vm.memory.size[total]») * 100.
Судя по логике, используемая память сравнивается с общей, что и говорит о нагрузке сервера. Но дело в том, что сервер в принципе не использует больше 20% памяти.
В логах сервера тоже чисто.
Можете подсказать, в какую сторону копать, что именно смотреть, и, все-таки, о какой нагрузке говорит «High memory utilization»?
Ключ vm.memory.util, формула last(«vm.memory.size[used]») / last(«vm.memory.size[total]») * 100.
Какой-то свой шаблон? Логично спросить у автора
So inactive memory is both used and available simultaneously. Because of this, the vm.memory.size[used] item is designed for informational purposes only, while vm.memory.size[available] is designed to be used in triggers
всегда можно посмотреть график одного item’а чтобы понять, это какой-то сбой в получении данных или памяти действительно мало
и, все-таки, о какой нагрузке говорит «High memory utilization»?
Кто мешает посмотреть код агента?
Причем сообщение выходит в нерабочее время, когда сервер по идее вообще не должен быть нагружен. Сервер виндовый, терминальный.
Кстати, в нерабочее время обычно ставятся обновления
Источник
Zabbix: Мониторинг выборочного процесса (CPU, MEM) с защитой от ложных срабатываний
Как создать универсальный Zabbix шаблон для мониторинга Linux процесса, указанного по имени.
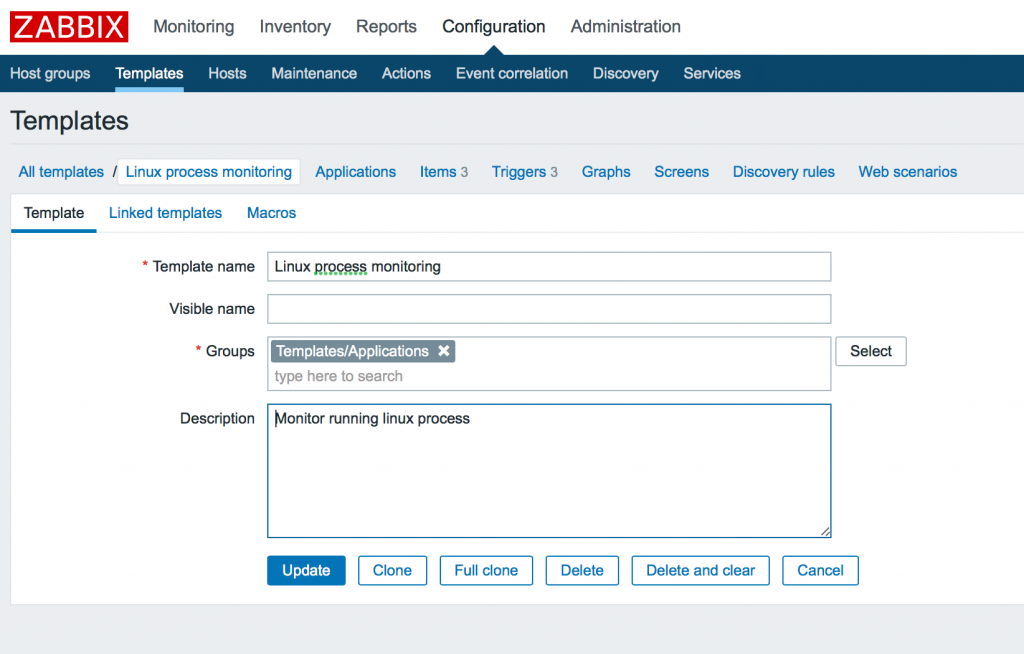
1. Создание нового шаблона Zabbix
Идем в Configuration -> Templates -> Create template и добавляем имя, группу и описание шаблона.
2. Добавление макроса
Мы хотим мониторить 3 параметра:
количество процессов, с уведомлением о том, что процессов стало меньше (упали)
использование памяти, с уведомлением о превышении
использование процессора, с уведомлением о превышении
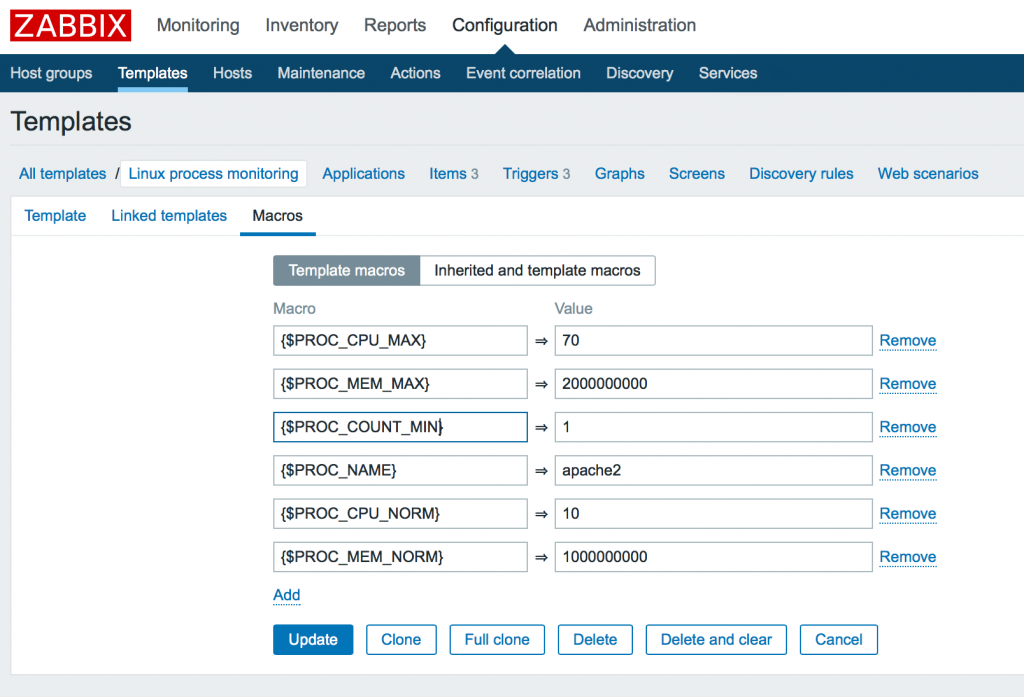
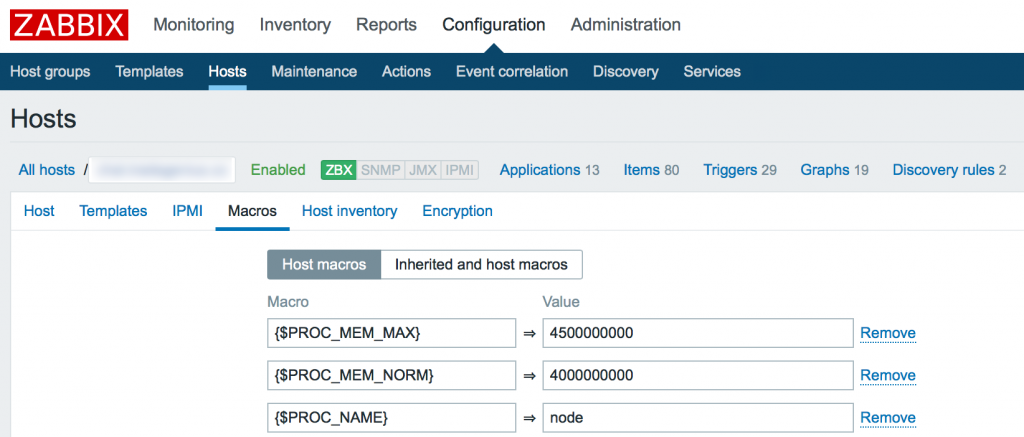
Давайте тут же определим значения по умолчанию. Для этого мы будем использовать макросы шаблона (вкладка Macros), чтобы потом была возможность заменить их для каждого хоста.
В этом примере мы создали 6 макросов.
Тут вы можете увидеть максимально использование cpu 70%, использование памяти 2G, минимально 1 запущенный процесс, а так же имя процесса для примера: apache2. Так же мы должны задать нормальные значения наших параметров для построения гистерезиса в целях защиты от ложных срабатываний (описано ниже). По этому мы так же указываем как 10% и как 1G.
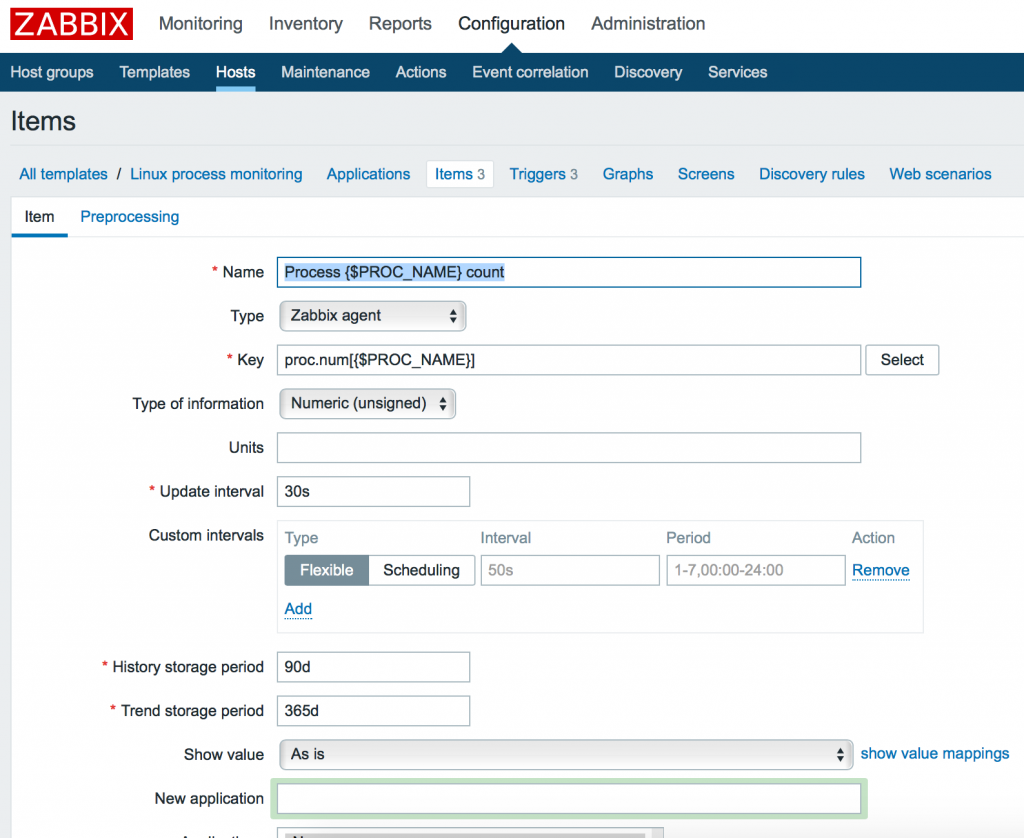
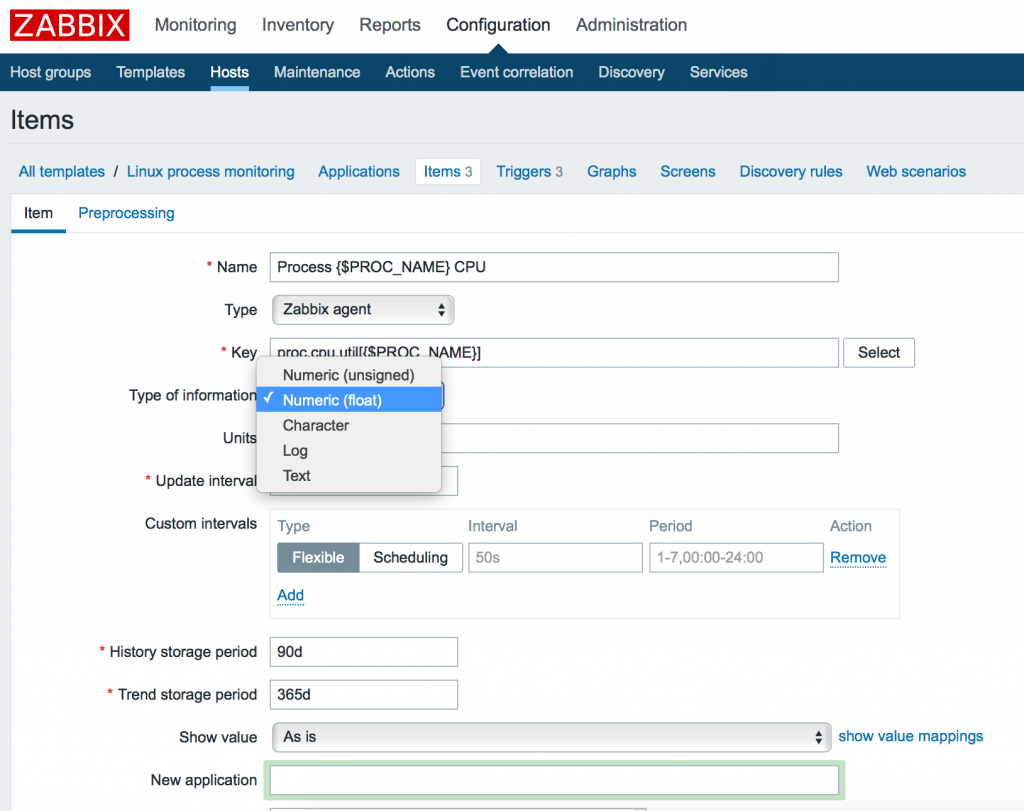
3. Добавление элементов данных
Теперь мы должны добавить элементы входных данных (items). Переходим в меню Items нашего шаблона и кликаем кнопку: Create item. Затем создаем 3 элемента:
количество процессов
использование cpu
использование памяти
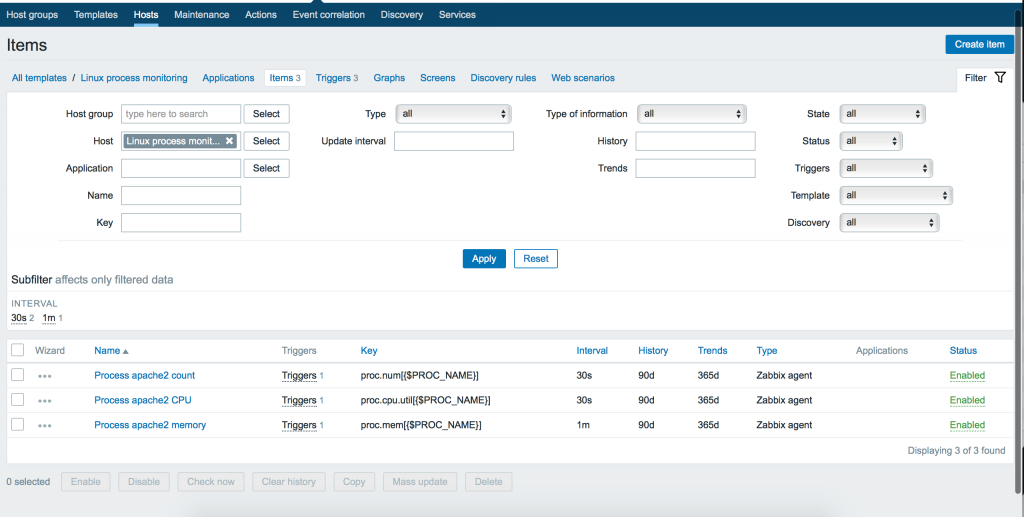
Мы можем использовать как макрос для задания конкретного имени процесса позже внутри конечной конфигурации хоста. Итак, добавляем 3 элемента с 3 ключами:
Заметим, что параметры могут иметь различные типы данных. Так к примеру proc.num, proc.mem имеет тип данных: Numeric (int), а proc.cpu.util – Numeric (float). Вы можете удостовериться в правильности указания типа данных в меню Key -> Select или официальной документации Zabbix.
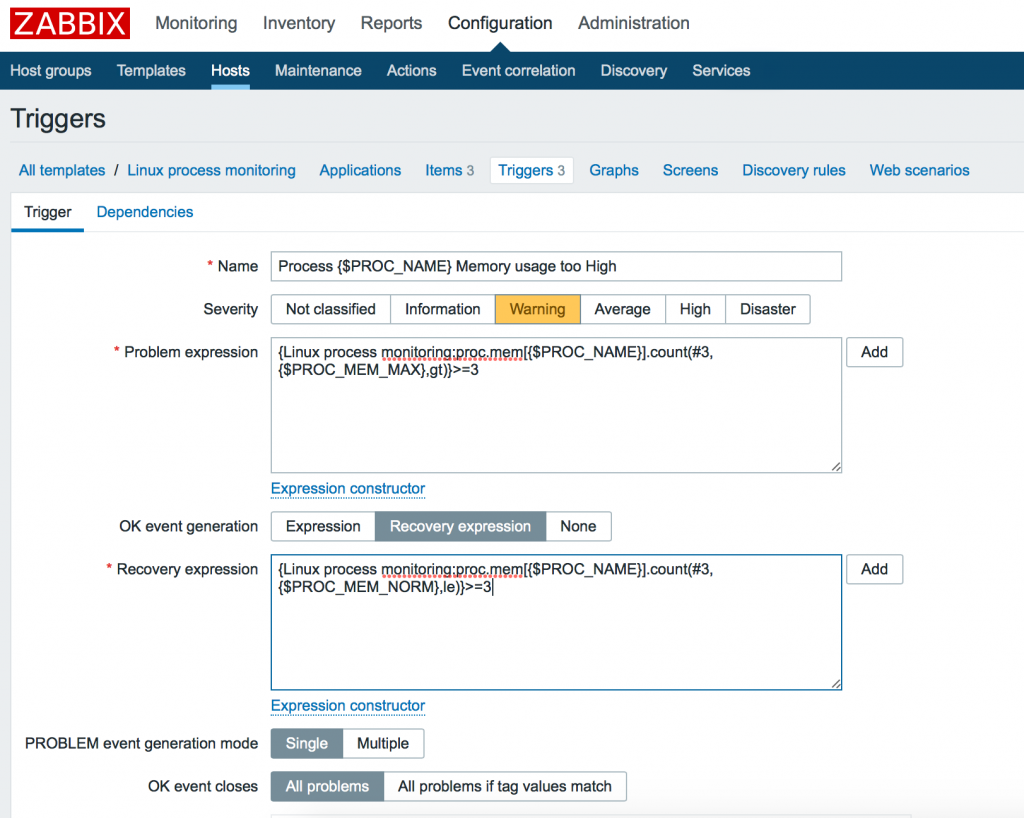
4. Триггеры с гистерезисом
Пришло время создать тригеры. Переходим в закладку Triggers нашего шаблона. Вы можете использовать встроенный конструктор выражений, нажав Problem expression -> Add, затем выбрав item и function. К примеру last (most recent) T value. Но это только одно последнее значение. Оно будет меняться каждый раз, что вызовет нестабильность в определении статуса. Чтобы определить жесткое (установившееся) значение статуса, это значение должно повториться несколько раз подряд. Для такого подсчета лучше использовать функцию count. Болле подробную информацию о функциях вы можете получить в официальной документации Zabbix.
Итак, создаем триггер, который будет срабатывать при привышении потребления памяти больше чем <$PROC_MEM_MAX>3 раза подряд.
Мы можем прочитать его так: “Количество (count) последних 3 значений (#3), которые были больше (gt) чем равно >= 3″. Что означает, что все последние 3 значения были были больше чем PROC_MEM_MAX. Это хороший способ определения устоявшегося значения.
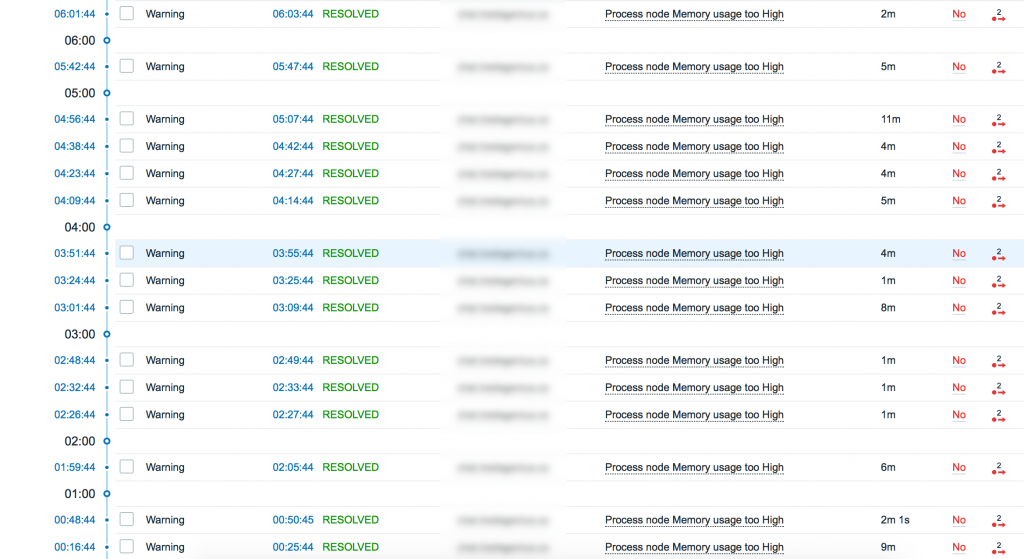
Но что делать с возвратом в нормальное состояние? Если мы просто оставим так как есть, мы рискуем получить что-то на подобие этого:
Каждые 5-10 минут статус меняет значение, колеблясь то выше, то ниже указанного порога. Он получает 3 подряд превышающих значения и триггер срабатывает, после чего он получает 3 нормальных значения и помечает проблему как RESOLVED (решена)! Что же делать? Нам поможет гистерезис с указанием не только максимального, но и нормального значения. Триггер будет в состоянии PROBLEM (проблема) до тех пор, пока значение нашего элемента не опустится до $.
Итак, нажимаем OK event generation -> Recovery expression и добавляем выражение:
Его можно прочитать как: “Количество (count) последних трех (#3) значений элемента, которые были меньше или равны (le) числу было >= 3 раз. То есть установившееся в нормальном положении значение.
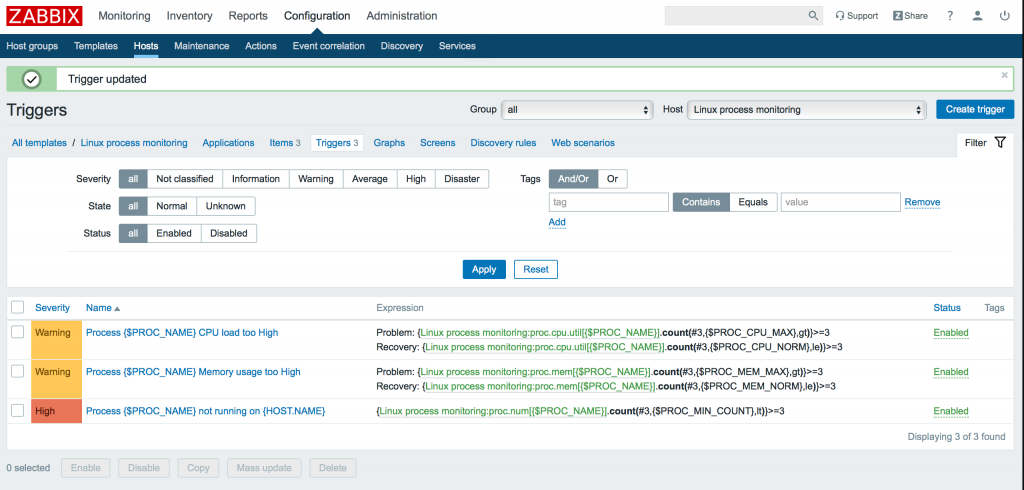
Подобным образом добавляем остальные тригеры (для использования процессора и количества процессов):
5. Конфигурация хоста
Теперь мы можем добавить наш шаблон к хосту. Идем в Configuration -> Hosts -> ваш сервер -> Templates. И добавляем только что созданный шаблон к серверу. Далее мы должны переопределись макросы.
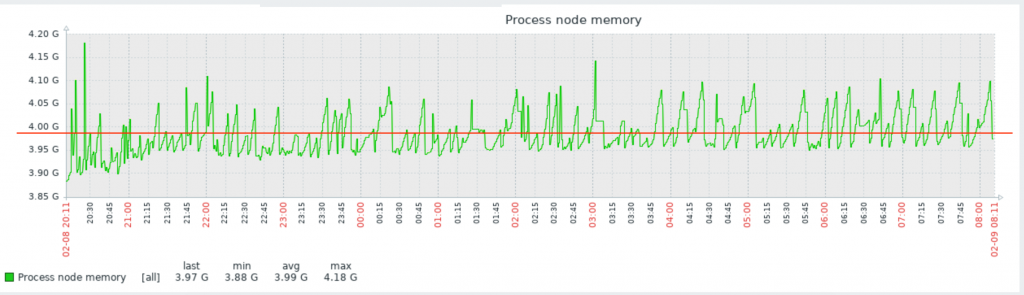
Для примера на нашем сервере необходимо мониторить процесс node (node.js). Давайте посмотрим один из моих графиков данного процесса:
Вы видите, что у меня он потребляет порядка 4Gb RAM. Это нормальное состояние для моего сервиса. Так же вы видите колебание в районе красной линии. Без гистерезиса Zabbix нас просто заспамил бы сообщениями об изменении статуса в районе этой линии. В моем примере нормальное значение потребления памяти для указания в гистерезисе это 4G, а максимальное – больше чем 4.20G, пусть будет 4,5G. Добавим эти значения, а так же имя нашего процесса как макросы для данного хоста:
Итак, мой триггер перейдет в состоянии PROBLEM только когда значение потребляемой памяти будет больше чем 4,5Gb 3 раза подряд. А вернется он в нормальное состояние только тогда, когда потребление снизится ниже 4Г 3 раза подряд.
Готово! Позравляю! Теперь можно проверить последние данные в разделе Monitoring -> Latest data.
Источник
Memory usage linux zabbix
Toolkit to enable effective monitoring with Zabbix use of memory by individual users.
There is the ansible role, which configures Zabbix agent for monitoring memory. As well as a script that creates a Zabbix graph using a low level discovered items.
To use this software do you need Zabbix server and least one Zabbix agent running. You must have administrative privileges to make changes in the configuration of these tools.
To run the project, use the Ansible role to install script /ansible_role/templates/zabbix_memory.py and provide linux_memory.rss[*] and linux_memory.discovery_user user parameter in Zabbix Agent.
You can use for that following playbook:
Next to import /zbx_export_templates.xml in Zabbix server and use fresh Template memory usage template in some server.
ID of prototype item rule by Configuration-> Hosts -> some.host.example.com -> Discovery rules -> Discovery system users and lookup URL,
ID of host by Configuration -> Host -> some.host.example.com and lookup URL.
After collection some data use zabbix-discovered-chart.py to add chart by execution eg. python zabbix-discovered-chart.py **URL** **LOGIN** **PASS** **ITEMID** **HOSTID** .
After all new diagram of name «Memory usage graph» should occurs in Zabbix server. See zabbix-discovered-chart.py —help for details.
Add additional notes about how to deploy this on a live system
This project is licensed under the MIT License — see the LICENSE.md file for details
About
Toolkit to enable effective monitoring with Zabbix use of memory by individual users.
Источник
Zabbix: Difference between «memory usage» and «memory utilization»
I recently started using Zabbix for monitoring, and there is a question I can’t figure out on my own. 🙂 Is «memory usage» kind of inverse function of the «memory utilization»? I have high percentage of the «utilization» and low count on the «usage».
Thanks in advance.
1 Answer 1
Memory usage or utilization etc. are probably item names. You should look into the Template your are using and locate the corresponding key to understand the value.
For instance, in my Zabbix Server 4.4 the Template Module Linux memory by Zabbix agent template has a Memory utilization item with this key: vm.memory.size[pavailable]
pavailable — ‘available’ memory as percentage of ‘total’ (calculated as available/total*100)
Depending on the parameter key, you can extract various memory informations:
Parameters The following parameters are available for this item:
active — memory currently in use or very recently used, and so it is in RAM
anon — memory not associated with a file (cannot be re-read from it)
available — available memory, calculated differently depending on the platform (see the table below)
buffers — cache for things like file system metadata
cached — cache for various things
See which one are you using and maybe try to implement additional items with these parameters to have a first hand experience.
Источник
Memory usage linux zabbix
Linux CPU by Zabbix agent
For Zabbix version: 5.4 and higher
Refer to the vendor documentation.
No specific Zabbix configuration is required.
Load per CPU considered sustainable. Tune if needed.
The time the CPU has spent running the kernel and its processes.
ZABBIX_PASSIVE
system.cpu.util[,system]
CPU
CPU user time
The time the CPU has spent running users’ processes that are not niced.
ZABBIX_PASSIVE
system.cpu.util[,user]
CPU
CPU nice time
The time the CPU has spent running users’ processes that have been niced.
ZABBIX_PASSIVE
system.cpu.util[,nice]
CPU
CPU iowait time
Amount of time the CPU has been waiting for I/O to complete.
ZABBIX_PASSIVE
system.cpu.util[,iowait]
CPU
CPU steal time
The amount of CPU ‘stolen’ from this virtual machine by the hypervisor for other tasks (such as running another virtual machine).
ZABBIX_PASSIVE
system.cpu.util[,steal]
CPU
CPU interrupt time
The amount of time the CPU has been servicing hardware interrupts.
ZABBIX_PASSIVE
system.cpu.util[,interrupt]
CPU
CPU softirq time
The amount of time the CPU has been servicing software interrupts.
ZABBIX_PASSIVE
system.cpu.util[,softirq]
CPU
CPU guest time
Guest time (time spent running a virtual CPU for a guest operating system)
ZABBIX_PASSIVE
system.cpu.util[,guest]
CPU
CPU guest nice time
Time spent running a niced guest (virtual CPU for guest operating systems under the control of the Linux kernel)
ZABBIX_PASSIVE
system.cpu.util[,guest_nice]
CPU
Context switches per second
ZABBIX_PASSIVE
system.cpu.switches
Preprocessing:
ZABBIX_PASSIVE
system.cpu.intr
Preprocessing:
Name
Description
Expression
Severity
Dependencies and additional info
Load average is too high (per CPU load over <$LOAD_AVG_PER_CPU.MAX.WARN>for 5m)
Per CPU load average is too high. Your system may be slow to respond.
/> <$LOAD_AVG_PER_CPU.MAX.WARN>and >0 and >0
AVERAGE
High CPU utilization (over <$CPU.UTIL.CRIT>% for 5m)
CPU utilization is too high. The system might be slow to respond.
Depends on:
— Load average is too high (per CPU load over <$LOAD_AVG_PER_CPU.MAX.WARN>for 5m)
Please report any issues with the template at https://support.zabbix.com
Linux filesystems by Zabbix agent
For Zabbix version: 5.4 and higher
Refer to the vendor documentation.
No specific Zabbix configuration is required.
This macro is used in filesystems discovery. Can be overridden on the host or linked template level
This macro is used in filesystems discovery. Can be overridden on the host or linked template level
This macro is used in filesystems discovery. Can be overridden on the host or linked template level
This macro is used in filesystems discovery. Can be overridden on the host or linked template level
There are no template links in this template.
Name
Description
Type
Key and additional info
Mounted filesystem discovery
Discovery of file systems of different types.
ZABBIX_PASSIVE
vfs.fs.discovery
Filter:
Group
Name
Description
Type
Key and additional info
Filesystems
<#FSNAME>: Used space
Used storage in Bytes
ZABBIX_PASSIVE
vfs.fs.size[<#FSNAME>,used]
Filesystems
<#FSNAME>: Total space
Total space in Bytes
ZABBIX_PASSIVE
vfs.fs.size[<#FSNAME>,total]
Filesystems
<#FSNAME>: Space utilization
Space utilization in % for
ZABBIX_PASSIVE
vfs.fs.size[<#FSNAME>,pused]
Filesystems
<#FSNAME>: Free inodes in %
ZABBIX_PASSIVE
vfs.fs.inode[<#FSNAME>,pfree]
Name
Description
Expression
Severity
Dependencies and additional info
<#FSNAME>: Disk space is critically low (used > <$VFS.FS.PUSED.MAX.CRIT:"<#FSNAME>«>%)
Two conditions should match: First, space utilization should be above <$VFS.FS.PUSED.MAX.CRIT:"<#FSNAME>«>.
Second condition should be one of the following:
— The disk free space is less than 5G.
— The disk will be full in less than 24 hours.
,pused].last()>><$VFS.FS.PUSED.MAX.CRIT:"<#FSNAME>«> and ((,total].last()>-,used].last()>)
AVERAGE
Manual close: YES
Two conditions should match: First, space utilization should be above <$VFS.FS.PUSED.MAX.WARN:"<#FSNAME>«>.
Second condition should be one of the following:
— The disk free space is less than 10G.
— The disk will be full in less than 24 hours.
,pused].last()>><$VFS.FS.PUSED.MAX.WARN:"<#FSNAME>«> and ((,total].last()>-,used].last()>)
WARNING
Manual close: YES
Depends on:
<#FSNAME>: Running out of free inodes (free ,pfree].min(5m)>
AVERAGE
<#FSNAME>: Running out of free inodes (free ,pfree].min(5m)>
WARNING
Depends on:
— <#FSNAME>: Running out of free inodes (free
Please report any issues with the template at https://support.zabbix.com
Linux memory by Zabbix agent
For Zabbix version: 5.4 and higher
Refer to the vendor documentation.
No specific Zabbix configuration is required.
This macro is used as a threshold in memory available trigger.
This macro is used as a threshold in memory utilization trigger.
There are no template links in this template.
Group
Name
Description
Type
Key and additional info
Memory
Memory utilization
Memory used percentage is calculated as (100-pavailable)
DEPENDENT
vm.memory.utilization
Preprocessing:
— JAVASCRIPT: return (100-value);
ZABBIX_PASSIVE
vm.memory.size[pavailable]
Memory
Total memory
Total memory in Bytes
ZABBIX_PASSIVE
vm.memory.size[total]
Memory
Available memory
Available memory, in Linux, available = free + buffers + cache. On other platforms calculation may vary. See also: https://www.zabbix.com/documentation/6.0/manual/appendix/items/vm.memory.size_params
ZABBIX_PASSIVE
vm.memory.size[available]
Memory
Total swap space
The total space of swap volume/file in bytes.
ZABBIX_PASSIVE
system.swap.size[,total]
Memory
Free swap space
The free space of swap volume/file in bytes.
ZABBIX_PASSIVE
system.swap.size[,free]
Memory
Free swap space in %
The free space of swap volume/file in percent.
ZABBIX_PASSIVE
system.swap.size[,pfree]
Name
Description
Expression
Severity
Dependencies and additional info
High memory utilization (><$MEMORY.UTIL.MAX>% for 5m)
The system is running out of free memory.
Depends on:
— Lack of available memory ( 0
AVERAGE
High swap space usage (less than <$SWAP.PFREE.MIN.WARN>% free)
This trigger is ignored, if there is no swap configured
Depends on:
— High memory utilization (><$MEMORY.UTIL.MAX>% for 5m)
— Lack of available memory (
Please report any issues with the template at https://support.zabbix.com
Linux block devices by Zabbix agent
For Zabbix version: 5.4 and higher
Refer to the vendor documentation.
No specific Zabbix configuration is required.
This macro is used in block devices discovery. Can be overridden on the host or linked template level
This macro is used in block devices discovery. Can be overridden on the host or linked template level
Disk read average response time (in ms) before the trigger would fire
Disk write average response time (in ms) before the trigger would fire
There are no template links in this template.
Name
Description
Type
Key and additional info
Block devices discovery
ZABBIX_PASSIVE
vfs.dev.discovery
Preprocessing:
Filter:
— A: <#DEVTYPE>MATCHES_REGEX disk
Group
Name
Description
Type
Key and additional info
Storage
<#DEVNAME>: Disk read rate
r/s. The number (after merges) of read requests completed per second for the device.
DEPENDENT
vfs.dev.read.rate[<#DEVNAME>]
Preprocessing:
w/s. The number (after merges) of write requests completed per second for the device.
DEPENDENT
vfs.dev.write.rate[<#DEVNAME>]
Preprocessing:
Storage
<#DEVNAME>: Disk read request avg waiting time (r_await)
This formula contains two boolean expressions that evaluates to 1 or 0 in order to set calculated metric to zero and to avoid division by zero exception.
<#DEVNAME>: Disk write request avg waiting time (w_await)
This formula contains two boolean expressions that evaluates to 1 or 0 in order to set calculated metric to zero and to avoid division by zero exception.
Rate of total read time counter. Used in r_await calculation
DEPENDENT
vfs.dev.read.time.rate[<#DEVNAME>]
Preprocessing:
Zabbix_raw_items
<#DEVNAME>: Disk write time (rate)
Rate of total write time counter. Used in w_await calculation
DEPENDENT
vfs.dev.write.time.rate[<#DEVNAME>]
Preprocessing:
Name
Description
Expression
Severity
Dependencies and additional info
<#DEVNAME>: Disk read/write request responses are too high (read > <$VFS.DEV.READ.AWAIT.WARN:"<#DEVNAME>«> ms for 15m or write > <$VFS.DEV.WRITE.AWAIT.WARN:"<#DEVNAME>«> ms for 15m)
This trigger might indicate disk <#DEVNAME>saturation.
Manual close: YES
Please report any issues with the template at https://support.zabbix.com
Linux network interfaces by Zabbix agent
For Zabbix version: 5.4 and higher
Refer to the vendor documentation.
No specific Zabbix configuration is required.
Filter out loopbacks, nulls, docker veth links and docker0 bridge by default
`(^Software Loopback Interface
There are no template links in this template.
Name
Description
Type
Key and additional info
Network interface discovery
Discovery of network interfaces.
ZABBIX_PASSIVE
net.if.discovery
Filter:
Group
Name
Description
Type
Key and additional info
Network_interfaces
Interface <#IFNAME>: Bits received
ZABBIX_PASSIVE
net.if.in[«<#IFNAME>«]
Preprocessing:
Network_interfaces
Interface <#IFNAME>: Bits sent
ZABBIX_PASSIVE
net.if.out[«<#IFNAME>«]
Preprocessing:
Network_interfaces
Interface <#IFNAME>: Outbound packets with errors
ZABBIX_PASSIVE
net.if.out[«<#IFNAME>«,errors]
Preprocessing:
Network_interfaces
Interface <#IFNAME>: Inbound packets with errors
ZABBIX_PASSIVE
net.if.in[«<#IFNAME>«,errors]
Preprocessing:
Network_interfaces
Interface <#IFNAME>: Outbound packets discarded
ZABBIX_PASSIVE
net.if.out[«<#IFNAME>«,dropped]
Preprocessing:
Network_interfaces
Interface <#IFNAME>: Inbound packets discarded
ZABBIX_PASSIVE
net.if.in[«<#IFNAME>«,dropped]
Preprocessing:
Network_interfaces
Interface <#IFNAME>: Operational status
Indicates the interface RFC2863 operational state as a string.
Possible values are:»unknown», «notpresent», «down», «lowerlayerdown», «testing»,»dormant», «up».
Interface <#IFNAME>: High error rate (> <$IF.ERRORS.WARN:"<#IFNAME>«> for 5m)
Recovers when below 80% of <$IF.ERRORS.WARN:"<#IFNAME>«> threshold
«,errors].min(5m)>><$IF.ERRORS.WARN:"<#IFNAME>«> or «,errors].min(5m)>><$IF.ERRORS.WARN:"<#IFNAME>«>
«,errors].max(5m)>
WARNING
Manual close: YES
Depends on:
— Interface <#IFNAME>: Link down
This trigger expression works as follows:
1. Can be triggered if operations status is down.
2. <$IFCONTROL:"<#IFNAME>«>=1 — user can redefine Context macro to value — 0. That marks this interface as not important. No new trigger will be fired if this interface is down.
3. =1) — trigger fires only if operational status was up(1) sometime before. (So, do not fire ‘ethernal off’ interfaces.)
WARNING: if closed manually — won’t fire again on next poll, because of .diff.
<$IFCONTROL:"<#IFNAME>«>=1 and (/operstate»].last()>=2 and /operstate»].diff()>=1)
/operstate»].last()><>2 or <$IFCONTROL:"<#IFNAME>«>=0
AVERAGE
Manual close: YES
Interface <#IFNAME>: Ethernet has changed to lower speed than it was before
This Ethernet connection has transitioned down from its known maximum speed. This might be a sign of autonegotiation issues. Ack to close.
/type»].change()> 0 and (/type»].last()>=6 or /type»].last()>=1) and (/operstate»].last()><>2)
(/type»].change()>>0 and /type»].prev()>>0) or (/operstate»].last()>=2)
INFO
Manual close: YES
Depends on:
— Interface <#IFNAME>: Link down
Please report any issues with the template at https://support.zabbix.com
Description: High interface utilization trigger is removed since currently it is not possible to retrieve interface speed to determine the max bandwidth.
Linux generic by Zabbix agent
For Zabbix version: 5.4 and higher
Refer to the vendor documentation.
No specific Zabbix configuration is required.
There are no template links in this template.
Group
Name
Description
Type
Key and additional info
General
System boot time
ZABBIX_PASSIVE
system.boottime
Preprocessing:
System local time of the host.
ZABBIX_PASSIVE
system.localtime
General
System name
System host name.
ZABBIX_PASSIVE
system.hostname
Preprocessing:
The information as normally returned by ‘uname -a’.
ZABBIX_PASSIVE
system.uname
Preprocessing:
General
Number of logged in users
Number of users who are currently logged in.
ZABBIX_PASSIVE
system.users.num
General
Maximum number of open file descriptors
It could be increased by using sysctrl utility or modifying file /etc/sysctl.conf.
ZABBIX_PASSIVE
kernel.maxfiles
Preprocessing:
General
Maximum number of processes
It could be increased by using sysctrl utility or modifying file /etc/sysctl.conf.
ZABBIX_PASSIVE
kernel.maxproc
Preprocessing:
ZABBIX_PASSIVE
proc.num
General
Number of running processes
ZABBIX_PASSIVE
proc.num[,,run]
Inventory
Operating system
ZABBIX_PASSIVE
system.sw.os
Preprocessing:
Inventory
Operating system architecture
Operating system architecture of the host.
ZABBIX_PASSIVE
system.sw.arch
Preprocessing:
ZABBIX_PASSIVE
system.sw.packages
Preprocessing:
Security
Checksum of /etc/passwd
ZABBIX_PASSIVE
vfs.file.cksum[/etc/passwd,sha256]
Preprocessing:
System uptime in ‘N days, hh:mm:ss’ format.
ZABBIX_PASSIVE
system.uptime
Name
Description
Expression
Severity
Dependencies and additional info
System time is out of sync (diff with Zabbix server > <$SYSTEM.FUZZYTIME.MAX>s)
The host system time is different from the Zabbix server time.
Manual close: YES
System name has changed (new name: )
System name has changed. Ack to close.
Manual close: YES
Configured max number of open filedescriptors is too low (
INFO
Configured max number of processes is too low (
INFO
Depends on:
— Getting closer to process limit (over 80% used)
Getting closer to process limit (over 80% used)
/*100>80
WARNING
Operating system description has changed
Operating system description has changed. Possible reasons that system has been updated or replaced. Ack to close.
Manual close: YES
Depends on:
— System name has changed (new name: )
Manual close: YES
Depends on:
— Operating system description has changed
— System name has changed (new name: )
has been restarted (uptime
WARNING
Manual close: YES
Please report any issues with the template at https://support.zabbix.com
Linux by Zabbix agent
For Zabbix version: 5.4 and higher New official Linux template. Requires agent of Zabbix 3.0.14, 3.4.5 and 4.0.0 or newer.
Install Zabbix agent on Linux OS according to Zabbix documentation.
No specific Zabbix configuration is required.
Name
Linux CPU by Zabbix agent
Linux block devices by Zabbix agent
Linux filesystems by Zabbix agent
Linux generic by Zabbix agent
Linux memory by Zabbix agent
Linux network interfaces by Zabbix agent
Zabbix agent
Group
Name
Description
Type
Key and additional info
Name
Description
Expression
Severity
Dependencies and additional info
Please report any issues with the template at https://support.zabbix.com
You can also provide a feedback, discuss the template or ask for help with it at ZABBIX forums.
Description: Network discovery. Zabbix agent as of 4.2 doesn’t support items such as net.if.status, net.if.speed.
You can’t perform that action at this time.
You signed in with another tab or window. Reload to refresh your session. You signed out in another tab or window. Reload to refresh your session.