- How to enable logging in WDS in Windows
- Introduction
- Overview
- General WDS server health
- WDS server component
- Obtain trace logs for Windows Server
- WDS management components
- Enable tracing
- For the management component
- For the MMC component
- WDS legacy components
- WDS client components
- Setup logs from the client computer
- Enable Windows Installer logging
- Windows Installer logging
- Enable Windows Installer logging manually
- Enable Windows Installer logging with Group Policies
- Вертим логи как хотим ― анализ журналов в системах Windows
- Журналы и командная строка
- Работаем с журналами посредством запросов SQL
How to enable logging in WDS in Windows
This article describes how to enable logging in Windows Deployment Services (WDS) in Windows Server.
Original product version: В Windows Server 2012 R2
Original KB number: В 936625
This article contains information about how to modify the registry. Make sure that you back up the registry before you modify it. Make sure that you know how to restore the registry if a problem occurs. For more information about how to back up, restore, and modify the registry, see Windows registry information for advanced users.
Introduction
This article discusses how to enable logging in WDS in Windows Server. Additionally, this article describes how to gather data in WDS.
You can use this information to help troubleshoot issues that you may experience in WDS.
Overview
Serious problems might occur if you modify the registry incorrectly by using Registry Editor or by using another method. These problems might require that you reinstall the operating system. Microsoft cannot guarantee that these problems can be solved. Modify the registry at your own risk.
Each WDS component has a mechanism that you can enable for logging and for tracing. You can then analyze the results for troubleshooting. Use the information in the following sections to enable logging and tracing for WDS components.
General WDS server health
Type the following command to generate general server health information:
This command causes general server health information to be logged in the Application log and in the System log.
WDS server component
Type the following command to generate health information about the WDS server component:
This command causes WDS information to be logged in the Application log and in the System log.
Obtain trace logs for Windows Server
To obtain trace information for Windows Server, do the following:
- Open Event Viewer (eventvwr).
- Browse to Windows Logs\Applications and Services Logs\Microsoft\Windows\Deployment-Services-Diagnostics.
- Right-click the channel and choose Enable Log.
Then, configure the components that you want to be logged by setting one or more of the following registry keys to a 0 value.
WDS servers also support the following additional tracing:
You can set these registry keys to the following values to control what is included:
- 7F0000: This value includes packet tracing and protocol tracing.
- 3F0000: This value excludes packet tracing.
- 3E0000: This value excludes packet tracing and protocol tracing. By default, this value is used.
A tracing process may affect performance. Therefore, we recommend that you disable the tracing functionality when you do not have to generate a log.
After you set this registry entry, trace information for the WDS server component is logged in the following file:%windir%\Tracing\wdsserver.log
WDS management components
Type the following command to generate management component health information:
This command causes WDS component health information to be logged in the Application log and in the System log.
Enable tracing
To obtain trace information, you must enable tracing in the WDS management component and in the WDS Microsoft Management Console (MMC) component. To do this, set the following registry entries:
For the management component
- Path: HKEY_LOCAL_MACHINE\SOFTWARE\Microsoft\Tracing\WDSMGMT
- Name: EnableFileTracing
- Value type: REG_DWORD
- Value data: 1
For the MMC component
- Path: HKEY_LOCAL_MACHINE\SOFTWARE\Microsoft\Tracing\WDSMMC
- Name: EnableFileTracing
- Value type: REG_DWORD
- Value data: 1
After you set these registry entries, trace information for the WDS management component is logged in the %windir%\Tracing\wdsmgmt.log file.
Additionally, trace information for the WDS MMC component is logged in the %windir%\Tracing\wdsmmc.log file.
Although the WDS MMC component and the WDSUTIL component share the same API layer, MMC sometimes adds processing and functionality. If an error occurs, it is frequently worthwhile to use WDSUTIL to try to reproduce the failure. WDSUTIL may help you determine whether the error is local to MMC or whether the error is a general management API failure. Frequently, the WDSUTIL component provides more detailed error output when tracing is not enabled. Where applicable, use the following options to obtain extra information:
WDS legacy components
If you perform legacy management functions, set the following registry entry to enable tracing in the RISetup component:
- Path: HKEY_LOCAL_MACHINE\SOFTWARE\Microsoft\Tracing\RISetup
- Name: EnableFileTracing
- Value type: REG_DWORD
- Value data: 1
To obtain the trace log in the WDSCapture operation, follow these steps:
Start the Capture Windows PE boot image.
When the Capture Wizard starts, press SHIFT+F10 to open a command prompt.
Enable tracing in the WDSCapture component. To do this, follow these steps:
- Start Registry Editor.
- Set the following registry entry to enable tracing in the WDSCapture component:
- Path: HKEY_LOCAL_MACHINE\SOFTWARE\Microsoft\Tracing\WDSCapture
- Name: EnableFileTracing
- Value type: REG_DWORD
- Value data: 1
Start a second instance of the WDSCapture component. Then, reproduce the problem by using the second instance of WDSCapture.
Don’t close the original instance of WDSCapture. If you close the original instance of WDSCapture, Windows PE restarts. Instead, press ALT+TAB to switch between the instances of WDSCapture.The following trace log file is generated: X:\Windows\Tracing\WDSCapture.log.
WDS client components
To turn on the client logging functionality, run the following command on the WDS server:
Then, run the following command on the WDS server to change which events are logged:
Each category includes all the events from the previous categories.
The following are the definitions of the logging levels:
- The NONE logging level disables the logging functionality. By default, this logging level is used.
- The ERRORS logging level logs only errors.
- The WARNINGS logging level logs warnings and errors.
- The INFO logging level logs errors, warnings, and informational events. This logging level is the highest logging level.
To view the event logs, follow these steps:
- Open Server Manager, and then click Diagnostics.
- Click Event Viewer.
- Click Applications and Services Logs.
- Click Microsoft, click Windows, and then click Deployment-Services-Diagnostics.
In the tree structure of event logs, the Admin log contains all the errors, and the Operational log contains the information messages. The following are the definitions of the architectures that are listed for some errors in these logs:
- The Architecture 0 is the x86 processor architecture.
- The Architecture 6 is the IA-64 processor architecture.
- The Architecture 9 is the x64 processor architecture.
Setup logs from the client computer
The location of the setup logs depends on when the failure occurs.
If the failure occurs in Windows PE before the disk configuration page of the WDS client is completed, you can find the logs at the X:\Windows\Panther folder. Use Shift+F10 to open a command prompt, and then change the directory to the location.
If the failure occurs in Windows PE after the disk configuration page of the WDS client is completed, you can find the logs on the local disk volume at the $Windows.
BT\Sources\Panther folder. The local disk volume is usually the drive C. Use Shift+F10 to open a command prompt, and then change the directory to the location.
If the failure occurs on the first boot after the image is applied, you can find the logs in the \Windows\Panther folder of the local disk volume. The local disk volume is usually the drive C.
Enable Windows Installer logging
Windows includes a registry-activated logging service to help diagnose Windows Installer issues. This article describes how to enable this logging service.
Original product version: В Windows 10 — all editions, Windows Server 2012 R2
Original KB number: В 223300
The registry entry in this article is valid for all Windows operating systems.
Windows Installer logging
Windows Installer can use logging to help assist in troubleshooting issues with installing software packages. This logging is enabled by adding keys and values to the registry. After the entries have been added and enabled, you can retry the problem installation and Windows Installer will track the progress and post it to the Temp folder. The new log’s file name is random. However, the first letters are Msi and the file name has a .log extension. To locate the Temp folder, type the following line at a command prompt:
To enable Windows Installer logging manually, see the following section.
Enable Windows Installer logging manually
This section, method, or task contains steps that tell you how to modify the registry. However, serious problems might occur if you modify the registry incorrectly. Therefore, make sure that you follow these steps carefully. For added protection, back up the registry before you modify it. Then, you can restore the registry if a problem occurs. For more information about how to back up and restore the registry, see How to back up and restore the registry in Windows.
To enable Windows Installer logging yourself, open the registry by using Regedit.exe, and then create the following subkey and keys:
- Path: HKEY_LOCAL_MACHINE\Software\Policies\Microsoft\Windows\Installer
- Type: Reg_SZ
- Value: Logging
- Data: voicewarmupx
The letters in the value field can be in any order. Each letter turns on a different logging mode. Each letter’s actual function is as follows for MSI version 1.1:
- v — Verbose output
- o — Out-of-disk-space messages
- i — Status messages
- c — Initial UI parameters
- e — All error messages
- w — Non-fatal warnings
- a — Start up of actions
- r — Action-specific records
- m — Out-of-memory or fatal exit information
- u — User requests
- p — Terminal properties
- + — Append to existing file
- ! — Flush each line to the log
- x — Extra debugging information. The x flag is available only in Windows Server 2003 and later operating systems, and on the MSI redistributable version 3.0, and on later versions of the MSI redistributable.
- * — Wildcard. Log all information except the v and the x option. To include the v and the x option, specify /l*vx.
This change should be used only for troubleshooting and should not be left on because it will have adverse effects on system performance and disk space. Each time that you use the Add or Remove Programs item in Control Panel, a new Msi*.log file is created. To disable the logging, remove the Logging registry value.
Enable Windows Installer logging with Group Policies
You can enable logging with Group Policies by editing the appropriate OU or Directory Group Policy. Under Group Policy, expand Computer Configuration, expand Administrative Templates, expand Windows Components, and then select Windows Installer.
Double-click Logging, and then click Enabled. In the Logging box, enter the options you want to log. The log file, Msi.log, appears in the Temp folder of the system volume.
For more information about MSI logging, see Windows Help. To do this, search by using the phrase msi logging, and then select Managing options for computers through Group Policy.
The addition of the x flag is available natively in Windows Server 2003 and later operating systems, on the MSI redistributable version 3.0, and on later versions of the MSI redistributable.
Вертим логи как хотим ― анализ журналов в системах Windows

Пора поговорить про удобную работу с логами, тем более что в Windows есть масса неочевидных инструментов для этого. Например, Log Parser, который порой просто незаменим.
В статье не будет про серьезные вещи вроде Splunk и ELK (Elasticsearch + Logstash + Kibana). Сфокусируемся на простом и бесплатном.
Журналы и командная строка
До появления PowerShell можно было использовать такие утилиты cmd как find и findstr. Они вполне подходят для простой автоматизации. Например, когда мне понадобилось отлавливать ошибки в обмене 1С 7.7 я использовал в скриптах обмена простую команду:
Она позволяла получить в файле fail.txt все ошибки обмена. Но если было нужно что-то большее, вроде получения информации о предшествующей ошибке, то приходилось создавать монструозные скрипты с циклами for или использовать сторонние утилиты. По счастью, с появлением PowerShell эти проблемы ушли в прошлое.
Основным инструментом для работы с текстовыми журналами является командлет Get-Content, предназначенный для отображения содержимого текстового файла. Например, для вывода журнала сервиса WSUS в консоль можно использовать команду:
Для вывода последних строк журнала существует параметр Tail, который в паре с параметром Wait позволит смотреть за журналом в режиме онлайн. Посмотрим, как идет обновление системы командой:
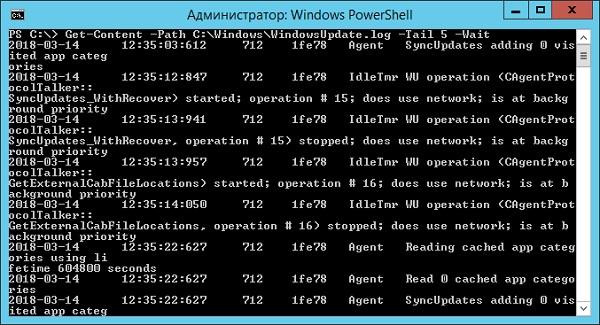
Смотрим за ходом обновления Windows.
Если же нам нужно отловить в журналах определенные события, то поможет командлет Select-String, который позволяет отобразить только строки, подходящие под маску поиска. Посмотрим на последние блокировки Windows Firewall:
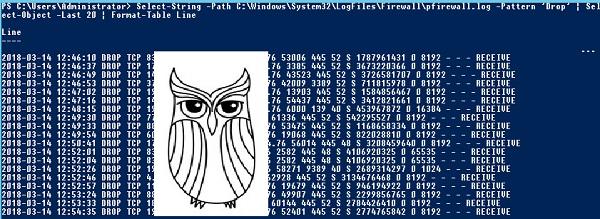
Смотрим, кто пытается пролезть на наш дедик.
При необходимости посмотреть в журнале строки перед и после нужной, можно использовать параметр Context. Например, для вывода трех строк после и трех строк перед ошибкой можно использовать команду:
Оба полезных командлета можно объединить. Например, для вывода строк с 45 по 75 из netlogon.log поможет команда:
Журналы системы ведутся в формате .evtx, и для работы с ними существуют отдельные командлеты. Для работы с классическими журналами («Приложение», «Система», и т.д.) используется Get-Eventlog. Этот командлет удобен, но не позволяет работать с остальными журналами приложений и служб. Для работы с любыми журналами, включая классические, существует более универсальный вариант ― Get-WinEvent. Остановимся на нем подробнее.
Для получения списка доступных системных журналов можно выполнить следующую команду:
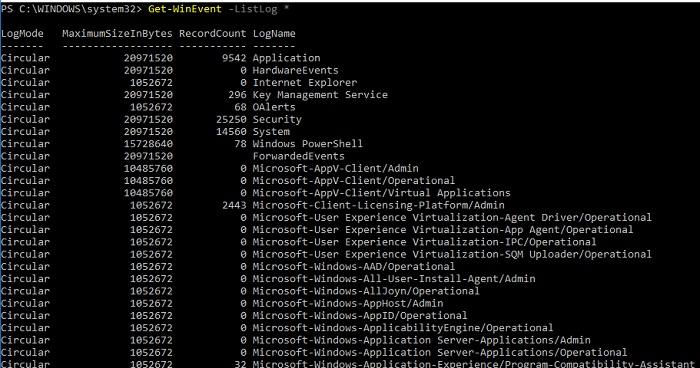
Вывод доступных журналов и информации о них.
Для просмотра какого-то конкретного журнала нужно лишь добавить его имя. Для примера получим последние 20 записей из журнала System командой:
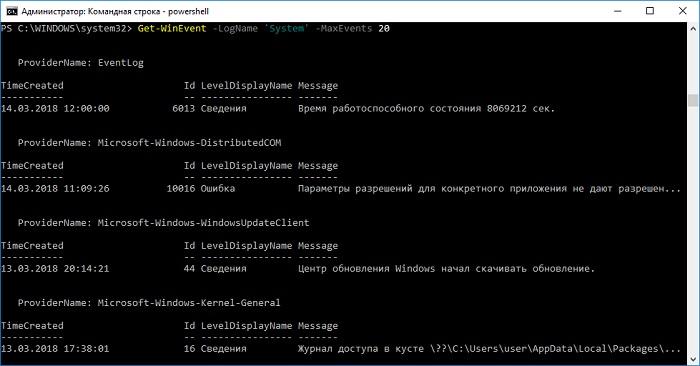
Последние записи в журнале System.
Для получения определенных событий удобнее всего использовать хэш-таблицы. Подробнее о работе с хэш-таблицами в PowerShell можно прочитать в материале Technet about_Hash_Tables.
Для примера получим все события из журнала System с кодом события 1 и 6013.
В случае если надо получить события определенного типа ― предупреждения или ошибки, ― нужно использовать фильтр по важности (Level). Возможны следующие значения:
- 0 ― всегда записывать;
- 1 ― критический;
- 2 ― ошибка;
- 3 ― предупреждение;
- 4 ― информация;
- 5 ― подробный (Verbose).
Собрать хэш-таблицу с несколькими значениями важности одной командой так просто не получится. Если мы хотим получить ошибки и предупреждения из системного журнала, можно воспользоваться дополнительной фильтрацией при помощи Where-Object:
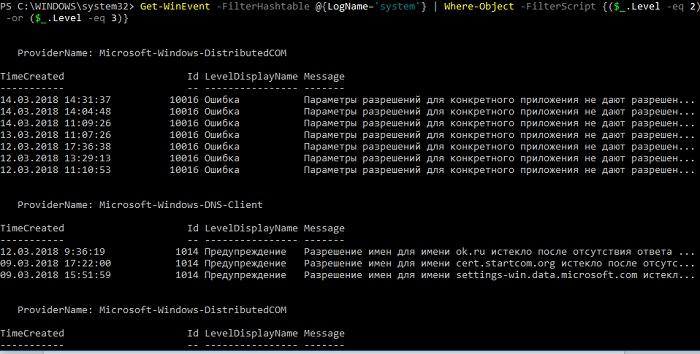
Ошибки и предупреждения журнала System.
Аналогичным образом можно собирать таблицу, фильтруя непосредственно по тексту события и по времени.
Подробнее почитать про работу обоих командлетов для работы с системными журналами можно в документации PowerShell:
PowerShell ― механизм удобный и гибкий, но требует знания синтаксиса и для сложных условий и обработки большого количества файлов потребует написания полноценных скриптов. Но есть вариант обойтись всего-лишь SQL-запросами при помощи замечательного Log Parser.
Работаем с журналами посредством запросов SQL
Утилита Log Parser появилась на свет в начале «нулевых» и с тех пор успела обзавестись официальной графической оболочкой. Тем не менее актуальности своей она не потеряла и до сих пор остается для меня одним из самых любимых инструментов для анализа логов. Загрузить утилиту можно в Центре Загрузок Microsoft, графический интерфейс к ней ― в галерее Technet. О графическом интерфейсе чуть позже, начнем с самой утилиты.
О возможностях Log Parser уже рассказывалось в материале «LogParser — привычный взгляд на непривычные вещи», поэтому я начну с конкретных примеров.
Для начала разберемся с текстовыми файлами ― например, получим список подключений по RDP, заблокированных нашим фаерволом. Для получения такой информации вполне подойдет следующий SQL-запрос:
Посмотрим на результат:

Смотрим журнал Windows Firewall.
Разумеется, с полученной таблицей можно делать все что угодно ― сортировать, группировать. Насколько хватит фантазии и знания SQL.
Log Parser также прекрасно работает с множеством других источников. Например, посмотрим откуда пользователи подключались к нашему серверу по RDP.
Работать будем с журналом TerminalServices-LocalSessionManager\Operational.
Не со всеми журналами Log Parser работает просто так ― к некоторым он не может получить доступ. В нашем случае просто скопируем журнал из %SystemRoot%\System32\Winevt\Logs\Microsoft-Windows-TerminalServices-LocalSessionManager%4Operational.evtx в %temp%\test.evtx.
Данные будем получать таким запросом:

Смотрим, кто и когда подключался к нашему серверу терминалов.
Особенно удобно использовать Log Parser для работы с большим количеством файлов журналов ― например, в IIS или Exchange. Благодаря возможностям SQL можно получать самую разную аналитическую информацию, вплоть до статистики версий IOS и Android, которые подключаются к вашему серверу.
В качестве примера посмотрим статистику количества писем по дням таким запросом:
Если в системе установлены Office Web Components, загрузить которые можно в Центре загрузки Microsoft, то на выходе можно получить красивую диаграмму.
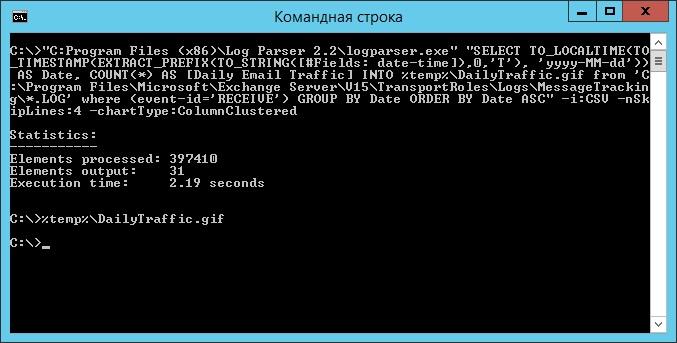
Выполняем запрос и открываем получившуюся картинку…

Любуемся результатом.
Следует отметить, что после установки Log Parser в системе регистрируется COM-компонент MSUtil.LogQuery. Он позволяет делать запросы к движку утилиты не только через вызов LogParser.exe, но и при помощи любого другого привычного языка. В качестве примера приведу простой скрипт PowerShell, который выведет 20 наиболее объемных файлов на диске С.
Ознакомиться с документацией о работе компонента можно в материале Log Parser COM API Overview на портале SystemManager.ru.
Благодаря этой возможности для облегчения работы существует несколько утилит, представляющих из себя графическую оболочку для Log Parser. Платные рассматривать не буду, а вот бесплатную Log Parser Studio покажу.

Интерфейс Log Parser Studio.
Основной особенностью здесь является библиотека, которая позволяет держать все запросы в одном месте, без россыпи по папкам. Также сходу представлено множество готовых примеров, которые помогут разобраться с запросами.
Вторая особенность ― возможность экспорта запроса в скрипт PowerShell.
В качестве примера посмотрим, как будет работать выборка ящиков, отправляющих больше всего писем:
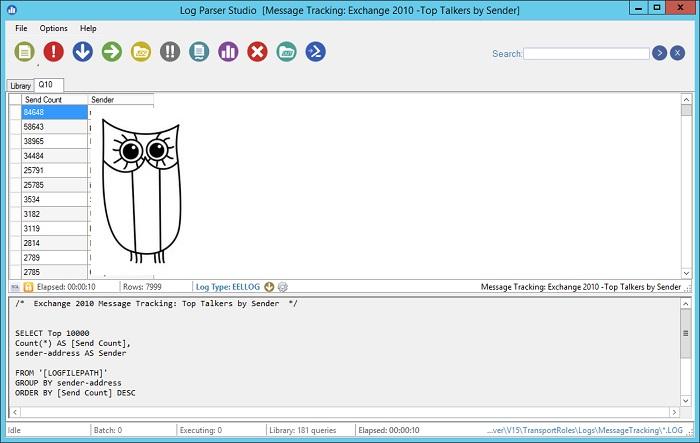
Выборка наиболее активных ящиков.
При этом можно выбрать куда больше типов журналов. Например, в «чистом» Log Parser существуют ограничения по типам входных данных, и отдельного типа для Exchange нет ― нужно самостоятельно вводить описания полей и пропуск заголовков. В Log Parser Studio нужные форматы уже готовы к использованию.
Помимо Log Parser, с логами можно работать и при помощи возможностей MS Excel, которые упоминались в материале «Excel вместо PowerShell». Но максимального удобства можно достичь, подготавливая первичный материал при помощи Log Parser с последующей обработкой его через Power Query в Excel.
Приходилось ли вам использовать какие-либо инструменты для перелопачивания логов? Поделитесь в комментариях.


