- Мониторинг Windows серверов с помощью Nagios
- Установка клиента NSClient++
- Установка и настройка Nagios. Мониторинг Windows-хостов и Cisco. Настройка уведомлений по email
- Установка и настройка Nagios 3
- Nagios windows monitoring tool
- Introduction
- Overview
- Steps
- Installing the NCPA Agent on Windows
- Configuring NCPA
- Start Monitoring
- Active Checks (check_ncpa.py)
- Installing the check_ncpa.py plugin
- Creating new command, host and service definitions for monitoring the Windows machine
- Create the check command definition
- Create Nagios checks
- Restarting the Nagios daemon
- Passive Checks (NRDP)
- Add checks to your ncpa configuration
- Configure your NRDP settings
- Restart the NCPA Passive service
Мониторинг Windows серверов с помощью Nagios
В статье nagios 3 – установка, настройка и эксплуатация я не касался темы про детальную настройку мониторинга серверов под управлением Windows. Под детальной настройкой я имею ввиду мониторинг ресурсов памяти, процессора, свободного места на дисках, работу сервисов и процессов на сервере.
Чтобы мониторить эти компоненты windows систем нам понадобиться установить на windows машинах специальную программу – NSClient++, которая и будет взаимодействовать с Nagios.
Установка клиента NSClient++
Качаем NSClient с официального сайта. Имеются версии для 32 и 64bit систем.
При установке клиента я рекомендую включать все компоненты программы, т.к. в компонентах имеется и исключения для брандмауэра windows, чтобы потом не конфигурировать это вручную.
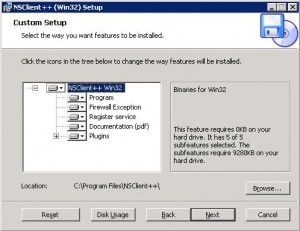
При установке NSClient++отмечаем все компоненты
Для доступа к машине задаем ip сервера, где у нас стоит Nagios, а также рекомендую задать специальный пароль. Пароль следует задавать один и тот-же для всех машин, где ставится NSClient.
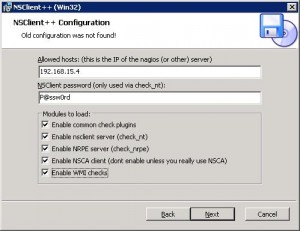
Задаем опции NSClient++
В завершение установки клиента ставим галочку, Start Service и можно переходить к настройке Nagios.
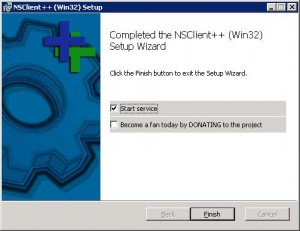
После завершения установки стартуем сервис NSClient++
Установка и настройка Nagios. Мониторинг Windows-хостов и Cisco. Настройка уведомлений по email
Установка и настройка Nagios 3
Требования
Установка
Заходим в консоль с правами root:
Вводим свой пароль. Далее скачиваем необходимые нам пакеты:
#apt-get install apache2 php5 nagios3
Во время установки он задаст несколько вопросов в зависимости от вашей конфигурации сервера и попросит ввести пароль для учетной записи nagiosadmin.Теперь после окончания установки вы можете зайти на веб-интерфейс вашего Nagios. Для примера наш IP 192.168.0.1:
Настройка Nagios для мониторинга Windows-хостов
Все необходимые конфигурационные файлы лежат в папке /etc/nagios3/conf.d/. А глобальный конфигурационный файл nagios и файл команд лежат здесь /etc/nagios3/ и называется nagios.cfg и commands.cfg соответственно.
Чтобы мониторить windows-хосты нам необходимо подключить к nagios плагин check_nt, добавить необходимые компьютеры, которые мы хотим мониторить, в конфигурационные файлы и настроить на этих же компьютерах NSClient++.
Для начала настроим NSClient++.
Скачать его можно отсюда www.nsclient.org/nscp/downloads. Есть как 32-разрядная, так и 64-разрядная версии. Скачиваем и запускаем установку. Далее мы со всем соглашаемся и в окошке, где необходимо вписать информацию вводим ip нашего nagios-сервера, пароль и ставим везде галочки, кроме WMI.

Нажимаем Next и заканчиваем установку.
Идём в папку C:\Program Files\NSClient++ и открываем для редактирования файл NSC.ini. Здесь нам нужно изменить некоторые строчки:
— вводим наш пароль:
;# PASSWORD
; This is the password (-s) that is required to access NSClient remotely. If you leave this blank everyone will be able to access the daemon remotly.
password=12345
;# ALLOWED HOST ADDRESSES
; This is a comma-delimited list of IP address of hosts that are allowed to talk to the all daemons.
; If leave this blank anyone can access the deamon remotly (NSClient still requires a valid password).
; The syntax is host or ip/mask so 192.168.0.0/24 will allow anyone on that subnet access
allowed_hosts=192.168.0.1/255.255.255.0
;# USE THIS FILE
; Use the INI file as opposed to the registry if this is 0 and the use_reg in the registry is set to 1
; the registry will be used instead.
use_file=1
allowed_hosts=192.168.0.1
password=12345
Далее идём в службы, открываем NSClient++ и ставим галочку напротив «Разрешить взаимодействие с рабочим столом» на вкладке «Вход в систему».

Теперь нам нужно запустить клиент. Из командной строки:
Идем в диспетчер задач и проверяем запущен ли клиент.

На этом настройка NSClient++ закончена.
Теперь нам необходимо настроить Nagios.
Идем в файл /etc/nagios3/commands.cfg и добавляем следующие строчки:
# check_nt command definition
define command <
command_name check_nt
command_line $USER1$/check_nt -H $HOSTADDRESS$ -p 12489 -s 12345 -v $ARG1$ $ARG2$
>
Этой строкой мы включаем плагин check_nt. Не забываем указать наш пароль, который мы вводили при настройке NSClient++ (12345).
После этого добавим необходимый нам хост. Для этого создадим файлик myhosts.cfg в папке
/etc/nagios3/conf.d/. Дадим ему необходимые права для пользователя nagiosadmin. Запишем в нем следющее:
# WINDOWS SERVERS
define host <
host_name windows-server
alias WINDOWS-SERVER
address 192.168.0.2
use generic-host
>
Так как хост у нас предполагается быть не один, то создадим группу для всех windows-хостов. Сделаем это в файле /etc/nagios3/conf.d/hostgroups_nagios2.cfg
# WINDOWS SERVERS
define hostgroup <
hostgroup_name windows-servers
alias WINDOWS SERVERS
members windows-server, windows-server2
>
Теперь нам необходимо добавить сервисы, которые будут мониториться. Делается это в файле /etc/nagios3/conf.d/services_nagios2.cfg
# NSCLIENT
define service <
hostgroup_name windows-servers
service_description NSClient++ Version
check_command check_nt!CLIENTVERSION
use generic-service
>
— проверка пинга до хоста:
# PING
define service <
hostgroup_name windows-servers
service_description PING
check_command check_ping!100.0,20%!500.0,60%
use generic-service
>
# CPU
define service <
hostgroup_name windows-servers
service_description CPU Load
check_command check_nt!CPULOAD!-l 5,80,90
use generic-service
>
# MEMORY
define service <
hostgroup_name windows-servers
service_description Memory Usage
check_command check_nt!MEMUSE!-w 80 -c 90
use generic-service
>
— распределение места на системном диске:
# DISK SPACE
define service <
hostgroup_name windows-servers
service_description C: Drive Space
check_command check_nt!USEDDISKSPACE!-l c -w 80 -c 90
use generic-service
>
Теперь перезапускаем Nagios:
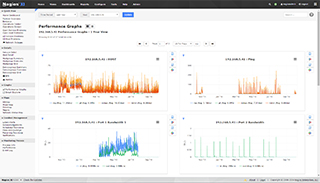
Заходим в веб-интерфейс nagios и по нашему хосту видим следующую инфу:

Настройка Nagios для мониторинга CISCO (2960 и 3750)
Для начала нам нужно настроить SNMP на самой CISCO. Заходим в консоль и прописываем следующее:
#snmp-server community RO-COMMUNITY RO
#snmp-server trap-source Vlan1
#snmp-server source-interface informs Vlan1
#snmp-server location LOCATION
#snmp-server contact admin@admin.com
#snmp-server host 192.168.0.1 RO-COMMUNITY
#exit
Теперь проверим работает ли snmp следующей командой с хоста, где стоит Nagios:
# snmpwalk –v2c –c RO-COMMUNITY 192.168.0.4
192.168.0.4 – ip нашей Cisco 2960.
После этой команды должно пойти огромное количество записей по вашей Cisco. Если ругается, то скорее всего не установлен пакет snmpd и snmp-utils. Или следует проверять конфиг Cisco.
Итак, мы убедились, что все работает. Идём подключать плагин check_snmp. Лезем в файлик commands.cfg в /etc/nagios3/ и вбиваем следующее:
# check_snmp command definition
define command <
command_name check_snmp
command_line usr/lib/nagios/plugins/check_snmp -H $HOSTADRESS$ $ARG1$
>
Добавляем нужные нам хосты в тот же файлик myhosts.cfg
define host <
host_name CISCO 2960
alias CISCO 2960
address 192.168.0.4
use generic-host
>
Можно также создать группу, если свитчей много.
Описываем необходимые нам сервисы:
# CISCO 2960
# PING
define service <
host_name cisco 2960
service_description PING
check_command check_ping!100.0,20%!500.0,60%
use generic-service
>
# UPTIME
define service <
host_name cisco 2960
service_description UPTIME
check_command check_snmp! -H 192.168.0.4 -C RO-COMMUNITY -o .1.3.6.1.2.1.1.3.0 -l «Uptime is»
use generic-service
>
— порты FastEthernet с 1 по 6:
# PORT STATUS for SWITCHES-24
define service <
host_name cisco 2960
service_description FastEthernet Port 1-6 Link Status
check_command check_snmp! -H 192.168.0.4 -C RO-COMMUNITY -o ifOperStatus.10001 -r 1 -m RFC1213-MIB, -o ifOperStatus.10002 -r 1 -m RFC1213-MIB, -o ifOperStatus.10003 -r 1 -m RFC1213-MIB, -o ifOperStatus.10004 -r 1 -m RFC1213-MIB, -o ifOperStatus.10005 -r 1 -m RFC1213-MIB, -o ifOperStatus.10006 -r 1 -m RFC1213-MIB
use generic-service
>
Прошу обратить внимание, что на гигабитных свитчах номер портов указывается, как 10001, 10002. А гигабитные порты — 10101, 10102.
— порты GigabitEthernet отдельно:
define service <
host_name cisco 2960
service_description GigabitEthernet Port 1 Link Status
check_command check_snmp! -H 192.168.0.4 -C RO-COMMUNITY -o ifOperStatus.10101 -r 1 -m RFC1213-MIB
use generic-service
>
define service <
host_name cisco 2960
service_description GigabitEthernet Port 2 Link Status
check_command check_snmp! -H 192.168.0.4 -C RO-COMMUNITY -o ifOperStatus.10102 -r 1 -m RFC1213-MIB
use generic-service
>
define service <
host_name cisco 2960
service_description FAN Status
check_command check_snmp! -H 192.168.0.4 -C RO-COMMUNITY -o .1.3.6.1.4.1.9.9.13.1.4.1.2.1004 -l «Fan Status»
use generic-service
>
define service <
host_name cisco 2960
service_description Power Supply Status
check_command check_snmp! -H 192.168.0.4 -C RO-COMMUNITY -o .1.3.6.1.4.1.9.9.13.1.5.1.2.1003 -l «Power Supply Status»
use generic-service
>
define service <
host_name cisco 2960
service_description Temperature Status
check_command check_snmp! -H 192.168.0.4 -C RO-COMMUNITY -o .1.3.6.1.4.1.9.5.1.2.13.0 -l «Temp Status»
use generic-service
>
define service <
host_name cisco 2960
service_description CPU Load
check_command check_snmp! -H 192.168.0.4 -C RO-COMMUNITY -o .1.3.6.1.4.1.9.9.109.1.1.1.1.5.1 -w 90 -c 95 -u % -l «CPU Load»
use generic-service
>
define service <
host_name cisco 2960
service_description Memory Usage
check_command check_snmp! -H 192.168.0.4 -C RO-COMMUNITY -o .1.3.6.1.4.1.9.9.48.1.1.1.5.1 -l «Mem Used»
use generic-service
>
Теперь перезапускаем Nagios и видим примерную картину по нашей железке. Для себя я добавил еще промежутки портов.

В промежутке портов он сообщает состояние CRITICAL, даже если один из портов находится в состоянии «down».
В вышеуказанных сервисах прописаны oid’ы для Cisco 2960, которые мне в итоге подошли и для 3750. Необходимые вам oid’s можно найти на сайте Cisco или с помощью, например, MIB Browser.
Настройка уведомлений по email
Для начала нужно поставить следующие пакеты:
#apt-get install libio-socket-ssl-perl libnet-ssleay-perl perl
#apt-get install sendemail
Создадим для nagios почтовый ящик, например на gmail.
Теперь в файле commands.cfg пропишем следующее:
# ‘notify-host-by-email’ command definition
define command <
command_name notify-host-by-email
command_line /usr/bin/printf «%b» «***** Nagios *****\n\nNotification Type: $NOTIFICATIONTYPE$\nHost: $HOSTNAME$\nState: $HOSTSTATE$\nAddress: $HOSTADDRESS$\nInfo: $HOSTOUTPUT$\n\nDate/Time: $LONGDATETIME$\n» | /usr/bin/sendemail -f username@gmail.com -t yourmail@gmail.com -u «NAGIOS WARNING» -s smtp.gmail.com -o tls=yes -xu username -xp password -m
>
# ‘notify-host-by-emailz’ command definition
define command <
command_name notify-host-by-emailz
command_line /usr/bin/printf «%b» «***** Nagios *****\n\nNotification Type: $NOTIFICATIONTYPE$\nHost: $HOSTNAME$\nState: $HOSTSTATE$\nAddress: $HOSTADDRESS$\nInfo: $HOSTOUTPUT$\n\nDate/Time: $LONGDATETIME$\n» | /usr/bin/sendemail -f username@gmail.com -t yourmail@gmail.com -u «NAGIOS WARNING» -s smtp.gmail.com -o tls=yes -xu username -xp password -m
>
username@gmail.com – созданный почтовый ящик
yourmail@gmail.com – ящик, куда будут приходить оповещения.
username – логин от созданного почтового ящика
password – пароль от созданного почтового ящика
Теперь создадим нужный нам контакт в файле /etc/nagios3/conf.d/contacts_nagios2.cfg
define contact <
contact_name user
alias Root
service_notification_period 24×7
host_notification_period 24×7
service_notification_options w,u,c,r
host_notification_options d,r
service_notification_commands notify-service-by-email
host_notification_commands notify-host-by-email
email username@gmail.com
>
Перезапускаем Nagios. Настройка закончена.
Данная статья не подлежит комментированию, поскольку её автор ещё не является полноправным участником сообщества. Вы сможете связаться с автором только после того, как он получит приглашение от кого-либо из участников сообщества. До этого момента его username будет скрыт псевдонимом.
Nagios windows monitoring tool
Our tech support team is happy to help you with any questions you might have. Contact us on our online support forum at https://support.nagios.com/forum/
Nagios XI Makes Monitoring Easier:
Nagios XI is the easy-to-use, enterprise version of Nagios that features:
- Web-Based Configuration provides advanced configuration features
- Monitoring Wizards make it easy to monitor new devices, applications, and services
- Customizable Dashboards allow for per-user customization
- Integrated Performance Graphs provide trending and capacity planning information
- Advanced Reports provide data insight and exporting capabilities
- Data Visualizations enable powerful analysis of patterns and problems
- Nagios Core Import functionality makes it easy to migrate from Nagios Core
- . and many other features
Download a free 60-day trial of Nagios XI or give the online demo a spin.
Inquire today and let our Quickstart team help you get started with Nagios XI
 Up To: Contents
 See Also: Quickstart Installation Guide, Monitoring Publicly Available Services
Introduction
This document describes how you can monitor «private» services and attributes of Windows machines, such as:
- Memory usage
- CPU load
- Disk usage
- Service states
- Running processes
- etc.
Publicly available services that are provided by Windows machines (HTTP, FTP, POP3, etc.) can be monitored easily by following the documentation on monitoring publicly available services.
Note: These instructions assume that you’ve installed Nagios according to the quickstart guide. The sample configuration entries below reference objects that are defined in the sample config files (commands.cfg, templates.cfg, etc.) that are installed if you follow the quickstart.
Overview
Monitoring private services or attributes of a Windows machine requires that you install an agent on it. This agent acts as a proxy between the Nagios plugin that does the monitoring and the actual service or attribute of the Windows machine. Without installing an agent on the Windows box, Nagios would be unable to monitor private services or attributes of the Windows box.
Steps
There are several steps you’ll need to follow in order to monitor a new Windows machine. They are:
- Installing the NCPA Agent on Windows
- Configuring NCPA
- Start Monitoring
- Active Checks (check_ncpa.py)
- Installing the check_ncpa.py plugin
- Creating new command, host and service definitions for monitoring the Windows machine
- Restarting the Nagios daemon
- Passive Checks (NRDP)
- Add checks to your ncpa configuration
- Configure your NRDP settings
- Active Checks (check_ncpa.py)
Installing the NCPA Agent on Windows
Before you can begin monitoring private services and attributes of Windows machines, you’ll need to install an agent on those machines. We recommend using Nagios cross-platform agent, which can be found at https://www.nagios.org/ncpa/.
These instructions will take you through a basic installation of the NCPA agent, as well as the configuration of Nagios for monitoring the Windows machine.
- Download the latest stable NCPA agent to the system you are installing it on from here: https://nagios.org/ncpa/#downloads.
- Double click on the ncpa-x.y.z.exe file to start the installation of the agent. Follow through all of the required steps as described in our NCPA documentation here: https://www.nagios.org/ncpa/getting-started.php#windows
Configuring NCPA
Most of the configuration will be located in the C:\Program Files (x86)\Nagios\NCPA\etc\ncpa.cfg file. See detailed instructions on how to configure the NPCA agent on Windows in our Help Documentation. After modfying the configuration files and saving them, you will need to restart the NPCA services, so that changes can take effect. You can do this from the services administration panel (in the GUI) or from the command line (CMD Prompt):
Start Monitoring
Find our what you want to monitor
Knowing what you want to monitor will help you figure out what sort of checks you will need NCPA to perform. This could include your own custom plugins — or just data that NCPA can get itself. That is entirely up to the end user. For this example we will monitor the following using only NCPA built-ins:
- CPU Usage
- Memory usage
- Total Process Count
There are many more endpoints, but you can read the help documentation to see more options.
Decide the kind of check to use
Once you’ve decided what to monitor, you can choose how to monitor it. There are two types of checks you can use. Active checks are ran using a plugin on the Nagios Core side, which will put most of the load on the server. If you have a lot of checks and want to move some of the load or you have a system that sometimes drops connections, you might want to use a passive check. Passive checks run on the client side and send the check results to Nagios Core for processing. NCPA can do both kinds of checks, so it’s up to you to choose.
Active Checks (check_ncpa.py)
The steps below will cover some basic information on how to install the check_ncpa.py plugin, create a new command, host, and service definitions in Nagios Core.
Installing the check_ncpa.py plugin
Run the following commands from the command line on your Nagios server:
Note: If you have a different path to the nagios plugins directory, you will need to modify the last command.
To verify the version of the check_ncpa.py plugin, run the following command from the command line:
You should see something like this:
Creating new command, host and service definitions for monitoring the Windows machine
Create the check command definition
Create the check_ncpa command in your configuration files for Nagios Core, normally they are located in /usr/local/nagios/etc — you may have a commands.cfg file you will want to put this command in. The command below will allow us to pass most of the arguments in with $ARG1$ , allowing it to be more dynamic.
Create Nagios checks
You can create the checks in a config file in /usr/local/nagios/etc . For this example we will create a config file called ncpa.cfg with the following defined:
Replace the -t ‘mytoken’ with your own token. This will tell Nagios to perform active checks and will create a host called «NCPA 2 Host» with checks for CPU Usage, Memory Usage, and Process Count.
Restarting the Nagios daemon
Restart the Nagios service and you should see pending hosts/services appear. Once they do their initial checks, you should see your NCPA data in Nagios.
Passive Checks (NRDP)
In order for passive checks to work, you have to configure your passive service to actually send the checks. By default in new installs of NCPA 2, no passive handler is configured. If you installed on Windows and set up NRDP during the install process then you will already have a configuration set up. However, it would be a good idea to take a closer look at your configuration just in case.
Add checks to your ncpa configuration
Add a new NCPA configuration file to the ncpa.cfg.d directory located in the base NCPA installation directory. Use the following outline for passive checks to send to the NRDP server of your choice.
By default, passive checks are ran on 5 minute intervals, however with NCPA 2 you can now define a check interval in seconds by appending |interval to the left side of the passive check definition. An example of a CPU check that would be performed every 30 seconds is below:
Configure your NRDP settings
Once you have your settings. Edit your ncpa.cfg file to look something like the following:
Enable the nrdp handler in the [passive] section of your config:
Restart the NCPA Passive service
You should start receiving passive check results immediately after the service has been restarted. A service restart is always required when making changes to the passive check configuration


