- Red Hat Enterprise Linux Troubleshooting Guide
- Red Hat Enterprise Linux Troubleshooting Guide
- Book description
- Red Hat Customer Portal
- Log in to Your Red Hat Account
- Red Hat Account
- Customer Portal
- Select Your Language
- Logging, Monitoring, and Troubleshooting Guide
- An In-Depth Guide to OpenStack Logging, Monitoring, and Troubleshooting
- OpenStack Documentation Team
- Preface
- Chapter 1. Logging
- 1.1. Log Files for OpenStack Services
- 1.1.1. Bare Metal Provisioning (ironic) Log Files
- 1.1.2. Block Storage (cinder) Log Files
- 1.1.3. Compute (nova) Log Files
- 1.1.4. Dashboard (horizon) Log Files
- 1.1.5. Data Processing (sahara) Log Files
- 1.1.6. Database as a Service (trove) Log Files
- 1.1.7. Identity Service (keystone) Log Files
- 1.1.8. Image Service (glance) Log Files
- 1.1.9. Networking (neutron) Log Files
- 1.1.10. Object Storage (swift) Log Files
- 1.1.11. Orchestration (heat) Log Files
- 1.1.12. Shared Filesystem Service (manila) Log Files
- 1.1.13. Telemetry (ceilometer) Log Files
- 1.1.14. Log Files for Supporting Services
- 1.2. Configure Logging Options
- 1.3. Remote Logging Installation and Configuration
- 1.3.1. Introduction to Remote Logging
- 1.3.2. Install rsyslog Server
- 1.3.3. Configure rsyslog on the Centralized Logging Server
- 1.3.4. Configure rsyslog on Individual Nodes
- 1.3.5. Start the rsyslog Server
- Chapter 2. Monitoring Using the Telemetry Service
- 2.1. View Existing Alarms
- 2.2. Configure an Alarm
- 2.3. Disable or Delete an Alarm
- 2.4. View Samples
- 2.5. Create a Sample
- 2.6. View Cloud Usage Statistics
- Chapter 3. Monitoring Using Nagios
- 3.1. Install the Nagios Service
- 3.1.1. Nagios Service Placement
- 3.1.2. Install the NRPE Addon
- 3.2. Configure Nagios
- 3.2.1. Configure HTTPD for Nagios
- 3.2.2. Configure Nagios to Monitor OpenStack Services
- 3.2.3. Configure NRPE
- 3.2.4. Create Host Definitions
- 3.2.5. Create Service Definitions for Remote Services
- 3.2.6. Verify the Nagios Configuration
- Chapter 4. Troubleshooting
- 4.1. Support
- 4.2. Troubleshoot Identity Client (keystone) Connectivity Problems
- 4.3. Troubleshoot OpenStack Networking Issues
- 4.4. Troubleshoot Networks and Routes Tab Display Issues in the Dashboard
- 4.5. Troubleshoot Instance Launching Errors in the Dashboard
- 4.6. Troubleshoot Keystone v3 Dashboard Authentication
- 4.7. OpenStack Dashboard — Red Hat Access Tab
- 4.7.1. Search
- 4.7.2. Logs
- 4.7.3. Support
Red Hat Enterprise Linux Troubleshooting Guide
Identify, capture and resolve common issues faced by Red Hat Enterprise Linux administrators using best practices and advanced troubleshooting techniques
About This Book
- Develop a strong understanding of the base tools available within Red Hat Enterprise Linux (RHEL) and how to utilize these tools to troubleshoot and resolve real-world issues
- Gain hidden tips and techniques to help you quickly detect the reason for poor network/storage performance
- Troubleshoot your RHEL to isolate problems using this example-oriented guide full of real-world solutions
Who This Book Is For
If you have a basic knowledge of Linux from administration or consultant experience and wish to add to your Red Hat Enterprise Linux troubleshooting skills, then this book is ideal for you. The ability to navigate and use basic Linux commands is expected.
What You Will Learn
- Identify issues that need rapid resolution against long term root cause analysis
- Discover commands for testing network connectivity such as telnet, netstat, ping, ip and curl
- Spot performance issues with commands such as top, ps, free, iostat, and vmstat
- Use tcpdump for traffic analysis
- Repair a degraded file system and rebuild a software raid
- Identify and troubleshoot hardware issues using dmesg
- Troubleshoot custom applications with strace and knowledge of Linux resource limitations
In Detail
Red Hat Enterprise Linux is an operating system that allows you to modernize your infrastructure, boost efficiency through virtualization, and finally prepare your data center for an open, hybrid cloud IT architecture. It provides the stability to take on today’s challenges and the flexibility to adapt to tomorrow’s demands.
In this book, you begin with simple troubleshooting best practices and get an overview of the Linux commands used for troubleshooting. The book will cover the troubleshooting methods for web applications and services such as Apache and MySQL. Then, you will learn to identify system performance bottlenecks and troubleshoot network issues; all while learning about vital troubleshooting steps such as understanding the problem statement, establishing a hypothesis, and understanding trial, error, and documentation. Next, the book will show you how to capture and analyze network traffic, use advanced system troubleshooting tools such as strace, tcpdump & dmesg, and discover common issues with system defaults.
Finally, the book will take you through a detailed root cause analysis of an unexpected reboot where you will learn to recover a downed system.
Style and approach
This is an easy-to-follow guide packed with examples of real-world core Linux concepts. All the topics are presented in detail while you’re performing the actual troubleshooting steps.
Источник
Red Hat Enterprise Linux Troubleshooting Guide
Explore a preview version of Red Hat Enterprise Linux Troubleshooting Guide right now.
O’Reilly members get unlimited access to live online training experiences, plus books, videos, and digital content from 200+ publishers.
Book description
Identify, capture and resolve common issues faced by Red Hat Enterprise Linux administrators using best practices and advanced troubleshooting techniques
About This Book
- Develop a strong understanding of the base tools available within Red Hat Enterprise Linux (RHEL) and how to utilize these tools to troubleshoot and resolve real-world issues
- Gain hidden tips and techniques to help you quickly detect the reason for poor network/storage performance
- Troubleshoot your RHEL to isolate problems using this example-oriented guide full of real-world solutions
Who This Book Is For
If you have a basic knowledge of Linux from administration or consultant experience and wish to add to your Red Hat Enterprise Linux troubleshooting skills, then this book is ideal for you. The ability to navigate and use basic Linux commands is expected.
What You Will Learn
- Identify issues that need rapid resolution against long term root cause analysis
- Discover commands for testing network connectivity such as telnet, netstat, ping, ip and curl
- Spot performance issues with commands such as top, ps, free, iostat, and vmstat
- Use tcpdump for traffic analysis
- Repair a degraded file system and rebuild a software raid
- Identify and troubleshoot hardware issues using dmesg
- Troubleshoot custom applications with strace and knowledge of Linux resource limitations
Red Hat Enterprise Linux is an operating system that allows you to modernize your infrastructure, boost efficiency through virtualization, and finally prepare your data center for an open, hybrid cloud IT architecture. It provides the stability to take on today’s challenges and the flexibility to adapt to tomorrow’s demands.
In this book, you begin with simple troubleshooting best practices and get an overview of the Linux commands used for troubleshooting. The book will cover the troubleshooting methods for web applications and services such as Apache and MySQL. Then, you will learn to identify system performance bottlenecks and troubleshoot network issues; all while learning about vital troubleshooting steps such as understanding the problem statement, establishing a hypothesis, and understanding trial, error, and documentation. Next, the book will show you how to capture and analyze network traffic, use advanced system troubleshooting tools such as strace, tcpdump & dmesg, and discover common issues with system defaults.
Finally, the book will take you through a detailed root cause analysis of an unexpected reboot where you will learn to recover a downed system.
Style and approach
This is an easy-to-follow guide packed with examples of real-world core Linux concepts. All the topics are presented in detail while you’re performing the actual troubleshooting steps.
Источник
Red Hat Customer Portal
Log in to Your Red Hat Account
Your Red Hat account gives you access to your profile, preferences, and services, depending on your status.
If you are a new customer, register now for access to product evaluations and purchasing capabilities.
Need access to an account?
If your company has an existing Red Hat account, your organization administrator can grant you access.
Red Hat Account
Customer Portal
For your security, if you’re on a public computer and have finished using your Red Hat services, please be sure to log out.
Select Your Language
Logging, Monitoring, and Troubleshooting Guide
An In-Depth Guide to OpenStack Logging, Monitoring, and Troubleshooting
OpenStack Documentation Team
Abstract
Preface
This document provides an overview of the logging and monitoring capabilities that are availbale in a Red Hat Enterprise Linux OpenStack Platform environment, and how to troubleshoot possible issues.
Chapter 1. Logging
Red Hat Enterprise Linux OpenStack Platform writes informational messages to specific log files; you can use these messages for troubleshooting and monitoring system events.
You need not attach the individual log files to your support cases manually. All the required information will be gathered automatically by the sosreport utility, which is described in Chapter 4, Troubleshooting.
1.1. Log Files for OpenStack Services
Each OpenStack component has a separate logging directory containing files specific to a running service.
1.1.1. Bare Metal Provisioning (ironic) Log Files
OpenStack Ironic API
OpenStack Ironic Conductor
1.1.2. Block Storage (cinder) Log Files
Block Storage API
Block Storage Backup
The cinder-manage command
Block Storage Scheduler
Block Storage Volume
1.1.3. Compute (nova) Log Files
OpenStack Compute API service
OpenStack Compute certificate server
OpenStack Compute service
OpenStack Compute Conductor service
OpenStack Compute VNC console authentication server
OpenStack Compute NoVNC Proxy service
OpenStack Compute Scheduler service
1.1.4. Dashboard (horizon) Log Files
Log of certain user interactions
The Apache HTTP server uses several additional log files for the Dashboard web interface, which can be accessed using a web browser or command-line clients (keystone, nova). The following log files can be helpful in tracking the usage of the Dashboard and diagnosing faults:
All processed HTTP requests
Admin-role API requests
Admin-role API errors
Member-role API requests
Member-role API errors
There is also /var/log/httpd/default_error.log , which stores errors reported by other web services running on the same host; for example, nagios .
1.1.5. Data Processing (sahara) Log Files
Sahara API Server
Sahara Engine Server
1.1.6. Database as a Service (trove) Log Files
OpenStack Trove API Service
OpenStack Trove Conductor Service
OpenStack Trove guestagent Service
OpenStack Trove taskmanager Service
1.1.7. Identity Service (keystone) Log Files
OpenStack Identity Service
1.1.8. Image Service (glance) Log Files
OpenStack Image Service API server
OpenStack Image Service Registry server
1.1.9. Networking (neutron) Log Files
OpenStack Neutron DHCP Agent
OpenStack Networking Layer 3 Agent
Metadata agent service
Metadata namespace proxy
/var/log/neutron/neutron-ns-metadata-proxy- UUID .log
Open vSwitch agent
OpenStack Networking service
1.1.10. Object Storage (swift) Log Files
OpenStack Object Storage sends logs to the system logging facility only.
By default, all Object Storage log files to /var/log/swift/swift.log, using the local0, local1, and local2 syslog facilities.
The log messages of Object Storage are classified into two broad categories: those by REST API services and those by background daemons. The API service messages contain one line per API request, in a manner similar to popular HTTP servers; both the frontend (Proxy) and backend (Account, Container, Object) services post such messages. The daemon messages are less structured and typically contain human-readable information about daemons performing their periodic tasks. However, regardless of which part of Object Storage produces the message, the source identity is always at the beginning of the line.
An example of a proxy message:
An example of ad-hoc messages from background daemons:
1.1.11. Orchestration (heat) Log Files
OpenStack Heat API Service
Openstack Heat Engine Service
Orchestration service events
1.1.12. Shared Filesystem Service (manila) Log Files
OpenStack Manila API Server
OpenStack Manila Scheduler
OpenStack Manila Share Service
Some information from the Manila Python library can also be logged in /var/log/manila/manila-manage.log .
1.1.13. Telemetry (ceilometer) Log Files
OpenStack ceilometer notification agent
OpenStack ceilometer alarm evaluation
OpenStack ceilometer alarm notification
OpenStack ceilometer API
OpenStack ceilometer central agent
OpenStack ceilometer collection
OpenStack ceilometer compute agent
1.1.14. Log Files for Supporting Services
The following services are used by the core OpenStack components and have their own log directories and files.
Message broker (RabbitMQ)
/var/log/rabbitmq/rabbit@ short_hostname .log
/var/log/rabbitmq/rabbit@ short_hostname -sasl.log (for Simple Authentication and Security Layer related log messages)
Database server (MariaDB)
Document-oriented database (MongoDB)
Virtual network switch (Open vSwitch)
1.2. Configure Logging Options
Each component maintains its own separate logging configuration in its respective configuration file. For example, in Compute, these options are set in /etc/nova/nova.conf :
Increase the level of informational logging by enabling debugging. This option greatly increases the amount of information captured, so you may want to consider using it only temporarily, or first reviewing your log rotation settings.
Enable verbose logging:
Change the log file path:
Send your logs to a central syslog server:
Options are also available for timestamp configuration and log formatting, among others. Review the component’s configuration file for additional logging options.
1.3. Remote Logging Installation and Configuration
1.3.1. Introduction to Remote Logging
All systems generate and update log files recording their actions and any problems they encounter. In a distributed or cloud computing environment that contains many systems, collecting these log files in a central location simplifies debugging.
The rsyslog service provides facilities both for running a centralized logging server and for configuring individual systems to send their log files to the centralized logging server. This is referred to as configuring the systems for remote logging .
1.3.2. Install rsyslog Server
The rsyslog package must be installed on the system that you intend to use as a centralized logging server and all systems that will be configured to send logs to it. To do so, log in as the root user and install the rsyslog package:
The rsyslog package is installed and ready to be configured.
1.3.3. Configure rsyslog on the Centralized Logging Server
The steps in this procedure must be followed on the system that you intend to use as your centralized logging sever. All steps in this procedure must be run while logged in as the root user.
Configure SELinux to allow rsyslog traffic.
Open the /etc/rsyslog.conf file in a text editor.
Add the following lines to the file, defining the location logs will be saved to:
Remove the comment character ( # ) from the beginning of these lines in the file:
Your centralized log server is now configured to receive and store log files from the other systems in your environment.
1.3.4. Configure rsyslog on Individual Nodes
Apply the steps listed in this procedure to each of your systems to configure them to send logs to a centralized log server. All steps listed in this procedure must be performed while logged in as the root user.
Edit the /etc/rsyslog.conf , and specify the address of your centralized log server by adding the following:
Replace YOURSERVERADDRESS with the address of the centralized logging server. Replace YOURSERVERPORT with the port on which the rsyslog service is listening. For example:
The single @ sign specifies the UDP protocol for transmission. Use @@ to specify the TCP protocol for transmission.
The use of the wildcard ( * ) character in these example configurations indicates to rsyslog that log entries from all log facilities and of all log priorities must be sent to the remote rsyslog server.
For information on applying more precise filtering of log files refer to the manual page for the rsyslog configuration file, rsyslog.conf . Access the manual page by running man rsyslog.conf .
1.3.5. Start the rsyslog Server
The rsyslog service must be running on both the centralized logging server and the systems attempting to log to it.
The steps in this procedure must be performed while logged in as the root user.
Start the rsyslog service:
Ensure the rsyslog service starts automatically in the future:
The rsyslog service has been started. The service will start sending or receiving log messages based on its local configuration.
Chapter 2. Monitoring Using the Telemetry Service
For help with the ceilometer command, use:
For help with the subcommands, use:
2.1. View Existing Alarms
To list configured Telemetry alarms, use:
To list configured meters for a resource, use:
Where UUID is the resource ID for an existing resource (for example, an instance, image, or volume).
2.2. Configure an Alarm
To configure an alarm to activate when a threshold value is crossed, use the ceilometer alarm-threshold-create command with the following syntax:
Example
To configure an alarm that activates when the average CPU utilization for an individual instance exceeds 50% for three consecutive 600s (10 minute) periods, use:
In this example, the notification action is a log message.
To edit an existing threshold alarm, use the ceilometer alarm-threshold-update command together with the alarm ID, followed by one or more options to be updated.
Example
To increase the alarm threshold to 75%, use:
2.3. Disable or Delete an Alarm
To disable an alarm, use:
To delete an alarm, use:
2.4. View Samples
To list all the samples for a particular meter name, use:
To list samples only for a particular resource within a range of time stamps, use:
Where START_TIME and END_TIME are in the form iso-dateThh:mm:ss .
Example
To query an instance for samples taken between 13:10:00 and 14:25:00 , use:
2.5. Create a Sample
Samples can be created for sending to the Telemetry service and they need not correspond to a previously defined meter. Use the following syntax:
Where METER_TYPE can be one of:
- Cumulative — a running total
- Delta — a change or difference over time
- Gauge — a discrete value
Example
Where volume , normally the value obtained as a result of the sampling action, is in this case the value being created by the command.
Samples are not updated because the moment a sample is created, it is sent to the Telemetry service. Samples are essentially messages, which is why they have a message ID. To create new samples, repeat the sample-create command and update the —sample-volume value.
2.6. View Cloud Usage Statistics
OpenStack administrators can use the dashboard to view cloud statistics.
- As an admin user in the dashboard, select Admin >System >Resource Usage .
Click one of the following:
- Daily Report — View a report of daily usage per project. Select the date range and a limit for the number of projects, and click Generate Report ; the daily usage report is displayed.
- Stats — View a graph of metrics grouped by project. Select the values and time period using the drop-down menus; the displayed graph is automatically updated.
The ceilometer command line client can also be used for viewing cloud usage statics.
Example
To view all the statistics for the cpu_util meter, use:
Example
Statistics can be restricted to a specific resource by means of the —query option, and restricted to a specific range by means of the timestamp option.
Chapter 3. Monitoring Using Nagios
3.1. Install the Nagios Service
The Nagios monitoring system can be used to provide monitoring and alerts for the OpenStack network and infrastructure. The following installation procedure installs:
Install the required packages as the root user, using the yum command:
If any of the packages are not immediately available (for example, gd-devel or gcc), you might have to enable the optional Red Hat channel using subscription-manager :
3.1.1. Nagios Service Placement
Consider deploying Nagios to a server that is external to the OpenStack environment, allowing it to receive diagnostic information in the event of system issues. In addition, there are a number of points to review for optimal Nagios placement:
- Nagios services can have high CPU overhead if SSH is used.
- Nagios should be hosted on a securely locked down server, especially if security events are being monitored. The Nagios server will receive traffic from a broad scope of systems. If security segmentation is a requirement, then this would be considered a privileged system, subject to additional firewall rules than what would apply to an OpenStack node.
- Nagios servers may receive a considerable amount of network traffic, resulting in resource contention.
3.1.2. Install the NRPE Addon
NRPE (Nagios Remote Plugin Executor) plugins are compiled executables or scripts that are used to check the status of a host’s service, and report back to the Nagios service. If the OpenStack cloud is distributed across machines, the NPRE addon can be used to run access plugin information on those remote machines.
NRPE and the Nagios plugins must be installed on each remote machine to be monitored. On the remote machine, and as the root user, execute the following:
After the installation, you can view all available plugins in the /usr/lib64/nagios/plugins/ directory.
SSH can also be used to access remote Nagios plugins. However, this can result in too high a CPU load on both the Nagios host and remote machine, and is not recommended.
3.2. Configure Nagios
Nagios is composed of a server, plugins that report object/host information from both local and remote machines back to the server, a web interface, and configuration that ties all of it together.
At a minimum, the following must be done:
- Check web-interface user name and password, and check basic configuration.
- Add OpenStack monitoring to the local server.
If the OpenStack cloud includes distributed hosts:
- Install and configure NRPE on each remote machine (that has services to be monitored).
- Tell Nagios which hosts are being monitored.
- Tell Nagios which services are being monitored for each host.
Table 3.1. Nagios Configuration Files
Main Nagios configuration file.
CGI configuration file.
Nagios configuration for httpd.
Password file for Nagios users.
Contains user-specific settings.
Object definition files that are used to store information about items such as services or contact groups.
NRPE configuration file.
3.2.1. Configure HTTPD for Nagios
By default, when Nagios is installed, the default httpd user and password is: nagiosadmin / nagiosadmin . This value can be viewed in the /etc/nagios/cgi.cfg file.
To configure HTTPD for nagios, follow these steps:
To change the default password for the user nagiosadmin , execute:
To create a new user, use the following command with the new user’s name:
Update the nagiosadmin email address in /etc/nagios/objects/contacts.cfg :
Verify that the basic configuration is working:
If errors occur, check the parameters set in /etc/nagios/nagios.cfg .
Ensure that Nagios is started automatically when the system boots:
Start up Nagios and restart httpd:
Check your Nagios access by using the following URL in your browser, and using the nagiosadmin user and the password that was set in Step 2:
Figure 3.1. Nagios Login
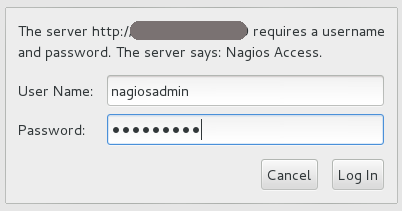
If the Nagios URL cannot be accessed, ensure your firewall rules have been set up correctly.
3.2.2. Configure Nagios to Monitor OpenStack Services
By default, on the Nagios server, the /etc/nagios/objects/localhost.cfg file is used to define services for basic local statistics; for example, swap usage or the number of current users. You can always comment these services out if they are no longer needed by prefacing each line with a ‘#’ character. This same file can be used to add new OpenStack monitoring services.
Additional service files can be used, but they must be specified as a cfg_file parameter in the /etc/nagios/nagios.cfg file.
Write a short script for the item to be monitored (for example, whether a service is running), and place it in the /usr/lib64/nagios/plugins directory.
For example, the following script checks the number of Compute instances, and is stored in a file named nova-list :
Ensure the script is executable:
In the /etc/nagios/objects/commands.cfg file, specify a command section for each new script:
In the /etc/nagios/objects/localhost.cfg file, define a service for each new item, using the defined command. For example:
Restart nagios using:
3.2.3. Configure NRPE
To set up monitoring on each remote machine, execute the following as the root user:
In the /etc/nagios/nrpe.cfg file, add the central Nagios server IP address in the allowed_hosts line:
In the /etc/nagios/nrpe.cfg file, add any commands to be used to monitor the OpenStack services. For example:
Each defined command can then be specified in the services.cfg file on the Nagios monitoring server.
Any complicated monitoring can be placed into a script, and then referred to in the command definition.
Start the NRPE service:
3.2.4. Create Host Definitions
If additional machines are being used in the cloud, in addition to the host on which Nagios is installed, they must be made known to Nagios by configuring them in an objects file:
- Log in as the root user.
- In the /etc/nagios/objects/ directory, create a hosts.cfg file.
In the file, specify a host section for each machine on which an OpenStack service is running and should be monitored:
- host_name = Name of the remote machine to be monitored (typically listed in the local /etc/hosts file). This name is used to reference the host in service and host group definitions.
- alias = Name used to easily identify the host (typically the same as the host_name ).
- address = Host address (typically its IP address, although a FQDN can be used instead, just make sure that DNS services are available).
In the /etc/nagios/nagios.cfg file, under the OBJECT CONFIGURATION FILES section, specify the following line:
3.2.5. Create Service Definitions for Remote Services
To monitor remote services, you must define those services in a new file; in this procedure, /etc/nagios/objects/services.cfg :
In the /etc/nagios/objects/commands.cfg file, specify the following to handle the use of the check_nrpe plugin with remote scripts or plugins:
In the file, specify the following service sections for each remote OpenStack host to be monitored:
The above sections ensure that a server heartbeat, load check, and the OpenStack Identity service status are reported back to the Nagios server. All OpenStack services can be reported, just ensure that a matching command is specified in the remote server’s nrpe.cfg file.
In the /etc/nagios/nagios.cfg file, under the OBJECT CONFIGURATION FILES section, specify the following line:
3.2.6. Verify the Nagios Configuration
Verify that the updated configuration is working:
If errors occur, check the parameters set in /etc/nagios/nagios.cfg , /etc/nagios/services.cfg , and /etc/nagios/hosts.cfg .
Log in to the Nagios dashboard again by using the following URL in your browser, and using the nagiosadmin user and the password that was set in the beginning:
Chapter 4. Troubleshooting
This chapter contains logging and support information to assist with troubleshooting your Red Hat Enterprise Linux OpenStack Platform deployment.
4.1. Support
If client commands fail or you run into other issues, contact Red Hat Technical Support with a description of what happened, the full console output, all log files referenced in the console output, and an sosreport from the node that is (or might be) in trouble. For example, if you encounter a problem on the compute level, run sosreport on the Nova node, or if it is a networking issue, run the utility on the Neutron node. For general deployment issues, it is best to run sosreport on the cloud controller.
Check also the /var/log/messages file for any hints.
4.2. Troubleshoot Identity Client (keystone) Connectivity Problems
When the Identity client ( keystone ) is unable to contact the Identity service it returns an error:
To debug the issue check for these common causes:
On the system hosting the Identity service check the service status:
If the service is not running then log in as the root user and start it.
Firewall is not configured properly The firewall might not be configured to allow TCP traffic on ports 5000 and 35357 . If so, see Configure the Firewall to Allow Identity Service Traffic in the Installation Reference for instructions on how to correct this. Service Endpoints not defined correctly
On the system hosting the Identity service check that the endpoints are defined correctly.
Obtain the administration token:
Determine the correct administration endpoint for the Identity service:
Replace IP with the IP address or host name of the system hosting the Identity service. Replace VERSION with the API version ( v2.0 , or v3 ) that is in use.
Unset any pre-defined Identity service related environment variables:
Use the administration token and endpoint to authenticate with the Identity service. Confirm that the Identity service endpoint is correct:
Verify that the listed publicurl , internalurl , and adminurl for the Identity service are correct. In particular ensure that the IP addresses and port numbers listed within each endpoint are correct and reachable over the network.
If these values are incorrect then see Create the Identity Service Endpoint in the Installation Reference for information on adding the correct endpoint. Once the correct endpoints have been added, remove any incorrect endpoints using the endpoint-delete action of the keystone command:
Replace TOKEN and ENDPOINT with the values identified previously. Replace ID with the identity of the endpoint to remove as listed by the endpoint-list action.
4.3. Troubleshoot OpenStack Networking Issues
This section discusses the different commands you can use and procedures you can follow to troubleshoot the OpenStack Networking service issues.
- Use the ip a command to display all the physical and virtual devices.
- Use the ovs-vsctl show command to display the interfaces and bridges in a virtual switch.
- Use the ovs-dpctl show command to show datapaths on the switch.
Use the tcpdump command to see where packets are not getting through.
Replace INTERFACE with the name of the network interface to see where the packets are not getting through. The interface name can be the name of the bridge or host Ethernet device.
The -e flag ensures that the link-level header is dumped (in which the vlan tag will appear).
The -w flag is optional. You can use it only if you want to write the output to a file. If not, the output is written to the standard output ( stdout ).
For more information about tcpdump , refer to its manual page by running man tcpdump .
- Use the ip netns list command to list all known network namespaces.
Use the ip netns exec command to show routing tables inside specific namespaces.
Start the ip netns exec command in a bash shell so that subsequent commands can be invoked without the ip netns exec command.
4.4. Troubleshoot Networks and Routes Tab Display Issues in the Dashboard
The Networks and Routers tabs only appear in the dashboard when the environment is configured to use OpenStack Networking. In particular note that by default the PackStack utility currently deploys Nova Networking and as such in environments deployed in this manner the tab will not be visible.
If OpenStack Networking is deployed in the environment but the tabs still do not appear ensure that the service endpoints are defined correctly in the Identity service, that the firewall is allowing access to the endpoints, and that the services are running.
4.5. Troubleshoot Instance Launching Errors in the Dashboard
When using the dashboard to launch instances if the operation fails, a generic ERROR message is displayed. Determining the actual cause of the failure requires the use of the command line tools.
Use the nova list command to locate the unique identifier of the instance. Then use this identifier as an argument to the nova show command. One of the items returned will be the error condition. The most common value is NoValidHost .
This error indicates that no valid host was found with enough available resources to host the instance. To work around this issue, consider choosing a smaller instance size or increasing the overcommit allowances for your environment.
To host a given instance, the compute node must have not only available CPU and RAM resources but also enough disk space for the ephemeral storage associated with the instance.
4.6. Troubleshoot Keystone v3 Dashboard Authentication
django_openstack_auth is a pluggable Django authentication back end, that works with Django’s contrib.auth framework, to authenticate a user against the OpenStack Identity service API. Django_openstack_auth uses the token object to encapsulate user and Keystone related information. The dashboard uses the token object to rebuild the Django user object.
The token object currently stores:
- Keystone token
- User information
- Scope
- Roles
- Service catalog
The dashboard uses Django’s sessions framework for handling user session data. The following is a list of numerous session back ends available, which are controlled through the SESSION_ENGINE setting in your local_settings.py file:
- Local Memory Cache
- Memcached
- Database
- Cached Database
- Cookies
In some cases, particularly when a signed cookie session back end is used and, when having many or all services enabled all at once, the size of cookies can reach its limit and the dashboard can fail to log in. One of the reasons for the growth of cookie size is the service catalog. As more services are registered, the bigger the size of the service catalog would be.
In such scenarios, to improve the session token management, include the following configuration settings for logging in to the dashboard, especially when using Keystone v3 authentication.
In /usr/share/openstack-dashboard/openstack_dashboard/settings.py add the following configuration:
In the same file, change SESSION_ENGINE to:
Connect to the database service using the mysql command, replacing USER with the user name by which to connect. The USER must be a root user (or at least as a user with the correct permission: create db).
Create the Horizon database.
Exit the mysql client.
Change to the openstack_dashboard directory and sync the database using:
You do not need to create a superuser, so answer ‘n’ to the question.
Restart Apache http server. For Red Hat Enterprise Linux:
4.7. OpenStack Dashboard — Red Hat Access Tab
The Red Hat Access tab, which is part of the OpenStack dashboard, allows you to search for and read articles or solutions from the Red Hat Customer Portal, view logs from your instances and diagnose them, and work with your customer support cases.
Figure 4.1. Red Hat Access Tab.
![]()
You must be logged in to the Red Hat Customer Portal in the browser in order to be able to use the functions provided by the Red Hat Access tab.
If you are not logged in, you can do so now:
- Click Log In .
- Enter your Red Hat login.
- Enter your Red Hat password.
- Click Sign in .
This is how the form looks:
Figure 4.2. Logging in to the Red Hat Customer Portal.

If you do not log in now, you will be prompted for your Red Hat login and password when you use one of the functions that require authentication.
4.7.1. Search
You can search for articles and solutions from Red Hat Customer Portal by entering one or more search keywords. The titles of the relevant articles and solutions will then be displayed. Click on a title to view the given article or solution:
Figure 4.3. Example of Search Results on the Red Hat Access Tab.

4.7.2. Logs
Here you can read logs from your OpenStack instances:
Figure 4.4. Instance Logs on the Red Hat Access Tab.

Find the instance of your choice in the table. If you have many instances, you can filter them by name, status, image ID, or flavor ID. Click View Log in the Actions column for the instance to check.
When an instance log is displayed, you can click Red Hat Diagnose to get recommendations regarding its contents:
Figure 4.5. Instance Logs on the Red Hat Access Tab.

If none of the recommendations are useful or a genuine problem has been logged, click Open a New Support Case to report the problem to Red Hat Support.
4.7.3. Support
The last option in the Red Hat Access Tab allows you to search for your support cases at the Red Hat Customer Portal:
Figure 4.6. Search for Support Cases.
![]()
You can also open a new support case by clicking the appropriate button and filling out the form on the following page:
Figure 4.7. Open a New Support Case.
Источник


