- Linux Admin — Remote Management
- Remote Console Management
- Remote GUI Management
- Laying the Foundation for Security with SSH for Remote Console Access
- Install and Configure SSH for Remote Access
- Configure VNC for Remote CentOS Administration
- Set Up SSH Tunnel Through VNC
- Use SSH Tunnel for Remote X-Windows
- Best Server Administration Tools for Linux
- Best Server Administration Tools for Linux
- Best Server Administration Tools for Linux
- cPanel
- Plesk
- Features :
- Open source control panel
- Monitoring and debugging
- Desktop Monitoring
- Infrastructure Monitoring
- Log Monitoring Tools
- Network Monitoring
- Top Server Monitoring Tools and Best Practices
- Best Free Server Monitoring Tools for Linux and Windows
- 10 Top Free Server Monitoring Tools for Server Administrators
- 5 Server Management Tools to Ensure a High Performing Website
Linux Admin — Remote Management
When talking about remote management in CentOS as an Administrator, we will explore two methods −
- Console Management
- GUI Management
Remote Console Management
Remote Console Management means performing administration tasks from the command line via a service such as ssh. To use CentOS Linux effectively, as an Administrator, you will need to be proficient with the command line. Linux at its heart was designed to be used from the console. Even today, some system administrators prefer the power of the command and save money on the hardware by running bare-bones Linux boxes with no physical terminal and no GUI installed.
Remote GUI Management
Remote GUI Management is usually accomplished in two ways: either a remote X-Session or a GUI application layer protocol like VNC. Each has its strengths and drawbacks. However, for the most part, VNC is the best choice for Administration. It allows graphical control from other operating systems such as Windows or OS X that do not natively support the X Windows protocol.
Using remote X Sessions is native to both X-Window’s Window-Managers and DesktopManagers running on X. However, the entire X Session architecture is mostly used with Linux. Not every System Administrator will have a Linux Laptop on hand to establish a remote X Session. Therefore, it is most common to use an adapted version of VNC Server.
The biggest drawbacks to VNC are: VNC does not natively support a multi-user environment such as remote X-Sessions. Hence, for GUI access to end-users remote XSessions would be the best choice. However, we are mainly concerned with administering a CentOS server remotely.
We will discuss configuring VNC for multiple administrators versus a few hundred endusers with remote X-Sessions.
Laying the Foundation for Security with SSH for Remote Console Access
ssh or Secure Shell is now the standard for remotely administering any Linux server. SSH unlike telnet uses TLS for authenticity and end-to-end encryption of communications. When properly configured an administrator can be pretty sure both their password and the server are trusted remotely.
Before configuring SSH, lets talk a little about the basic security and least common access. When SSH is running on its default port of 22; sooner rather than later, you are going to get brute force dictionary attacks against common user names and passwords. This just comes with the territory. No matter how many hosts you add to your deny files, they will just come in from different IP addresses daily.
With a few common rules, you can simply take some pro-active steps and let the bad guys waste their time. Following are a few rules of security to follow using SSH for remote administration on a production server −
Never use a common username or password. Usernames on the system should not be system default, or associated with the company email address like: systemadmin@yourcompany.com
Root access or administration access should not be allowed via SSH. Use a unique username and su to root or an administration account once authenticated through SSH.
Password policy is a must: Complex SSH user passwords like: «This&IS&a&GUD&P@ssW0rd&24&me». Change passwords every few months to eliminate susceptibility to incremental brute force attacks.
Disable abandoned or accounts that are unused for extended periods. If a hiring manager has a voicemail stating they will not be doing interviews for a month; that can lead to tech-savvy individuals with a lot time on their hands, for example.
Watch your logs daily. As a System Administrator, dedicate at least 30-40 minutes every morning reviewing system and security logs. If asked, let everyone know you don’t have the time to not be proactive. This practice will help isolate warning signs before a problem presents itself to end-users and company profits.
Note On Linux Security − Anyone interested in Linux Administration should actively pursue current Cyber-Security news and technology. While we mostly hear about other operating systems being compromised, an insecure Linux box is a sought-after treasure for cybercriminals. With the power of Linux on a high-speed internet connection, a skilled cybercriminal can use Linux to leverage attacks on other operating systems.
Install and Configure SSH for Remote Access
Step 1 − Install SSH Server and all dependent packages.
Step 2 − Make a secure regular use to add for shell access.
Note − We added the new user to the wheel group enabling ability to su into root once SSH access has been authenticated. We also used a username that cannot be found in common word lists. This way, our account will not get locked out when SSH is attacked.
The file holding configuration settings for sshd server is /etc/ssh/sshd_config.
The portions we want to edit initially are −
Step 3 − Reload the SSH daemon sshd.
It is good to set the logout grace period to 60 minutes. Some complex administration tasks can exceed the default of 2 minutes. There is really nothing more frustrating than having SSH session timeout when configuring or researching changes.
Step 4 − Let’s try to login using the root credentials.
Step 5 − We can no longer login remotely via ssh with root credentials. So let’s login to our unprivileged user account and su into the root account.
Step 6 − Finally, let’s make sure the SSHD service loads on boot and firewalld allows outside SSH connections.
SSH is now set up and ready for remote administration. Depending on your enterprise border, the packet filtering border device may need to be configured to allow SSH remote administration outside the corporate LAN.
Configure VNC for Remote CentOS Administration
There are a few ways to enable remote CentOS administration via VNC on CentOS 6 — 7. The easiest, but most limiting way is simply using a package called vino. Vino is a Virtual Network Desktop Connection application for Linux designed around the Gnome Desktop platform. Hence, it is assumed the installation was completed with Gnome Desktop. If the Gnome Desktop has not been installed, please do so before continuing. Vino will be installed with a Gnome GUI install by default.
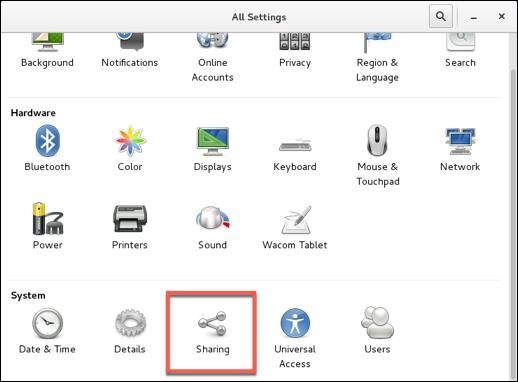
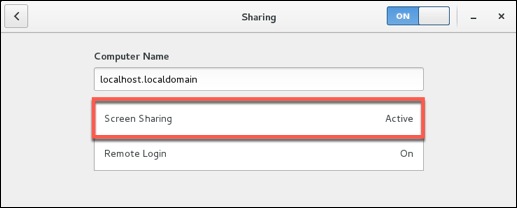
To configure screen sharing with Vino under Gnome, we want to go into the CentOS System Preferences for screen sharing.
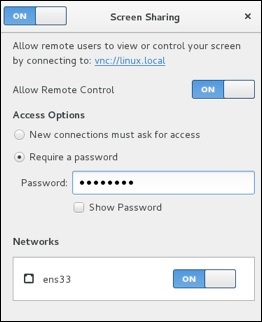
Notes to configuring VNC Desktop Sharing −
Disable New Connections must ask for access − This option will require physical access to ok every connection. This option will prevent remote administration unless someone is at the physical desktop.
Enable Require a password − This is separate from the user password. It will control the access to the virtual desktop and still require the user password to access a locked desktop (this is good for security).
Forward UP&P Ports: If available leave disabled − Forwarding UP&P ports will send Universal Plug and Play requests for a layer 3 device to allow VNC connections to the host automatically. We do not want this.
Make sure vino is listening on the VNC Port 5900.
Let’s now configure our Firewall to allow incoming VNC connections.
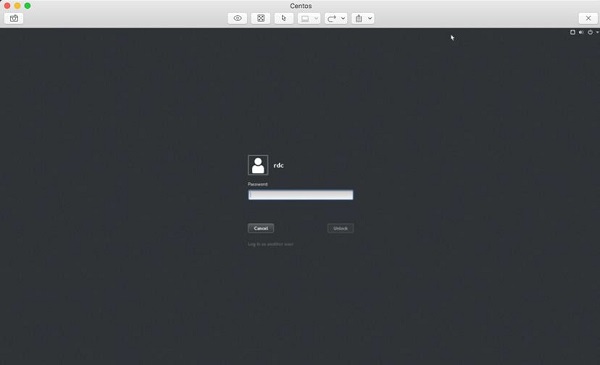
Finally, as you can see we are able to connect our CentOS Box and administer it with a VNC client on either Windows or OS X.

It is just as important to obey the same rules for VNC as we set forth for SSH. Just like SSH, VNC is continually scanned across IP ranges and tested for weak passwords. It is also worth a note that leaving the default CentOS login enabled with a console timeout does help with remote VNC security. As an attacker will need the VNC and user password, make sure your screen sharing password is different and just as hard to guess as the user password.
After entering the the VNC screen sharing password, we must also enter the user password to access a locked desktop.
Security Note − By default, VNC is not an encrypted protocol. Hence, the VNC connection should be tunneled through SSH for encryption.
Set Up SSH Tunnel Through VNC
Setting up an SSH Tunnel will provide a layer of SSH encryption to tunnel the VNC connection through. Another great feature is it uses SSH compression to add another layer of compression to the VNC GUI screen updates. More secure and faster is always a good thing when dealing with the administration of CentOS servers!
So from your client that will be initiating the VNC connection, let’s set up a remote SSH tunnel. In this demonstration, we are using OS X. First we need to sudo -s to root.
Enter the user password and we should now have root shell with a # prompt −
Now, let’s create our SSH Tunnel.
Let’s break this command down −
ssh − Runs the local ssh utility
-f − ssh should run in the background after the task fully executes
rdc@192.168.1.143 − Remote ssh user on the CentOS server hosting VNC services
-L 2200:192.168.1.143:5900 − Create our tunnel [Local Port]:[remote host]:[remote port of VNC service]
-N tells ssh we do not wish to execute a command on the remote system
After successfully entering the remote ssh user’s password, our ssh tunnel is created. Now for the cool part! To connect we point our VNC client at the localhost on the port of our tunnel, in this case port 2200. Following is the configuration on Mac Laptop’s VNC Client −
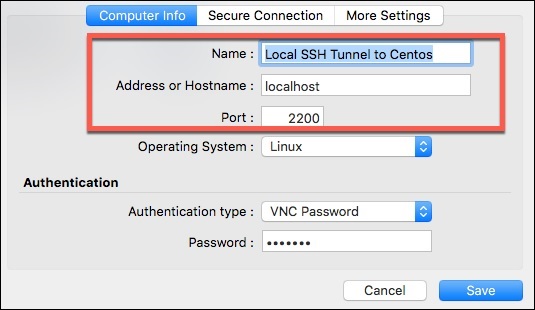
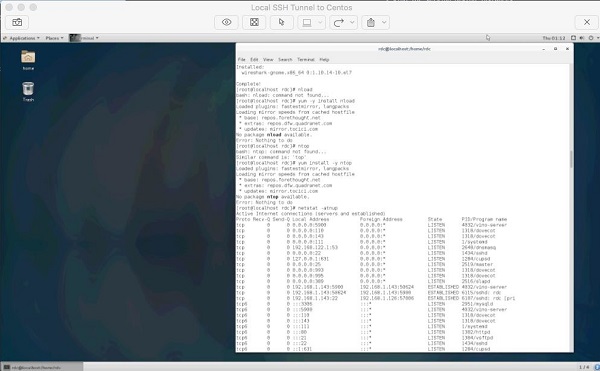
And finally, our remote VNC Desktop Connection!
The cool thing about SSH tunneling is it can be used for almost any protocol. SSH tunnels are commonly used to bypass egress and ingress port filtering by an ISP, as well as trick application layer IDS/IPS while evading other session layer monitoring.
Your ISP may filter port 5900 for non-business accounts but allow SSH on port 22 (or one could run SSH on any port if port 22 is filtered).
Application level IPS and IDS look at payload. For example, a common buffer overflow or SQL Injection. End-to-end SSH encryption will encrypt application layer data.
SSH Tunneling is great tool in a Linux Administrator’s toolbox for getting things done. However, as an Administrator we want to explore locking down the availability of lesser privileged users having access to SSH tunneling.
Administration Security Note − Restricting SSH Tunneling is something that requires thought on the part of an Administrator. Assessing why users need SSH Tunneling in the first place; what users need tunneling; along with practical risk probability and worst-case impact.
This is an advanced topic stretching outside the realm of an intermediate level primer. Research on this topic is advised for those who wish to reach the upper echelons of CentOS Linux Administration.
Use SSH Tunnel for Remote X-Windows
The design of X-Windows in Linux is really neat compared to that of Windows. If we want to control a remote Linux box from another Linux boxm we can take advantage of mechanisms built into X.
X-Windows (often called just «X»), provides the mechanism to display application windows originating from one Linux box to the display portion of X on another Linux box. So through SSH we can request an X-Windows application be forwarded to the display of another Linux box across the world!
To run an X Application remotely via an ssh tunnel, we just need to run a single command −
The syntax is − ssh -X [user]@[host], and the host must be running ssh with a valid user.
Following is a screenshot of GIMP running on a Ubuntu Workstation through a remote XWindows ssh tunnel.
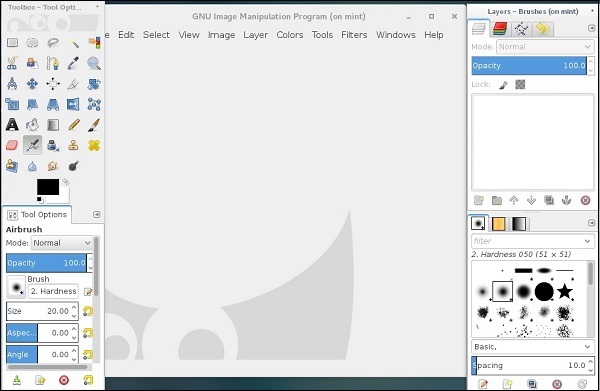
It is pretty simple to run applications remotely from another Linux server or workstation. It is also possible to start an entire X-Session and have the entire desktop environment remotely through a few methods.
Headless software packages such as NX
Configuring alternate displays and desktops in X and desktop managers such as Gnome or KDE
This method is most commonly used for headless servers with no physical display and really exceeds the scope of an intermediate level primer. However, it is good to know of the options available.
Источник
Best Server Administration Tools for Linux
Best Server Administration Tools for Linux
Best Server Administration Tools for Linux
Linux Server Administrator can’t avoid Web hosting control panel. A Web hosting control panel is a web-based interface to manage web services under a unique location. This kind of hosting panel offers easy to use management software’s to simplify the process of handling servers without the need of expert knowledge of sever administration. When we talking about Web Hosting Control panel, we can’t avoid cPanel and Plesk. The most popular and powerful Web based control panels. These two panels are paid software’s and hosting provider will charge a monthly fee for installing it on the server.
cPanel
cPanel combines a simple and easy to use interface with advanced tools which enable it to appeal to both the new user and experienced professional.
cPanel give you a complete control over the various aspects of website and administration through a standard web browser and also streamlines the process such as Creating database, setting up email account and auto responder and managing website files.
Plesk
Plesk is a great alternative to cPanel because it is available on both Linux and Windows. Plesk excels in areas such as instance clustering support and easy user access management. Plesk is not as popular as cPanel, but it is growing in popularity due to a large number of webmasters using Windows.
Features :
Create FTP account for users.
Manage and create email account and database like MySQL and PsotgreSQL.
Add domains and subdomains.
Restore and take back up of files.
Manage DNS and other resources.
Open source control panel
And also there are open source control panel available to download at no cost with similar features. Most famous open source control panel are below :
Webmin is the ultimate web-based management platform for Linux and several other operating systems. Written in Perl, it simplifies and streamlines standard administrative tasks. Additionally, Webmin helps you configure very complex implementations of Apache, MySQL and SendMail.
Virtualmin is a powerful and flexible free web hosting control panel for Linux based on Open Source web-based systems management. We can manage virtual domains, mailboxes, databases, applications, and the entire Linux server, from one comprehensive and easy interface.
There are also paid versions of Virtualmin depending on the number of domains that you need, from 10 to unlimited domains and like every GUI available, it counts with support.
DirectAdmin is popular due to its speed, stability and price point, but cPanel is better designed and more neatly laid out resulting in most webmasters choosing cPanel over DirectAdmin.
Manage and create email account and manage database.
Create FTP account for users.
Manage frontpage extension, DNS and view statistics.
Built in File Manager to manage uploads
Set up error pages and directory password protection.
H-sphere is offered by Positive Software and boasts the ability to be used on all major server operating systems. H-Sphere contains a criteria amount of advanced features which make it great for scalable multi-server cluster setups, but ultimately the focus on advanced features is also its downside as it is one of the most difficult to use control panels.
Zpanel is easy to use enterprise class web hosting control panel for Linux, UNIX, MacOS and Microsoft Windows.
Zpanel is written in purely PHP language and runs on Apache, PHP and MySQL. It comes with core set of essential features to run your web hosting service. The core features includes Apache Web Server, hMailServer, FileZilla Server, MySQL, PHP, Webalizer, RoundCube, phpMyAdmin, phpSysInfo, FTP Jailing and many more.
OpenPanel is an open source web based control panel licensed under GNU General Public. It has an attractive and easy to use interface. It can manage Apache, AWStats, Bind DNS, PureFTPD, Postfix, MySQL databases, IPTables firewall and Courier-IMAP e-mails and more.
System Administrators need a set of tools with which to manage their often unmanageable systems and environments. The two important tools that use to track records and test of time in the data center are below :
Virtual Network Computing (VNC)
VNC has become one of the most readily recognized and widely utilized remote access tools in the System Administrator’s toolbox. Its broad acceptance is due in part to its platform-independence. VNC is easy to install, simple to configure and available for almost every contemporary operating system.
Linux Rescue CD
Numerous rescue CDs exist for every task or imaginable situation. There are a three notable standouts in the crowd for those of you who don’t have one of these in your arsenal: The Ubuntu Rescue Remix, Parted Magic and GRML. Ubuntu Rescue Remix is a command line-based data recovery and forensics tools compilation (CD or USB). Parted Magic is a super diagnostic and rescue CD/USB/PXE that contains extensive documentation. GRML is a Debian-based live CD that contains a collection of System Administrator tools for system rescue, network analysis or as a working Linux distribution.
Monitoring and debugging
Linux performance problems is also important in Server Administration. The most important Linux Monitoring Tools are below :
Command Line Tools
Top
This is a small tool which is pre-installed on many unix systems. When you want an overview of all the processes or threads running in the system: top is a good tool.
Htop is essentially an enhanced version of top. It’s easier to sort by processes. It’s visually easier to understand and has built in commands for common things you would like to do. Plus it’s fully interactive.
atop
Atop monitors all processes much like top and htop, unlike top and htop however it has daily logging of the processes for long-term analysis. It also shows resource consumption by all processes. It will also highlight resources that have reached a critical load.
Apachetop monitors the overall performance of your apache webserver. It’s largely based on mytop. It displays current number of reads, writes and the overall number of requests processed.
ftptop gives you basic information of all the current ftp connections to your server such as the total amount of sessions, how many are uploading and downloading and who the client is.
mytop is a neat tool for monitoring threads and performance of mysql. It gives you a live look into the database and what queries it’s processing in real time.
powertop helps you diagnose issues that has to do with power consumption and power management. It can also help you experiment with power management settings to achieve the most efficient settings for your server. You switch tabs with the tab key.
iotop checks the I/O usage information and gives you a top-like interface to that. It displays columns on read and write and each row represents a process. It also displays the percentage of time the process spent while swapping in and while waiting on I/O.
Desktop Monitoring
ntopng is the next generation version of the original ntop, a network traffic probe that monitors network usage. ntopng is based on libpcap and it has been written in a portable way in order to virtually run on every Unix platform, MacOSX and on Windows as well.
ftop is a command-line system monitor tool that produces a frequently updated list of network connections. It listens to network traffic on a named interface and displays a table of current bandwidth usage by pairs of hosts
jnettop visualises network traffic in much the same way as iftop does. It also supports customizable text output and a machine-friendly mode to support further analysis.
BandwidthD tracks usage of TCP/IP network subnets and visualises that in the browser by building a html page with graphs in png. There is a database driven system that supports searching, filtering, multiple sensors and custom reports.
iptraf gathers a variety of metrics such as TCP connection packet and byte count, interface statistics and activity indicators, TCP/UDP traffic breakdowns and station packet and byte counts.
ngrep is grep but for the network layer. It’s pcap aware and will allow to specify extended regular or hexadecimal expressions to match against packets of .
MRTG was orginally developed to monitor router traffic, but now it’s able to monitor other network related things as well. It typically collects every five minutes and then generates a html page. It also has the capability of sending warning emails.
Traceroute is a built-in tool for displaying the route and measuring the delay of packets across a network.
vnStat is a network traffic monitor that uses statistics provided by the kernel which ensures light use of system resources. The gathered statistics persists through system reboots. It has color options for the artistic sysadmins.
Netstat used to find problems in the network that displays TCP network connections, routing tables and a number of network interfaces. It’s used to find problems in the network.
Instead of using netstat, it’s however preferable to use ss. The ss command is capable of showing more information than netstat and is actually faster. If you want a summary statistics you can use the command ss -s.
Nmap allows you to scan your server for open ports or detect which OS is being used. But you could also use this for SQL injection vulnerabilities, network discovery and other means related to penetration testing.
MTR combines the functionality of traceroute and the ping tool into a single network diagnostic tool. When using the tool it will limit the number hops individual packets has to travel while also listening to their expiry. It then repeats this every second.
tcpdump will output a description of the contents of the packet it just captured which matches the expression that you provided in the command. You can also save the this data for further analysis.
Infrastructure Monitoring
KDE system guard
This tool is both a system monitor and task manager. You can view server metrics from several machines through the worksheet and if a process needs to be killed or if you need to start a process it can be done within KDE system guard.
Munin is both a network and a system monitoring tool which offers alerts for when metrics go beyond a given threshold. It uses RRDtool to create the graphs and it has web interface to display these graphs. Its emphasis is on plug and play capabilities with a number of plugins available.
Nagios is system and network monitoring tool that helps you monitor monitor your many servers. It has support for alerting for when things go wrong. It also has many plugins written for the platform.
Zenoss provides a web interface that allows you to monitor all system and network metrics. Moreover it discovers network resources and changes in network configurations. It has alerts for you to take action on and it supports the Nagios plugins.
(And one for luck!) Cacti is network graphing solution that uses the RRDtool data storage. It allows a user to poll services at predetermined intervals and graph the result. Cacti can be extended to monitor a source of your choice through shell scripts.
Zabbix is an open source infrastructure monitoring solution. It can use most databases out there to store the monitoring statistics. The Core is written in C and has a frontend in PHP. If you don’t like installing an agent, Zabbix might be an option for you.
nmon either outputs the data on screen or saves it in a comma separated file. You can display CPU, memory, network, filesystems, top processes. The data can also be added to a RRD database for further analysis.
Glances monitors your system and aims to present a maximum amount of information in a minimum amount of space. It has the capability to function in a client/server mode as well as monitoring remotely. It also has a web interface.
Saidar is a very small tool that gives you basic information about your system resources. It displays a full screen of the standard system resources. The emphasis for saidar is being as simple as possible.
Monit has the capability of sending you alerts as well as restarting services if they run into trouble. It’s possible to perform any type of check you could write a script for with monit and it has a web user interface to ease your eyes.
Linux process explorer
Linux process explorer is akin to the activity monitor for OSX or the windows equivalent. It aims to be more usable than top or ps. You can view each process and see how much memory usage or CPU it uses.
df is an abbreviation for disk free and is pre-installed program in all unix systems used to display the amount of available disk space for filesystems which the user have access to.
Discus is similar to df however it aims to improve df by making it prettier using fancy features as colors, graphs and smart formatting of numbers.
xosview is a classic system monitoring tool and it gives you a simple overview of all the different parts of the including IRQ.
Dstat aims to be a replacement for vmstat, iostat, netstat and ifstat. It allows you to view all of your system resources in real-time. The data can then be exported into csv. Most importantly dstat allows for plugins and could thus be extended into areas not yet known to mankind.
SNMP is the protocol ‘simple network management protocol’ and the Net-SNMP tool suite helps you collect accurate information about your servers using this protocol.
Incron allows you to monitor a directory tree and then take action on those changes. If you wanted to copy files to directory ‘b’ once new files appeared in directory ‘a’ that’s exactly what incron does.
Monitorix is lightweight system monitoring tool. It helps you monitor a single machine and gives you a wealth of metrics. It also has a built-in HTTP server to view graphs and a reporting mechanism of all metrics.
vmstat or virtual memory statistics is a small built-in tool that monitors and displays a summary about the memory in the machine.
This small command that quickly gives you information about how long the machine has been running, how many users currently are logged on and the system load average for the past 1, 5 and 15 minutes.
mpstat is a built-in tool that monitors cpu usage. The most common command is using mpstat -P ALL which gives you the usage of all the cores. You can also get an interval update of the CPU usage.
pmap is a built-in tool that reports the memory map of a process. You can use this command to find out causes of memory bottlenecks.
The ps command will give you an overview of all the current processes. You can easily select all processes using the command ps -A
sar is a part of the sysstat package and helps you to collect, report and save different system metrics. With different commands it will give you CPU, memory and I/O usage among other things.
Similar to sar collectl collects performance metrics for your machine. By default it shows cpu, network and disk stats but it collects a lot more. The difference to sar is collectl is able to deal with times below 1 second, it can be fed into a plotting tool directly and collectl monitors processes more extensively.
iostat is also part of the sysstat package. This command is used for monitoring system input/output. The reports themselves can be used to change system configurations to better balance input/output load between hard drives in your machine.
This is a built-in command that displays the total amount of free and used physical memory on your machine. It also displays the buffers used by the kernel at that given moment.
/Proc file system
The proc file system gives you a peek into kernel statistics. From these statistics you can get detailed information about the different hardware devices on your machine. Take a look at the full list of the proc file statistics
Log Monitoring Tools
GoAccess is a real-time web log analyzer which analyzes the access log from either apache, nginx or amazon cloudfront. It’s also possible to output the data into HTML, JSON or CSV. It will give you general statistics, top visitors, 404s, geolocation and many other things.
Logwatch is a log analysis system. It parses through your system’s logs and creates a report analyzing the areas that you specify. It can give you daily reports with short digests of the activities taking place on your machine.
Much like Logwatch Swatch also monitors your logs, but instead of giving reports it watches for regular expression and notifies you via mail or the console when there is a match. It could be used for intruder detection for example.
MultiTail helps you monitor logfiles in multiple windows. You can merge two or more of these logfiles into one. It will also use colors to display the logfiles for easier reading with the help of regular expressions.
Network Monitoring
acct or psacct (depending on if you use apt-get or yum) allows you to monitor all the commands a users executes inside the system including CPU and memory time. Once installed you get that summary with the command ‘sa’.
Similar to acct this tool monitors users on your system and allows you to see in real time what commands and processes they are using. It gives you a tree structure of all the processes and so you can see exactly what’s happening.
strace is used to diagnose, debug and monitor interactions between processes. The most common thing to do is making strace print a list of system calls made by the program which is useful if the program does not behave as expected.
DTrace is the big brother of strace. It dynamically patches live running instructions with instrumentation code. This allows you to do in-depth performance analysis and troubleshooting. However, it’s not for the weak of heart as there is a 1200 book written on the topic.
Stat is a built-in tool for displaying status information of files and file systems. It will give you information such as when the file was modified, accessed or changed.
ifconfig is a built-in tool used to configure the network interfaces. Behind the scenes network monitor tools use ifconfig to set it into promiscuous mode to capture all packets.
ulimit is a built-in tool that monitors system resources and keeps a limit so any of the monitored resources don’t go overboard.
CPUlimit is a small tool that monitors and then limits the CPU usage of a process. It’s particularly useful to make batch jobs not eat up too many CPU cycles.
This will extract detailed information about the hardware configuration of the machine. It can output everything from CPU version and speed to mainboard configuration.
W is a built-in command that displays information about the users currently using the machine and their processes.
lsof gives you a list of all open files and network connections. From there you can narrow it down to files opened by processes, based on the process name, by a specific user or perhaps kill all processes that belongs to a specific user.
If you want to learn more about server management tools, check out our related blog topics
Top Server Monitoring Tools and Best Practices
Best Free Server Monitoring Tools for Linux and Windows
10 Top Free Server Monitoring Tools for Server Administrators
5 Server Management Tools to Ensure a High Performing Website
ServerAdminz provides Outsourced 24/7 Technical Support, Remote Server Administration, Server Security, Linux Server Management, Windows Server Management and Helpdesk Management to Data centers, Hosting companies and ISPs around the world. We specialize in Extended Server Security, Server Hardening, Support of Linux/UNIX/Windows servers, products and services.
ServerAdminz is a server support company specialized in Outsourced 24/7 Web Hosting Support, Remote Infrastructure Management, NOC, Cloud and Enterprise Security Services. With over 10+ of years of experience in working with major Data Centers and ISPs with 130+ experienced technicians, we continue to manage more than 49,000 servers from 85+ countries and has bagged 5 international awards.
If you have any queries regarding server administration, share your thoughts and our representative will get back to you.
Источник


