- How to Use TRACERT to Troubleshoot TCP/IP Problems in Windows
- Summary
- More Information
- How to Use the TRACERT Utility
- How to Use TRACERT to Troubleshoot
- How to Use TRACERT Options
- How to Run a Traceroute on a Windows 10 Computer
- What Is Traceroute?
- How to Run a Traceroute on a Windows 10 Computer
- How to Read Traceroute Results
- How to Read the Traceroute Columns
- How to Read the Traceroute Rows
- Common Traceroute Error Messages
- Traceroute Command Variations
- How to run a Traceroute on windows 10
How to Use TRACERT to Troubleshoot TCP/IP Problems in Windows
For a Microsoft Windows 2000 version of this article, see 162326.
Summary
This article describes TRACERT (Trace Route), a command-line utility that you can use to trace the path that an Internet Protocol (IP) packet takes to its destination.
This article discusses the following topics:
How to Use the TRACERT Utility
How to Use TRACERT to Troubleshoot
How to Use TRACERT Options
More Information
How to Use the TRACERT Utility
The TRACERT diagnostic utility determines the route to a destination by sending Internet Control Message Protocol (ICMP) echo packets to the destination. In these packets, TRACERT uses varying IP Time-To-Live (TTL) values. Because each router along the path is required to decrement the packet’s TTL by at least 1 before forwarding the packet, the TTL is effectively a hop counter. When the TTL on a packet reaches zero (0), the router sends an ICMP «Time Exceeded» message back to the source computer.
TRACERT sends the first echo packet with a TTL of 1 and increments the TTL by 1 on each subsequent transmission, until the destination responds or until the maximum TTL is reached. The ICMP «Time Exceeded» messages that intermediate routers send back show the route. Note however that some routers silently drop packets that have expired TTLs, and these packets are invisible to TRACERT.
TRACERT prints out an ordered list of the intermediate routers that return ICMP «Time Exceeded» messages. Using the -d option with the tracert command instructs TRACERT not to perform a DNS lookup on each IP address, so that TRACERT reports the IP address of the near-side interface of the routers.
In the following example of the tracert command and its output, the packet travels through two routers (157.54.48.1 and 11.1.0.67) to get to host 11.1.0.1. In this example, the default gateway is 157.54.48.1 and the IP address of the router on the 11.1.0.0 network is at 11.1.0.67.
C:\>tracert 11.1.0.1
The output from the command:
Tracing route to 11.1.0.1 over a maximum of 30 hops
—————————————————
1 2 ms 3 ms 2 ms 157.54.48.1
2 75 ms 83 ms 88 ms 11.1.0.67
3 73 ms 79 ms 93 ms 11.1.0.1
How to Use TRACERT to Troubleshoot
You can use TRACERT to find out where a packet stopped on the network. In the following example, the default gateway has found that there is no valid path for the host on 22.110.0.1. Probably, either the router has a configuration problem, or the 22.110.0.0 network does not exist, reflecting a bad IP address.
C:\>tracert 22.110.0.1
The output from the command:
Tracing route to 22.110.0.1 over a maximum of 30 hops
——————————————————
1 157.54.48.1 reports: Destination net unreachable.
Trace complete.
TRACERT is useful for troubleshooting large networks where several paths can lead to the same point or where many intermediate components (routers or bridges) are involved.
How to Use TRACERT Options
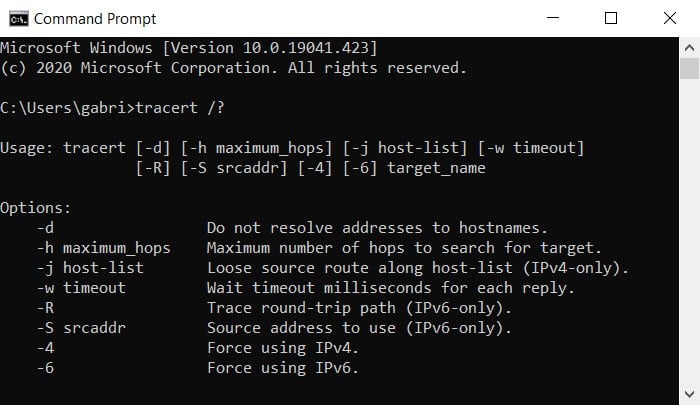
There are several command-line options that you can use with TRACERT, although the options are not usually necessary for standard troubleshooting.
The following example of command syntax shows all of the possible options:
tracert -d -h maximum_hops -j host-list -w timeout target_hostWhat the parameters do:
-d
Specifies to not resolve addresses to host names
-h maximum_hops
Specifies the maximum number of hops to search for the target
-j host-list
Specifies loose source route along the host-list
-w timeout
Waits the number of milliseconds specified by timeout for each
reply
target_host
Specifies the name or IP address of the target host
How to Run a Traceroute on a Windows 10 Computer
If you’re having network connectivity problems, you can run a traceroute to pinpoint exactly where your connection is failing. The traceroute command will provide you with information about your internet connection, website status, and more. Then you can give this information to your technical support representative to resolve your network connectivity issues. Here’s how to run a traceroute on Windows 10 and how to read your traceroute results.
What Is Traceroute?
Traceroute is a network diagnostic tool that tracks the path of a packet of data as it travels from your computer to a destination over the internet. Running a traceroute lets you see where your connection is slow or unresponsive.
You can think of the traceroute tool like a traffic map of your internet connection. When you run a traceroute, you will see all the “hops,” or routers that three separate packets are pushed through on their way to a destination. It will also show you your network’s latency, or how long it took for each packet to travel from one hop to the next.
If you just want to test your network’s latency, check out our step-by-step guide on how to do a ping test on your Windows 10 computer.
How to Run a Traceroute on a Windows 10 Computer
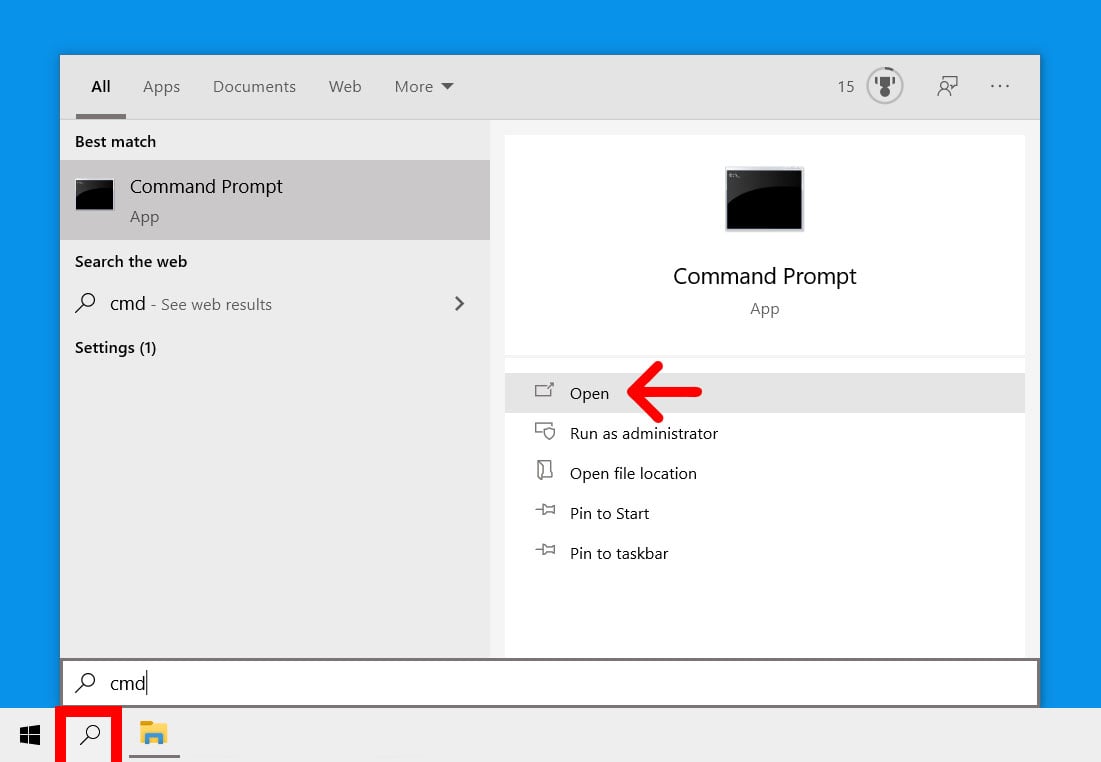
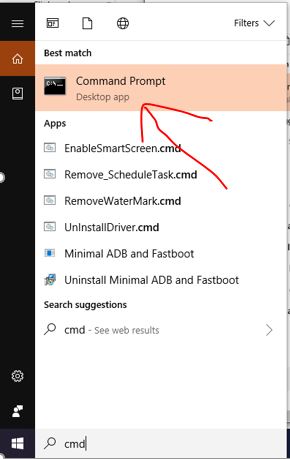
To run a traceroute on a Windows 10 computer, open the Windows search box and type CMD into the search bar. Then open the Command Prompt app and type in tracert followed by a space and then the destination URL or IP address. Finally, hit Enter.
- Open the Windows search box. You can do this by clicking the magnifying glass icon in the bottom-left corner of your screen.
- Then type CMD in the search bar and click Open.

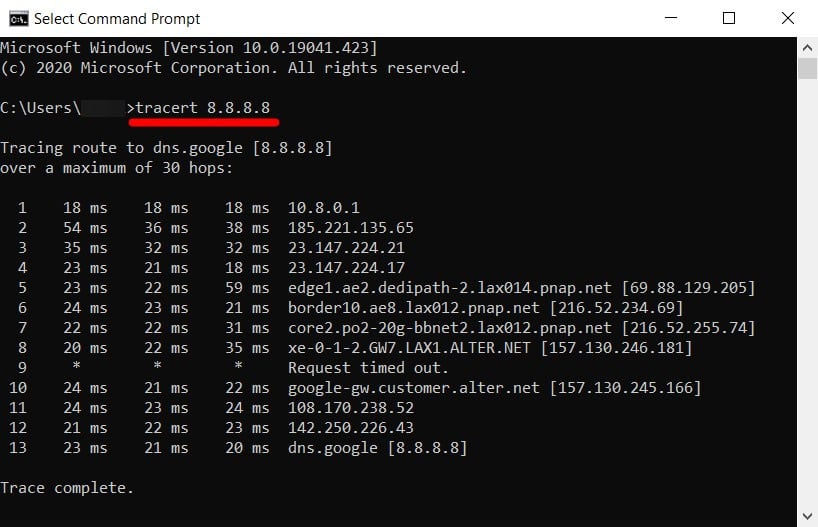
- Next, type tracert followed by a space and then an IP address or URL. If you just want to test your internet connection, it is a good idea to run a traceroute to 8.8.8.8 (Google’s DNS server). You can also run a traceroute to the URL of any website or IP address. Just make sure you leave a space after tracert and before the URL or IP address. For example, to run a traceroute to HelloTech.com, you would type tracert hellotech.com into the Command Prompt app.
- Finally, press Enter on your keyboard and wait for the traceroute to finish. You will see the words Trace complete when the process is finished. You can also stop a traceroute at any time by pressing the Control + C keys on your keyboard at the same time.
To copy the traceroute results, left-click and drag your mouse to select the traceroute results. Then press Enter on your keyboard. Next, open a document or text file and paste the traceroute results there.

How to Read Traceroute Results
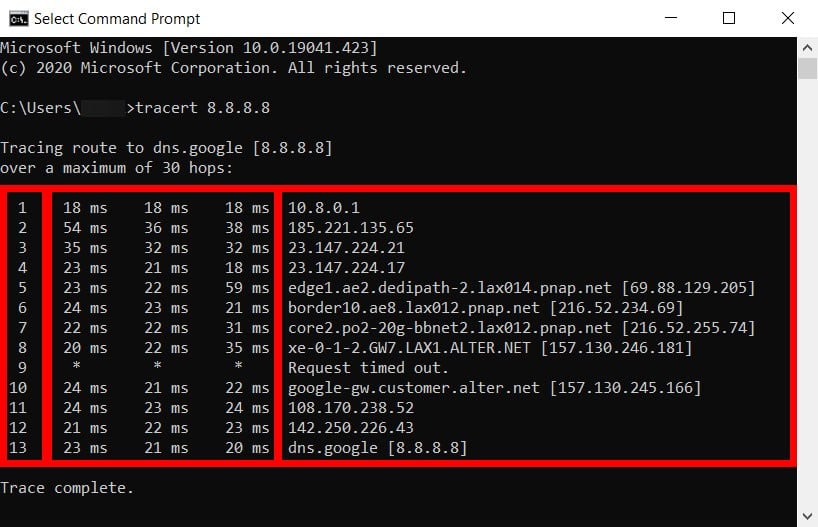
To read your traceroute results, look for the round trip time (RTT) in columns two through four. If you see any hops that took a long time or there is an error message in any of the rows, that might be where you have network connectivity problems.
How to Read the Traceroute Columns
- Column 1: This represents the hop number, or the number of hops that the three data packets were pushed through to reach the destination.
- Columns 2-4: These show the round trip time measured in milliseconds. RTT represents the time it took for a data packet to travel from the source to the destination and back again. To check for the consistency of the response times, the traceroute command sends three packets to each hop, which is why there are three time values listed per row. RTT values below 100 milliseconds are acceptable. However, if you see RTT values consistently increasing from the middle hop to the destination, it could be due to a network problem.
- Column 5: This column shows the name or IP address of the routers on every hop from your computer to the destination. It will also list the domain name of the router, if that information is available.
How to Read the Traceroute Rows
The traceroute results will show you the IP addresses for different points in the route. The addresses in the first few rows are from your source network, the middle hops are from internet service providers (ISPs), while the last ones are those near the destination.
- Local router. The first lines of the traceroute results will indicate your gateway’s IP address. In most cases, the first line will be your router’s IP address, which usually starts with 192.168.XXX.Xor 10.0.XXX.X. However, there are other router manufacturers that will have default IP addresses that start with other numbers. To find out which row your router is on, check out our guide on how to find your router’s IP address, and then compare it to your traceroute results.
- PoP router. A Point of Presence (PoP) is the local access point of your ISP. This access point helps your device establish a connection with the internet.
- Source Tier 2 ISP Network. Your request might be routed to a regional ISP (like Comcast or Cox), which services a limited geographic area. They pay Tier 1 providers for connectivity but also have agreements with other Tier 2 providers to exchange traffic directly. You might see your ISP provider’s name in lines three or four of the traceroute results.
- IXP. An Internet Exchange Point (IXP) is a physical location where ISPs and other network providers connect to exchange internet traffic. Here, administrators make routing decisions based on hop counts and other factors.
- Tier 1 ISP Network. These ISP providers are considered the backbone of the internet because they own the infrastructure to carry most of the traffic themselves. Tier 1 providers include AT&T, Sprint, and Verizon.
- Destination Tier 2 ISP Network. This is the regional ISP closest to the data packet’s destination and can appear in the second to the last line of the traceroute results.
- Destination Web Server. This is the last line in the traceroute results before the “Trace complete” message.
Common Traceroute Error Messages
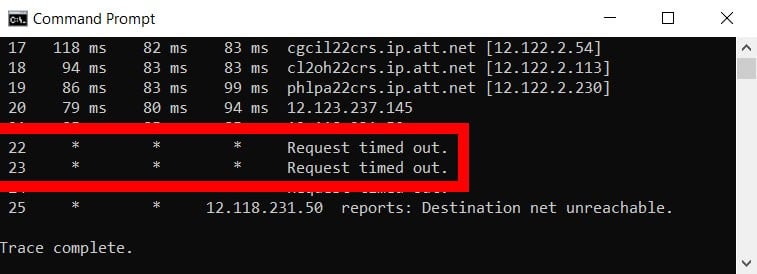
If there is an issue within the network, the traceroute results will also show error commands, which include Request timed out, Destination unreachable, * in RTT columns, and more.
- Request timed out: Seeing this error at the end of the traceroute means that a firewall or a security device might be blocking your request, or there was a problem in the return route. If you see this at the beginning, it’s nothing to worry about as it is a common hop.
- Destination net unreachable: This means that the data packets have stopped traveling within the network. Most of the time, this is because there is a problem with the router or that the website or IP address you are trying to reach is down.
- * in RTT columns: It means the router did not respond to the request within the maximum allotted time of two seconds. It could also mean that the router in the hop was not set up to provide a response to a traceroute request. However, it does not necessarily mean that the packet was dropped. To verify if there was a packet loss, you can ping the IP address of the router where you see the asterisk.
Traceroute Command Variations
If you are looking for ways to run a traceroute, you can open the Command Prompt app and type tracert /? to see variations you can use.
Now that you know how to run a traceroute on your Windows 10 computer, check out our article on how to boost your WiFi signal.
How to run a Traceroute on windows 10
In this tutorial, we let you know how to run a Traceroute on Windows 10, Windows 8, Windows 7 or Vista/XP using Command prompt.
What is Traceroute?
It is a tool to check the route (Path) and measure the transit delay packets across Internet Protocol (IP) network. In general language, traceroute tool allows the user to trace the routing of the data packets triggers from your PC to destination pc or device.
You can use the traceroute command on Windows system easily using the command prompt and on Unix-like systems such as FreeBSD, macOS, and Linux it is available as a command line tool too. Sometimes for Internet Protocol Version 6 (IPv6) traceroute called as traceroute6 or tracert6.
So, let’s see how to run traceroute command in Windows 10,8, & 7 using the command prompt.
- To Run traceroute first go to Windows 10 system.
- Open the Command prompt either by start button or type the CMD in the search box of the Windows 10
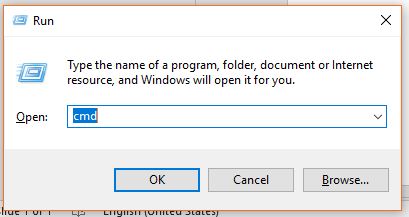
- Another method to open the command prompt is using the Run box. Press Win+R and type CMD and then press the Enter button.
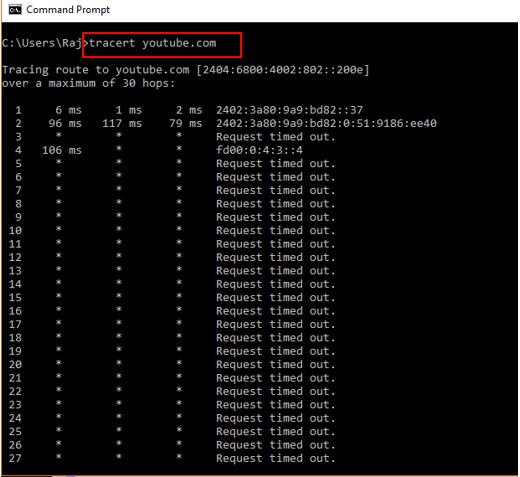
- When the CMD opens type tracert along with the IP or Host you want to trace.
- For example tracert google.com or tracert 192.168.5.5
- The Traceroute will take maximum around 30 hops.
Tutorial with screenshots:
Step 1: Go to the search box of your Windows 10/8/7 operating system and type CMD. Click on the Command prompt when it appears.
You can also use the run box to access the Windows command prompt. Just press the Windows key + R from your keyboard, type CMD and hit the enter button.
Step 2: Running the Traceroute tool on Windows is a piece of cake. You just need to type the tracert followed by the hostname or IP address. For more info please refer the below-given screenshot.
The traceroute command on Windows can be used with further parameters to get more out of it.


