- Лучшие программы для учета трафика в Windows
- BitMeter II
- GabNetStats
- NetSpeedMonitor
- NetTraffic
- Networx
- Сравнительная таблица
- Show traffic для windows
- System Requirements
- Start Using NetworkTrafficView
- Change the Grouping Mode
- IP Address Country/City Information
- Integration with IPNetInfo utility
- Columns Description
- Command-Line Options
Лучшие программы для учета трафика в Windows
Если вы хотите выяснить, какой объем трафика потребляет компьютер Windows за определенное время, то вам нужно воспользоваться сторонними решениями. В Диспетчере задач или в Мониторе ресурсов доступны только текущие значения потребления сети, поэтому данные инструменты не подходят для мониторинга трафика за конкретный период. Некоторые роутеры и модемы собирают данные о потребляемом трафике – просмотреть эти значения можно обратившись к панели администратора устройства.
Зачем вообще вести мониторинг потребляемого трафика? Учет трафика просто необходим при использовании лимитных Интернет-подключений, но он может быть также полезен на безлимитных тарифах.
Некоторые Интернет-провайдеры ограничивают месячный трафик на определенных тарифах. При превышении лимитов пользователю либо нужно заплатить за дополнительную квоту, либо довольствоваться сниженной скоростью соединения до конца отчетного периода. Мониторинг трафика позволяет избежать подобных неприятных ситуаций.
Анализ трафика позволяет вам лучше понять, какой объем данных вы потребляете за отчетный период. Эта информация будет полезной при смене Интернет-провайдера или тарифного плана.
Представленные ниже инструменты предназначены для учета трафика на компьютерах Windows. Все программы являются бесплатными, а их тестирование выполнялось на компьютерах под управлением Windows 7 и Windows 10.
BitMeter II
BitMeter II – бесплатная утилита для мониторинга трафика в Windows. Программа отслеживает ежедневное, еженедельное и ежемесячное потребление трафика и показывает виджет на рабочем столе с визуализацией процессов передачи и приема данных.
Пользователям доступна настройка оповещений, установка ограничений провайдера и расчет трафика с помощью встроенного калькулятора. BitMeter II позволяет запустить счетчик, во время работы которого можно отслеживать различные метрики подключения.
В разделе Статистика отображаются данные потребления трафика за последние несколько часов, дней и месяцев. Просмотреть их можно в графическом или табличном виде.
GabNetStats
Gab NetStats – портативная программа для устройств Microsoft Windows, которая позволяет отслеживать потребляемый трафик и другие показатели. Программа запустилась без сбоев на всех тестовых системах и сразу же приступила к отслеживанию трафика.
Левый клик по иконки системного трея открывает график и статистику по трафику. Виджет закрывается автоматически через пять секунд, но вы можете изменить данное поведение и активировать постоянное отображение виджета на рабочем столе.
Программа отслеживает отправленные и полученные байты данных, среднюю скорость подключения и многие другие параметры. Выберите расширенную статистику (Advanced Statistics), чтобы посмотреть общее количество полученных и отправленных пакетов, количество маршрутов и IP-адресов, а также информацию о конфигурации TCP/IP.
NetSpeedMonitor
Веб-сайт разработчика больше недоступен, но вы можете загрузить программу с нашего сайта.
Примечание: для установки данной программы в новых версиях Windows 10 рекомендуется настроить совместимость с более ранними версиями Windows. Для этого кликните правой кнопкой мыши по скачанному файлу и выберите Свойства > Совместимость > Запустить программу в режиме совместимость с: Предыдущая версия Windows.
NetSpeedMonitor показывает входящий и исходящий трафик в области уведомлений панели задач (системном трее). Наведите курсор мыши на иконку, чтобы посмотреть трафик за конкретный сеанс, день или месяц. Клик правой кнопкой мыши открывает доступные параметры и интерфейс статистики трафика за определенный период.
NetTraffic
Программа NetTraffic доступна в виде отдельного установщика и портативной версии. Утилита полностью совместима со всеми современными версиями Windows.
Примечание: портативная версия выдала ошибку в Windows 10 при попытке запуска без прав администратора.
При запуске NetTraffic отображает на рабочем столе график активности сети с количеством отправленных и принятых данных. По умолчанию окно всегда отображается на переднем плане, но вы можете отключить данный режим, изменить размеры окна и другие параметры работы.
Правый клик по иконке в системном трее открывает доступ к параметрам, статистике и дополнительным инструментам. В разделе статистики можно посмотреть потребление трафика за выбранный период или за отдельные интервалы времени: месяц, день или год.
В настройках можно изменить дизайн виджета и задать квоту по объему трафика. Среди доступных сетевых утилит: ipconfig, netstat и route.
Networx
Программа Networx распространялась на бесплатной основе, теперь новые версии стали платными. При этом прошлая, бесплатная версия утилиты (Networx 5.5.5) до сих пор доступна для загрузки на нашем сайте и не имеет ограничений по функциональности.
Сразу после запуска Networx приступает к мониторингу потребления трафика, а в системном трее появляется иконка приложения. Двойной клик по иконке открывает статистику: вы можете просмотреть общие данные, а также данные за день, неделю, месяц, разбивку данных по приложениям. Для удобства разные представления данных размещены на отдельных вкладках.
Вы можете использовать программу для мониторинга трафика, потребляемого отдельными приложениями. Для этого перейдите в Настройки > Общие и в разделе Наблюдать подключения включите параметр Игнорировать локальный трафик (в пределах сети).
Кликните правой кнопкой мыши по значку в системном трее, чтобы получить доступ к дополнительным функциям. Вы можете включить отображение виджета на рабочем столе, чтобы отслеживать потребления трафика в режиме реального времени, запустить измерение скорости соединения или открыть экран установки квот.
Пользователям доступно несколько сетевых инструментов, таких как trace route или ping.
Сравнительная таблица
| Название | Мониторинг | Квота | Виджет | Другие функции |
|---|---|---|---|---|
| BitMeter II | день, неделя, месяц | да | да | Калькулятор, Счетчик |
| GabNetStats | только в режиме реального времени | нет | да | Сетевая информация |
| NetSpeedMonitor | день, месяц | нет | нет | Подключения |
| NetTraffic | день, месяц, год | да | да | Сетевые инструменты |
| Networx | день, неделя, месяц, по приложениям | да | да | Сетевые инструменты, измерение скорости, оповещения, отчеты |
К сожалению, некоторые из перечисленных инструментов больше не поддерживаются. Без сомнений, Networx является самым профессиональным решением для мониторинга трафика с мощной функциональностью, но бесплатная версия утилиты также больше не поддерживается разработчиком.
В то же время, стоит отметить, что Microsoft тестирует встроенный инструмент Использование данных в Windows 10 (версия 2003), выход которой ожидается весной 2020 года.
Show traffic для windows
Total Data Size»
- Fixed bug: When opening the ‘Capture Options’ dialog-box after Network Monitor Driver 3.x was previously selected, NetworkTrafficView switched back to Raw Sockets mode.
- Fixed NetworkTrafficView to sort Ipv4 addresses correctly.
- Added option to filter by the duration of every packets statistics line (In ‘Display Filter Options’ window).
- Added option to choose the displayed speed unit: kB/Sec, KiB/Sec, MB/Sec, MiB/Sec, or Mbps.
- The speed filter now allows you to specify non-interger values (e.g: 0.5 KB/Sec)
- Fixed the problem with Windows 2000 appeared on version v1.30
- Added new option: ‘Display only items with speed above. ‘ (In Display Filter Options window)
- Added new option: Display only items with minimum number of packets (In Display Filter Options window)
- Added ‘Source Country’ and ‘Destination Country’ columns, which displays the country of the specified IPv4 addresses. In order to activate this feature, you have to download the IP to countries file from this Web page, and then put the downloaded IpToCountry.csv file in the same folder of the .exe file.
- Fixed the accelerator key of ‘Stop Capture’ (F6)
- Added ‘Start As Hidden’ option. When this option and ‘Put Icon On Tray’ option are turned on, the main window of NetworkTrafficView will be invisible on start.
- Added 5 new columns which counts the flags of all TCP packets: TCP Ack, TCP Push, TCP Reset, TCP Syn, and TCP Fin.
- Added ‘Put Icon On Tray’ option.
- Added new general grouping mode: Group by process.
System Requirements
- This utility works on any version of Windows, starting from Windows 2000 and up to Windows 10, including 64-bit systems.
- One of the following capture drivers is required to use NetworkTrafficView:
- Npcap capture driver Npcap is an open source capture driver based on the discontinued WinPcap library that allows you to capture network packets on any version of Windows. You can download and install the Npcap driver from this Web page.
- Microsoft Network Monitor Driver version 2.x (Only for Windows 2000/XP/2003): Microsoft provides a free capture driver under Windows 2000/XP/2003 that can be used by NetworkTrafficView, but this driver is not installed by default, and you have to manually install it, by using one of the following options:
- Option 1: Install it from the CD-ROM of Windows 2000/XP according to the instructions in Microsoft Web site
- Option 2 (XP Only) : Download and install the Windows XP Service Pack 2 Support Tools. One of the tools in this package is netcap.exe. When you run this tool in the first time, the Network Monitor Driver will automatically be installed on your system.
- Microsoft Network Monitor Driver version 3.x: Microsoft provides a new version of Microsoft Network Monitor driver (3.x) that is also supported under Windows 7/Vista/2008.
The new version of Microsoft Network Monitor (3.x) is available to download from Microsoft Web site.
- You can also try to use NetworkTrafficView without installing any driver, by using the ‘Raw Sockets’ method. Unfortunately, Raw Sockets method has many problems:
- It doesn’t work in all Windows systems, depending on Windows version, service pack, and the updates installed on your system. On some systems, Raw Sockets works only partially and captures only the incoming packets. On some other systems, it doesn’t work at all.
- On systems that ‘Raw Sockets’ method works properly, it can only capture IPv4 TCP/UDP packets. It cannot capture other type of packets, like the other capture drivers.
- On Windows 7 with UAC turned on, ‘Raw Sockets’ method only works when you run NetworkTrafficView with ‘Run As Administrator’.
Start Using NetworkTrafficView
After running NetworkTrafficView in the first time, the ‘Capture Options’ window appears on the screen, and you’re requested to choose the capture method and the desired network adapter. In the next time that you use NetworkTrafficView, it’ll automatically start capturing packets with the capture method and the network adapter that you previously selected. You can always change the ‘Capture Options’ again by pressing F9.
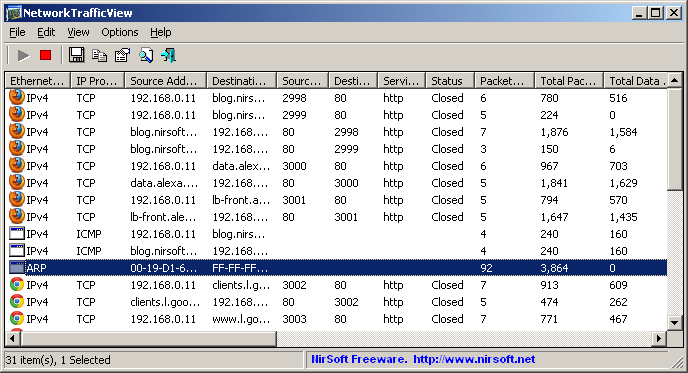
After choosing the capture method and network adapter, NetworkTrafficView starts to display your current network traffic, grouped by the Ethernet Type, IP Protocol, Source/Destination Addresses, and Source/Destination ports.
You can press F6 to stop the network traffic capture, F5 to start it again, or Ctrl+X to clear the current network traffic statistics.
Change the Grouping Mode
IP Address Country/City Information
Integration with IPNetInfo utility
Columns Description
- Ethernet Type: Displays the Ethernet type — IPv4, IPv6, ARP, and so on.
- IP Protocol: Displays the IP protocol, when the Ethernet type is IPv4 or IPv6 — TCP, UDP, ICMP, and so on.
- Source/Destination Address: Displays the source and destination addresses of this packets summary line. For non-IP packets (like ARP), the MAC addresses are displayed. For IP packets (IPv4 or IPv6), the IP addresses or host names are displayed.
- Source/Destination Port: For TCP lines, the port numbers of the TCP connection are displayed.
- Service Name: For TCP lines, displays the service name (http, https, ftp, and so on) according to the lower port number.
- Status: For TCP lines, displays whether the TCP connection is opened or closed. Be aware that by default, the ‘Hide Closed TCP Connection’ option is turned on, which means that closed connections are automatically hidden, unless you turn off the ‘Hide Closed TCP Connection’ option.
- Packets Count: The number of packets counted for the specified packets group.
- Total Packets Size: The total size of all packets (in bytes), including the packet headers, for the specified packets group.
- Total Data Size: The total size of the data of all packets (in bytes), excluding the Ethernet and TCP/IP headers, for the specified packets group.
- Data Speed: The current data speed for the specified packets group, in KB/Sec.
- Maximum Data Speed: The maximum data speed recorded by NetworkTrafficView for the specified packets group.
- Average Packet Size: The average packet size (in bytes) of the specified packets group.
- First Packet Time: The date/time that the first packet of the specified packets group was captured.
- Last Packet Time: The date/time that the last packet of the specified packets group was captured.
- Duration: The difference between the first packet time and the last packet time.
- Process ID: The process ID of the specified TCP connection.
- Process Name: The process .exe name of the specified TCP connection.
Command-Line Options
| /cfg | Start NetworkTrafficView with the specified configuration file. For example: NetworkTrafficView.exe /cfg «c:\config\ntv.cfg» NetworkTrafficView.exe /cfg «%AppData%\NetworkTrafficView.cfg» |
| /load_file_pcap | Loads the specified capture file, created by WinPcap driver. |
| /load_file_netmon | Loads the specified capture file, created by Network Monitor driver 3.x. |
| /CaptureTime | Specifies the number of seconds to capture the traffic, when using one of the save command-line options (/stext, /stab, and so on. ) If you don’t specify this command-line option, the default capture time is 10 seconds. If you specify ‘0’, the capture will continue until running NetworkTrafficView with /StopCommandLineCapture command-line option. |
| /LoadConfig | Loads the specified configuration file. |
| /SaveToFileInterval | Saves the capture result every xx seconds. |
| /StopCommandLineCapture | Stops a command-line capture that is currently running and saves all captured information to a file |
| /stext | Save the network traffic information into a simple text file. |
| /stab | Save the network traffic information into a tab-delimited text file. |
| /scomma | Save the network traffic information into a comma-delimited text file (csv). |
| /stabular | Save the network traffic information into a tabular text file. |
| /shtml | Save the network traffic information into HTML file (Horizontal). |
| /sverhtml | Save the network traffic information into HTML file (Vertical). |
| /sxml | Save the network traffic information into XML file. |
| /sort | This command-line option can be used with other save options for sorting by the desired column. If you don’t specify this option, the list is sorted according to the last sort that you made from the user interface. The parameter can specify the column index (0 for the first column, 1 for the second column, and so on) or the name of the column, like «Source Address» and «Packets Count». You can specify the ‘ |
‘ prefix character (e.g: «
Total Data Size») if you want to sort in descending order. You can put multiple /sort in the command-line if you want to sort by multiple columns.


