- 15 simple TOP command examples on Linux to monitor processes
- Linux TOP command
- Note your «top» command variant
- 1. Display processes
- 2. Sort by Memory/Cpu/Process ID/Running Time
- 3. Reverse the sorting order — ‘R’
- 4. Highlight the sorted column with bold text — ‘x’
- 5. Highlight sorted column background color ‘b’
- 6. Change the update delay — ‘d’
- 7. Filter or Search processes — ‘o’/’O’
- 8. Display full command path and arguments of process — ‘c’
- 9. View processes of a user — ‘u’/’U’
- 10. Toggle the display of idle processes — ‘i’
- 11. Hide/Show the information on top — ‘l’, ‘t’, ‘m’
- 12. Forest mode — ‘V’
- 13. Change the number of processes to display — ‘n’
- 14. Display all CPU cores — ‘1’
- 15. Show/Hide columns ‘f’
- 16. Batch mode
- 17. Split output in multiple panels — ‘A’
- Conclusion
- 10 thoughts on “ 15 simple TOP command examples on Linux to monitor processes ”
- Linux top command
- Syntax
- Options
- Summary Display
- Uptime and Load Averages
- Task and CPU States
- Memory Usage
- Fields / Columns
- CGROUPS — Control Groups
- Managing Fields
- Interactive Commands
- Global Commands
- Summary Area Commands
- Task Area Commands
- Appearance Of Task Window
- Content Of Task Window
- Size Of Task Window
- Sorting Of Task Window
- Alternate-Display Provisions: Microsoft Windows
- Field Groups/Windows
- Current Window
- Commands for Windows
- Scrolling a Window
- Searching in a Window
- Files
- System Configuration File
- Personal Configuration File
- Tips And Tricks
- Kernel Magic
- Bouncing Windows
- The Big Bird Window
- Related commands
15 simple TOP command examples on Linux to monitor processes
Linux TOP command
One of the most basic command to monitor processes on Linux is the top command. As the name suggests, it shows the top processes based on certain criterias like cpu usage or memory usage.
The processes are listed out in a list with multiple columns for details like process name, pid, user, cpu usage, memory usage.
Apart from the list of processes, the top command also shows brief stats about average system load, cpu usage and ram usage on the top.
This post shows you some very simple examples of how to use the top command to monitor processes on your linux machine or server.
Note your «top» command variant
Be aware that the top command comes in various variants and each has a slightly different set of options and method of usage.
To check your top command version and variant use the -v option
This post focuses on the top command coming from the procps-ng project. This is the version available on most modern distros like Ubunut, Fedora, CentOS etc.
1. Display processes
To get a glimpse of the running processes, just run the top command as is without any options like this.
And immediately the output would be something like this —
The screen contains a lot of information about the system. The header areas include uptime, load average, cpu usage, memory usage data.
The process list shows all the processes with various process specific details in separate columns.
Some of the column names are pretty self explanatory.
PID — Process ID
USER — The system user account running the process.
%CPU — CPU usage by the process.
%MEM — Memory usage by the process
COMMAND — The command (executable file) of the process
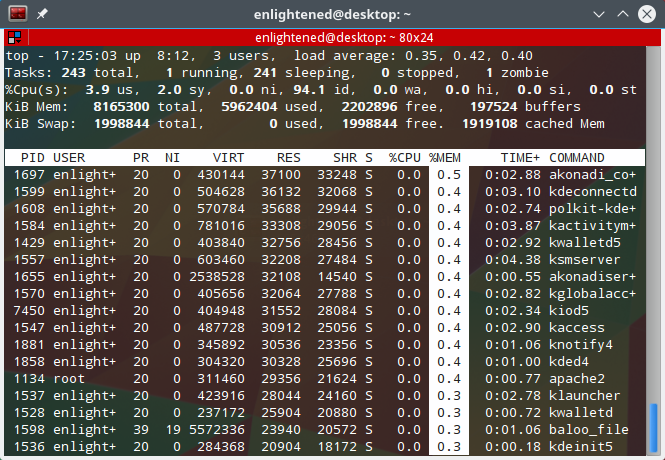
2. Sort by Memory/Cpu/Process ID/Running Time
To find the process consuming the most cpu or memory, simply sort the list.
Press M key ( yes, in capital, not small ) to sort the process list by memory usage. Processes using the most memory are shown first and rest in order.
Here are other options to sort by CPU usage, Process ID and Running Time —
Press ‘P’ — to sort the process list by cpu usage.
Press ‘N’ — to sort the list by process id
Press ‘T’ — to sort by the running time.
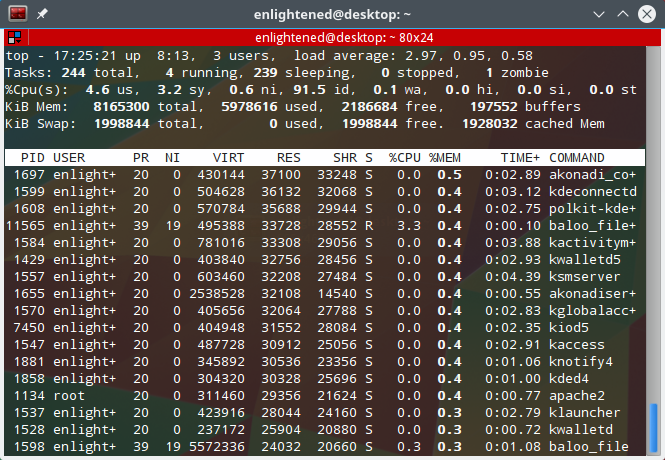
3. Reverse the sorting order — ‘R’
By default the sorting is done in descending order. Pressing ‘R’ shall reverse the sorting order of the currently sorted column
Here is the output sorted in ascending order of cpu usage. Processes consuming the least amount of cpu are shown first.
4. Highlight the sorted column with bold text — ‘x’
Press x, to highlight the values in the sort column with bold text. Here is a screenshot, with the memory column in bold text —
top command highlight column
5. Highlight sorted column background color ‘b’
After highlighting the sorted column with bold font, its further possible to highlight with a different background color as well. This is how it looks
Top command highlight column background
6. Change the update delay — ‘d’
The top command updates the information on the screen every 3.0 seconds by default. This refresh interval can be changed.
Press the ‘d’ key, and top will ask you to enter the time interval between each refresh. You can enter numbers smaller than 1 second as well, like 0.5. Enter the desired interval and hit Enter.
7. Filter or Search processes — ‘o’/’O’
You can filter the process list based on various criterias like process name, memory usage, cpu usage etc. Multiple filter criterias can be applied.
Press the ‘o’ or ‘O’ to activate filter prompt. It will show a line indicating the filter format like this —
Then enter a filter like this and hit Enter.
COMMAND=apache
Now top will show only those processes whose COMMAND field contains the value apache.
Here is another filter example that shows processes consuming CPU actively —
%CPU>0.0
See active filters — Press Ctrl+o to see currently active filters
Clear filter — Press ‘=’ key to clear any active filters
8. Display full command path and arguments of process — ‘c’
Press ‘c’ to display the full command path along with the commandline arguments in the COMMAND column.
9. View processes of a user — ‘u’/’U’
To view the processes of a specific user only, press ‘u’ and then top will ask you to enter the username.
Which user (blank for all)
Enter the desired username and hit Enter.
10. Toggle the display of idle processes — ‘i’
Press ‘i’ to toggle the display of idle/sleeping processes. By default all processes are display.
11. Hide/Show the information on top — ‘l’, ‘t’, ‘m’
The ‘l’ key would hide the load average information.
The ‘m’ key will hide the memory information.
The ‘t’ key would hide the task and cpu information.
Hiding the header information area, makes more processes visible in the list.
12. Forest mode — ‘V’
Pressing ‘V’ will display the processes in a parent child hierarchy. It looks something like this —
13. Change the number of processes to display — ‘n’
Lets say you want to monitor only few processes based on a certain filter criteria. Press ‘n’ and enter the number of processes you wish to display.
It will display a line saying —
Maximum tasks = 0, change to (0 is unlimited)
14. Display all CPU cores — ‘1’
Pressing ‘1’ will display the load information about individual cpu cores. Here is how it looks —
15. Show/Hide columns ‘f’
By default top displays only few columns out of many more that it can display. If you want to add or remove a particular column or change the order of columns, then press f
The fields marked * or bold are the fields that are displayed, in the order in which they appear in this list.
Navigate the list using up/down arrow keys and press ‘d’ to toggle the display of that field. Once done, press q to go back to the process list
The following output displays only PID, USER, CPU, MEMORY and COMMAND columns.
16. Batch mode
Top also supports batch mode output, where it would keep printing information sequentially instead of a single screen. This is useful when you need to log the top output for later analysis of some kind.
Here is a simple example that shows the Cpu usage at intervals of 1 second.
17. Split output in multiple panels — ‘A’
Each panel can be sorted on a different column. Press ‘a’ to move through the panels. Each panel can have a different set of fields displayed and different sort columns.
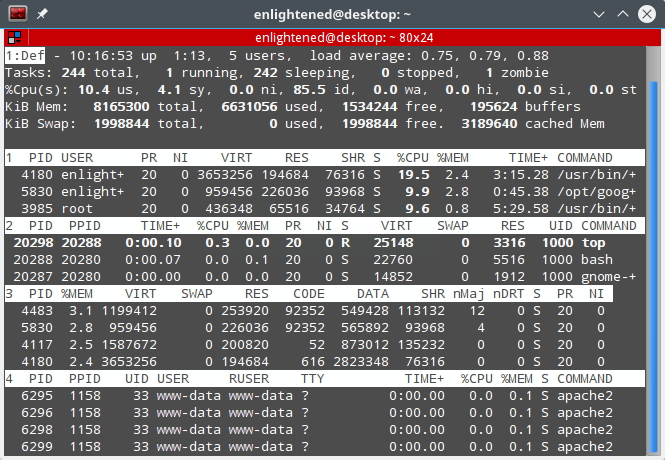
top command multiple panels
Conclusion
Top is a great commandline tool to check system resource usage and process details. Its often used on servers for monitoring and quick diagnosis.
If you are looking for something easier with a better user interface then try htop. Htop has a intuitive user interface, where you need not memorize keyboard shortcuts. Htop has onscreen instructions that guide you on how to use it.
A Tech Enthusiast, Blogger, Linux Fan and a Software Developer. Writes about Computer hardware, Linux and Open Source software and coding in Python, Php and Javascript. He can be reached at [email protected] .
10 thoughts on “ 15 simple TOP command examples on Linux to monitor processes ”
Nice article and great explanation.
if same user id is running multiple times how to delete all others except one.Please any one reply me fast.
exp
PID USER PR %cpu
QPD02201
QPD02201
QPD02201
QPD02201
A really top article!
Hi, thanks for the great article but I’m still looking for an answer for my case: It looks like that all the time. CPU load is around 45-50% all the time but if I add up the CPU usage of the services it never gets close… Why’s that?
Tasks: 251 total, 1 running, 250 sleeping, 0 stopped, 0 zombie
%Cpu0 : 50,1 us, 10,1 sy, 0,0 ni, 39,8 id, 0,0 wa, 0,0 hi, 0,0 si, 0,0 st
%Cpu1 : 55,7 us, 7,2 sy, 0,0 ni, 36,8 id, 0,0 wa, 0,0 hi, 0,2 si, 0,0 st
%Cpu2 : 35,6 us, 4,4 sy, 0,0 ni, 58,8 id, 0,0 wa, 0,0 hi, 1,2 si, 0,0 st
%Cpu3 : 36,7 us, 5,8 sy, 0,0 ni, 56,9 id, 0,0 wa, 0,0 hi, 0,6 si, 0,0 st
KiB Mem : 16242248 total, 12711832 free, 2071424 used, 1458992 buff/cache
KiB Swap: 3809276 total, 3809276 free, 0 used. 13807884 avail Mem
PID USER PR NI VIRT RES SHR S %CPU %MEM TIME+ COMMAND
9066 root 20 0 830468 35332 25632 S 2,2 0,2 2:19.18 metricbeat
5428 www-data 20 0 72168 27716 2520 S 1,2 0,2 3:28.49 kix.Daemon.pl
590 kopano 20 0 291488 41016 24640 S 0,6 0,3 1:27.52 kopano-search
581 kopano 20 0 355280 38644 18984 S 0,4 0,2 1:27.69 kopano-presence
7 root 20 0 0 0 0 S 0,2 0,0 0:31.24 rcu_sched
580 root 20 0 250116 4332 2508 S 0,2 0,0 0:01.37 rsyslogd
821 postgres 20 0 268376 6448 4688 S 0,2 0,0 0:00.07 postgres
1569 mysql 20 0 739704 114760 17024 S 0,2 0,7 0:38.78 mysqld
1802 root 20 0 392128 12028 6828 S 0,2 0,1 0:08.35 docker-containe
1875 root 20 0 3125288 23428 9428 S 0,2 0,1 0:40.27 slapd
2043 root 20 0 818760 70340 28176 S 0,2 0,4 0:37.41 named
2686 kdm 20 0 392288 59108 33904 S 0,2 0,4 0:29.23 kdm_greet
2871 root 20 0 4822492 437276 23464 S 0,2 2,7 2:01.74 java
9560 root 20 0 588668 69552 22952 S 0,2 0,4 0:40.12 packetbeat
10650 root 20 0 38144 3588 3012 R 0,2 0,0 0:04.37 top
Maybe it looks better like this
%Cpu0 : 50,1 us, 10,1 sy,
%Cpu1 : 55,7 us, 7,2 sy,
%Cpu2 : 35,6 us, 4,4 sy,
%Cpu3 : 36,7 us, 5,8 sy,
Источник
Linux top command

On Unix-like operating systems, the top program provides a dynamic real-time view of a running system. It can display system summary information, as well as a list of processes or threads currently being managed by the kernel. The types of system summary information shown and the types, order and size of information displayed for tasks are all user-configurable.
This page covers the Linux version of top.
Syntax
Options
The typically mandatory switches (‘—‘) and even whitespace are completely optional.
| -h | -v | Help/Version |
Show library version and the usage prompt, then quit.
Starts top in ‘Batch’ mode, which could be useful for sending output from top to other programs or to a file. In this mode, top will not accept input and runs until the iterations limit you’ve set with the ‘-n‘ command-line option, or until killed.
Starts top with the last remembered ‘c‘ state reversed. Thus, if top was displaying command lines, now that field will show program names, and visa versa. See the ‘c‘ interactive command for additional information.
Specifies the delay between screen updates, and overrides the corresponding value in one’s personal configuration file or the startup default. Later this can be changed with the ‘d‘ or ‘s‘ interactive commands.
Fractional seconds are honored, but a negative number is not allowed. In all cases, however, such changes are prohibited if top is running in ‘Secure mode’, except for root (unless the ‘s‘ command-line option was used).
Instructs top to display individual threads. Without this command-line option a summation of all threads in each process is shown. Later this can be changed with the ‘H‘ interactive command.
Starts top with the last remembered ‘i‘ state reversed. When this toggle is Off, tasks that have not used any CPU since the last update will not be displayed.
Specifies the maximum number of iterations, or frames, top should produce before ending.
Monitor only processes with specified process IDs. This option can be given up to 20 times, or you can provide a comma delimited list with up to 20 pids. Co-mingling both forms is permitted.
A pid value of zero will be treated as the process id of the top program itself (once it is running).
This command-line option only and should you want to return to normal operation, it is not necessary to quit and restart top — just issue any of these interactive commands: ‘=‘, ‘u‘ or ‘U‘.
The ‘p‘, ‘u‘ and ‘U‘ command-line options are mutually exclusive.
Starts top with secure mode forced, even for root. This mode is far better controlled through the system configuration file (see topic 6. FILES).
Starts top with the last remembered ‘S‘ state reversed. When ‘Cumulative time’ mode is On, each process is listed with the cpu time that it and its dead children have used. See the ‘S‘ interactive command for additional information regarding this mode.
-U user-id-or-name
Display only processes with a user id or user name matching that given. The ‘-u‘ option matches the effective user whereas the ‘-U‘ option matches on any user (real, effective, saved, or filesystem).
The ‘p‘, ‘u‘ and ‘U‘ command-line options are mutually exclusive.
In ‘Batch’ mode, when used without an argument top will format output using the COLUMNS= and LINES= environment variables, if set. Otherwise, width will be fixed at the maximum 512 columns. With an argument, output width can be decreased or increased (up to 512) but the number of rows is considered unlimited.
In normal display mode, when used without an argument top will attempt to format output using the COLUMNS= and LINES= environment variables, if set. With an argument, output width can only be decreased, not increased. Whether using environment variables or an argument with -w, when not in ‘Batch’ mode actual terminal dimensions can never be exceeded.
Note: Without the use of this command-line option, output width is always based on the terminal at which top was invoked whether or not in ‘Batch’ mode.
Summary Display
Each of the following areas are individually controlled through interactive commands.
Uptime and Load Averages
This section consists of a single line displaying the following:
- program or window name, depending on display mode
- current time and length of time since last boot
- total number of users
- system load avg over the last 1, 5 and 15 minutes
Task and CPU States
This section consists of a minimum of two lines. In an SMP environment, additional lines can reflect individual CPU state percentages.
- Line 1 shows total tasks or threads, depending on the state of the Threads-mode toggle. That total is further classified as: running; sleeping; stopped; zombie
- Line 2 shows CPU state percentages based on the interval since the last refresh. Where two labels are shown below, those for more recent kernel versions are shown first:
us, user : time running un-niced user processes
sy, system : time running kernel processes
ni, nice : time running niced user processes
wa, IO-wait : time waiting for I/O completion
hi : time spent servicing hardware interrupts
si : time spent servicing software interrupts
st : time stolen from this vm by the hypervisor
Memory Usage
This portion consists of two lines which may express values in kibibytes (KiB), mebibytes (MiB) or gibibytes (GiB) depending on the amount of physical memory.
- Line 1 reflects physical memory, classified as: total, used, free, buffers
- Line 2 reflects virtual memory, classified as: total, used, free, cached
Fields / Columns
Listed below are top’s available process fields (columns). They are shown in alphabetical order. You may customize their position and whether or not they are displayable with the ‘f‘ or ‘F‘ (Fields Management) interactive commands.
Any field is selectable as the sort field, and you control whether they are sorted high-to-low or low-to-high.
CGROUPS — Control Groups
The names of the control group(s) to which a process belongs, or ‘—‘ if not applicable for that process.
Control Groups provide for allocating resources (cpu, memory, network bandwidth, etc.) among installation-defined groups of processes. They enable fine-grained control over allocating, denying, prioritizing, managing and monitoring those resources.
Many different hierarchies of «cgroups» can exist simultaneously on a system and each hierarchy is attached to one or more subsystems. A subsystem represents a single resource.
The ‘CGROUPS’ field, unlike most columns, is not fixed-width. When displayed, it plus any other variable width columns will be allocated all remaining screen width (up to the maximum 512 characters).
- CODE — Code Size (KiB). The amount of physical memory devoted to executable code, also known as the ‘text resident set’ size or TRS.
- COMMAND — Command Name or Command Line. Display the command line used to start a task or the name of the associated program. You toggle between command line and name with ‘c‘, which is both a command-line option and an interactive command. When you’ve chosen to display command lines, processes without a command line (like kernel threads) will be shown with only the program name in brackets (for example: «[ mrecoveryd ]«). Either form of display is subject to potential truncation if it’s too long to fit in this field’s current width. That width depends upon other fields selected, their order and the current screen width. This field may also be impacted by the ‘forest view’ display mode. See the ‘V‘ interactive command for additional information regarding that mode.
Note: The ‘COMMAND’ field, unlike most columns, is not fixed-width. When displayed, it plus any other variable width columns will be allocated all remaining screen width (up to the maximum 512 characters).
This value may also be used as: a process group ID (see PGRP); a session ID for the session leader (see SID); a thread group ID for the thread group leader (see TGID); and a TTY process group ID for the process group leader (see TPGID).
Under linux, real time priority is somewhat misleading since traditionally the operating itself was not preemptable. And while the 2.6 kernel can be made mostly preemptable, it is not always so.
‘D‘ = uninterruptible sleep
‘R‘ = running
‘S‘ = sleeping
‘T‘ = traced or stopped
‘Z‘ = zombie
Tasks shown as running should be more properly thought of as ‘ready to run’ — their task_struct is represented on the Linux run-queue. Even without a true SMP machine, you may see numerous tasks in this state depending on top’s delay interval and nice value.
Note: The ‘SUPGIDS’ field, unlike most columns, is not fixed-width. When displayed, it plus any other variable width columns will be allocated all remaining screen width (up to the maximum 512 characters).
SUPGRPS — Supplementary Group Names. The names of any supplementary group(s) established at login or inherited from a task’s parent. They are displayed in a comma delimited list.
Note: The ‘SUPGRPS’ field, unlike most columns, is not fixed-width. When displayed, it plus any other variable width columns will be allocated all remaining screen width (up to the maximum 512 characters).
By displaying this field, top’s own working set could be increased by over 700 Kb, depending on the kernel version. Should that occur, your only means of reducing that overhead will be to stop and restart top.
Note: The ‘WCHAN’ field, unlike most columns, is not fixed-width. When displayed, it plus any other variable width columns will be allocated all remaining screen width (up to the maximum 512 characters).
Managing Fields
After pressing the interactive command ‘f‘ or ‘F‘ (Fields Management) you will be presented with a screen showing: 1) the current window name; 2) the designated sort field; 3) all fields in their current order along with descriptions. Entries marked with an asterisk are the currently displayed fields, screen width permitting.
- As the on-screen instructions indicate, you navigate among the fields with the Up and Down arrow keys. The PgUp, PgDn, Home and End keys can also be used to quickly reach the first or last available field.
- The Right arrow key selects a field for repositioning and the Left arrow key or the key commits that field’s placement.
- The ‘d‘ key or the bar toggles a field’s display status, and thus the presence or absence of the asterisk.
- The ‘s‘ key designates a field as the sort field. See topic 4c. TASK AREA Commands, SORTING for additional information regarding your selection of a sort field.
- The ‘a‘ and ‘w‘ keys can be used to cycle through all available windows and the ‘q‘ or keys exit Fields Management.
The Fields Management screen can also be used to change the current window/field group in either full-screen mode or alternate-display mode. Whatever was targeted when ‘q‘ or was pressed will be made current as you return to the top display. See topic 5. ALTERNATE-DISPLAY Provisions and the ‘g‘ interactive command for insight into current windows and field groups.
Note: Any window that has been scrolled horizontally will be reset if any field changes are made via the Fields Management screen. Any vertical scrolled position, however, will not be affected. See topic 5c. SCROLLING a Window for additional information regarding vertical and horizontal scrolling.
Interactive Commands
Listed below is a brief index of commands within categories. Some commands appear more than once — their meaning or scope may vary depending on the context in which they are issued.
Global Commands
The global interactive commands are always available in both full-screen mode and alternate-display mode. However, some of these interactive commands are not available when running in ‘Secure mode’.
If you want to know in advance whether or not your top has been secured, ask for help and view the system summary on the second line.
| or | Refresh-Display These commands awaken top and following receipt of any input the entire display will be repainted. They also force an update of any hotplugged cpu or physical memory changes. Use either of these keys if you have a large delay interval and wish to see current status. |
| ? or h | Help There are two help levels available. The first will provide a reminder of all the basic interactive commands. If top is secured, that screen will be abbreviated. Typing ‘h‘ or ‘?‘ on that help screen will take you to help for those interactive commands applicable to alternate-display mode. |
| = | Exit-Task-Limits Removes restrictions on which tasks are shown. This command will reverse any ‘i‘ (idle tasks) and ‘n‘ (max tasks) commands that might be active. It also provides for an ‘exit’ from pid monitoring and user filtering. See the ‘-p‘ command-line option for a discussion of PID monitoring and the ‘U‘ or ‘u‘ interactive commands regarding user filtering. Additionally, any window that has been scrolled will be reset with this command. |
| A | Alternate-Display-Mode toggle This command will switch between full-screen mode and alternate-display mode. |
| B | Bold-Disable/Enable toggle This command will influence use of the ‘bold’ terminfo capability and alters both the summary area and task area for the current window. While it is intended primarily for use with dumb terminals, it can be applied anytime. Note: When this toggle is On and top is operating in monochrome mode, the entire display will appear as normal text. Thus, unless the ‘x‘ or ‘y‘ toggles are using reverse for emphasis, there will be no visual confirmation that they are even on. |
| d or s | * Change-Delay-Time-interval You will be prompted to enter the delay time, in seconds, between display updates. Fractional seconds are honored, but a negative number is not allowed. Entering 0 causes (nearly) continuous updates, with an unsatisfactory display as the system and tty driver try to keep up with top’s demands. The delay value is inversely proportional to system loading, so set it with care. If at any time you want to know the current delay time, ask for help and view the system summary on the second line. |
| g | Choose-Another-Window/Field-Group You will be prompted to enter a number between 1 and 4 designating the field group which should be made the current window. You will soon grow comfortable with these 4 windows, especially after experimenting with alternate-display mode. |
| H | Threads-mode toggle When this toggle is On, individual threads will be displayed for all processes in all visible task windows. Otherwise, top displays a summation of all threads in each process. |
| I | Irix/Solaris-Mode toggle When operating in ‘Solaris mode’ (‘I‘ toggled Off), a task’s cpu usage will be divided by the total number of CPUs. After issuing this command, you’ll be told the new state of this toggle. |
| k | * Kill-a-task You will be prompted for a PID and then the signal to send. The default signal, as reflected in the prompt, is SIGTERM. However, you can send any signal, via number or name. If you want to abort the kill process, do one of the following depending on your progress: 1) at the pid prompt, just press 2) at the signal prompt, type 0 |
| q | Quit |
| r | * Renice-a-Task You will be prompted for a PID and then the value to nice. Entering a positive value will cause a process to lose priority. Conversely, a negative value will cause a process to be viewed more favorably by the kernel. |
| W | Write-the-Configuration-File This key saves all of your options and toggles plus the current display mode and delay time. By issuing this command just before quitting top, you will be able restart later in exactly that same state. |
| Z | Change-Color-Mapping This key takes you to a separate screen where you can change the colors for the current window, or for all windows. For details regarding this interactive command see topic 4d. COLOR Mapping. |
* The commands shown with an asterisk (*) are not available in ‘Secure mode’, nor will they be shown on the level-1 help screen.
Summary Area Commands
The summary area interactive commands are always available in both full-screen mode and alternate-display mode. They affect the beginning lines of your display and will determine the position of messages and prompts.
These commands always impact just the current window/field group. See topic 5. ALTERNATE-DISPLAY Provisions and the ‘g‘ interactive command for insight into current windows and field groups.
| l | Load-Average/Uptime toggle This command is also the line containing the program name (possibly an alias) when operating in full-screen mode or the current window name when operating in alternate-display mode. |
| t | Task/Cpu-States toggle This command affects from 2 to many summary area lines, depending on the state of the ‘1‘ toggle and whether or not top is running under true SMP. This portion of the summary area is also influenced by the ‘H‘ interactive command toggle, as reflected in the total label which shows either ‘Tasks’ or ‘Threads’. |
| 1 | Single/Separate-Cpu-States toggle This command affects how the ‘t‘ command’s Cpu States portion is shown. Although this toggle exists primarily to serve massively-parallel SMP machines, it is not restricted to solely SMP environments. When you see ‘%Cpu(s):’ in the summary area, the ‘1‘ toggle is On and all cpu information is gathered in a single line. Otherwise, each cpu is displayed separately as: ‘%Cpu0, %Cpu1, . ‘ up to available screen height. |
| m | Memory/Swap-Usage toggle This command affects the two summary area lines dealing with physical and virtual memory. |
Note: If the entire summary area has been toggled Off for any window, you would be left with just the message line. In that way, you will have maximized available task rows but (temporarily) sacrificed the program name in full-screen mode or the current window name when in alternate-display mode.
Task Area Commands
The task area interactive commands are always available in full-screen mode.
The task area interactive commands are never available in alternate-display mode if the current window’s task display has been toggled Off (see topic 5. ALTERNATE-DISPLAY Provisions).
Appearance Of Task Window
The following commands will also be influenced by the state of the global ‘B‘ (bold enable) toggle.
| b | Bold/Reverse toggle This command will impact how the ‘x‘ and ‘y‘ toggles are displayed. Further, it will only be available when at least one of those toggles is On. |
| x | Column-Highlight toggle Changes highlighting for the current sort field. If you forget which field is being sorted this command can serve as a quick visual reminder, providing the sort field is being displayed. The sort field might not be visible because: 1) there is insufficient Screen Width 2) the ‘f‘ interactive command turned it Off |
| y | Row-Highlight toggle Changes highlighting for «running» tasks. Use of this provision provides important insight into your system’s health. The only costs will be a few additional tty escape sequences. |
| z | Color/Monochrome toggle Switches the current window between your last used color scheme and the older form of black-on-white or white-on-black. This command will alter both the summary area and task area but does not affect the state of the ‘x‘, ‘y‘ or ‘b‘ toggles. |
Content Of Task Window
| c | Command-Line/Program-Name toggle |
This command will be honored whether or not the ‘COMMAND’ column is currently visible. Later, should that field come into view, the change you applied will be seen.
These keys display a separate screen where you can change which fields are displayed, their order and also designate the sort field.
When ‘Cumulative mode’ is On, each process is listed with the cpu time that it and its dead children have used.
When Off, programs that fork into many separate tasks will appear less demanding. For programs like ‘init’ or a shell this is appropriate but for others, like compilers, perhaps not. Experiment with two task windows sharing the same sort field but with different ‘S‘ states and see which representation you prefer.
After issuing this command, you’ll be informed of the new state of this toggle. If you want to know in advance whether or not ‘Cumulative mode’ is in effect, ask for help and view the window summary on the second line.
You will be prompted for the uid or name of the user to display. The ‘-u‘ option matches on effective user whereas the ‘-U‘ option matches on any user (real, effective, saved, or filesystem).
Thereafter, in that task window only matching users will be shown, or possibly no processes will be shown. Different task windows can be used to filter different users.
Later, if you want to monitor all tasks again in the current window, re-issue this command but just press at the prompt.
In this mode, processes are reordered according to their parents and the layout of the COMMAND column resembles that of a tree. In forest view mode it is still possible to toggle between program name and command line (see the ‘c‘ interactive command) or between processes and threads (see the ‘H‘ interactive command).
Note: Typing any key affecting the sort order will exit forest view mode in the current window. See topic 4c. TASK AREA Commands, SORTING for information on those keys.
Size Of Task Window
| i | Idle-Process toggle |
Displays all tasks or just active tasks. When this toggle is Off, tasks that have not used any CPU since the last update will not be displayed. However, due to the granularity of the %CPU and TIME+ fields, some processes may still be displayed that appear to have used no CPU.
If this command is applied to the last task display when in alternate-display mode, then it will not affect the window’s size, as all prior task displays will have already been painted.
You will be prompted to enter the number of tasks to display. The lessor of your number and available screen rows will be used.
When used in alternate-display mode, this is the command that gives you precise control over the size of each currently visible task display, except for the very last. It will not affect the last window’s size, as all prior task displays will have already been painted.
Note: If you want to increase the size of the last visible task display when in alternate-display mode, decrease the size of the task display(s) above it.
Sorting Of Task Window
For compatibility, this top supports most of the former top sort keys. Since this is primarily a service to former top users, these commands do not appear on any help screen.
| command | sorted-field | supported |
|---|---|---|
| A | start time (non-display) | No |
| M | %MEM | Yes |
| N | PID | Yes |
| P | %CPU | Yes |
| T | TIME+ | Yes |
Before using any of the following sort provisions, top suggests that you temporarily turn on column highlighting using the ‘x‘ interactive command. That will help ensure that the actual sort environment matches your intent.
The following interactive commands will only be honored when the current sort field is visible. The sort field might not be visible because:
1) there is insufficient Screen Width
2) the ‘f‘ interactive command turned it Off
| Move-Sort-Field-Right Moves the sort column to the right unless the current sort field is the last field being displayed. |
The following interactive commands will always be honored whether or not the current sort field is visible.
| f or F | Fields-Management These keys display a separate screen where you can change which field is used as the sort column, among other functions. This command can be a convenient way to verify the current sort field, when running top with column highlighting turned Off. |
| R | Reverse/Normal-Sort-Field toggle Using this interactive command you can alternate between high-to-low and low-to-high sorts. |
Field sorting uses internal values, not those in column display. Thus, the TTY and WCHAN fields will violate strict ASCII collating sequence.
Alternate-Display Provisions: Microsoft Windows
Field Groups/Windows
In full-screen mode there is a single window represented by the entire screen. That single window can still be changed to display 1 of 4 different field groups (see the ‘g‘ interactive command, repeated below). Each of the 4 field groups has a unique separately configurable summary area and its own configurable task area.
In alternate-display mode, those 4 underlying field groups can now be made visible simultaneously, or can be turned Off individually at your command.
The summary area will always exist, even if it’s only the message line. At any given time only one summary area can be displayed. However, depending on your commands, there could be from zero to four separate task displays currently showing on the screen.
Current Window
The current window is the window associated with the summary area and the window to which task related commands are always directed. Since in alternate-display mode you can toggle the task display Off, some commands might be restricted for the current window.
A further complication arises when you have toggled the first summary area line Off. With the loss of the window name (the ‘l‘ toggled line), you’ll not easily know what window is the current window.
Commands for Windows
| — (dash) or _ (underscore) | Show/Hide-Window(s) toggles |
The ‘—‘ key turns the current window’s task display On and Off. When On, that task area will show a minimum of the columns header you’ve established with the ‘f‘ interactive command. It will also reflect any other task area options/toggles you’ve applied yielding zero or more tasks.
The ‘_‘ key does the same for all task displays. In other words, it switches between the currently visible task display(s) and any task display(s) you had toggled Off. If all 4 task displays are currently visible, this interactive command will leave the summary area as the only display element.
The ‘=‘ key forces the current window’s task display to be visible. It also reverses any ‘i‘ (idle tasks), ‘n‘ (max tasks) and ‘u‘/’U‘ (user filter) commands that might be active. Also, if the window had been scrolled, it will be reset with this command.
The ‘+‘ key does the same for all windows. The four task displays will reappear, evenly balanced. They will also have retained any customizations you had previously applied, except for the ‘i‘ (idle tasks), ‘n‘ (max tasks), ‘u‘/’U‘ (user filter) and scrolling interactive commands.
This command will switch between full-screen mode and alternate-display mode.
The first time you issue this command, all four task displays will be shown. Thereafter when you switch modes, you will see only the task display(s) you’ve chosen to make visible.
This command changes the current window, which in turn changes the window to which commands are directed. These keys act in a circular fashion so you can reach any desired current window using either key.
Assuming the window name is visible (you have not toggled ‘l‘ Off), whenever the current window name loses its emphasis/color, that’s a reminder the task display is Off and many commands will be restricted.
You will be prompted to enter a number between 1 and 4 designating the field group which should be made the current window.
In full-screen mode, this command is necessary to alter the current window. In alternate-display mode, it is a less convenient alternative to the ‘a‘ and ‘w‘ commands.
You will be prompted for a new name to be applied to the current window. It does not require that the window name be visible (the ‘l‘ toggle to be On).
* The interactive commands shown with an asterisk (*) have use beyond alternate-display mode.
‘a‘, ‘w‘ act the same with color mapping and fields management.
Scrolling a Window
Typically a task window is a partial view into a systems’s total tasks/threads which shows only some of the available fields/columns. With these scrolling keys, you can move that view vertically or horizontally to reveal any desired task or column.
| Up, PgUp | Scroll-Tasks Move the view up toward the first task row, until the first task is displayed at the top of the current window. The Up arrow key moves a single line while PgUp scrolls the entire window. |
| Down, PgDn | Scroll-Tasks Move the view down toward the last task row, until the last task is the only task displayed at the top of the current window. The Down arrow key moves a single line while PgDn scrolls the entire window. |
| Left, Right | Scroll-Columns Move the view of displayable fields horizontally one column at a time. Note: As a reminder, some fields/columns are not fixed-width but allocated all remaining screen width when visible. When scrolling right or left, that feature may produce some unexpected results initially. |
| Home | Jump-to-Home-Position Reposition the display to the un-scrolled coordinates. |
| End | Jump-to-End-Position Reposition the display so that the rightmost column reflects the last displayable field and the bottom task row represents the last task. Note: From this position it is still possible to scroll down and right using the arrow keys until a single column and a single task is left as the only display element. |
| C | Show-scroll-coordinates toggle Toggle an informational message that is displayed whenever the message line is not otherwise being used. «scroll coordinates: y = n/n (tasks), x = n/n (fields)« The coordinates shown as n/n are relative to the upper left corner of the current window. The first n represents the topmost visible task and is controlled by scrolling keys. The second n is updated automatically to reflect total tasks. The first n represents the leftmost displayed column and is controlled by scrolling keys. The second n is the total number of displayable fields and is established with the ‘f‘ interactive command. |
The above interactive commands are always available in full-screen mode but never available in alternate-display mode if the current window’s task display has been toggled Off.
Searching in a Window
You can use these interactive commands to locate a task row containing a particular value.
| L | Locate-a-string You will be prompted for the case-sensitive string to locate starting from the current window coordinates. There are no restrictions on search string content. Searches are not limited to values from a single field or column. All of the values displayed in a task row are allowed in a search string. You may include spaces, numbers, symbols and even forest view artwork. Keying with no input will effectively disable the ‘&’ key until a new search string is entered. |
| & | Locate-next Assuming a search string has been established, top will attempt to locate the next occurrence. When a match is found, the current window is repositioned vertically so the task row containing that string is first. The scroll coordinates message can provide confirmation of such vertical repositioning (see the ‘C‘ interactive command). Horizontal scrolling, however, is never altered via searching. The availability of a matching string will be influenced by the following factors. a. Which fields are displayable from the total available b. Scrolling a window vertically or horizontally c. The state of the command/command-line toggle d. The stability of the chosen sort column, for example PID is good but %CPU bad. If a search fails, restoring the current window home (unscrolled) position, scrolling horizontally, displaying command-lines or choosing a more stable sort field could yet produce a successful ‘&’ search. |
The above interactive commands are always available in full-screen mode but never available in alternate-display mode if the current window’s task display has been toggled Off.
Note: Whenever a search key is typed, top forces idle tasks On and user filtering Off to ensure that every task is encountered. See the ‘i‘ and ‘u/U’ interactive commands for additional information on how displayed tasks might be filtered.
Files
System Configuration File
The presence of this file will influence which version of the ‘help’ screen is shown to an ordinary user. More importantly, it will limit what ordinary users are allowed to do when top is running. They will not be able to issue the following commands.
| k | Kill a task |
| r | Renice a task |
| d or s | Change delay/sleep interval |
The system configuration file is not created by top. Rather, you create this file manually and place it in the /etc directory. Its name must be ‘toprc’ and must have no leading ‘.‘ (period). It must have only two lines.
Here is an example of the contents of /etc/toprc:
s # line 1: ‘secure’ mode switch 5.0 # line 2: ‘delay’ interval in seconds
Personal Configuration File
This file is written as ‘$HOME/.your-name-4-top‘ + ‘rc‘. Use the ‘W‘ interactive command to create it or update it. Here is the general layout:
global # line 1: the program name/alias notation global # line 2: id,altscr,irixps,delay,curwin per ea # line a: winname,fieldscur window # line b: winflags,sortindx,maxtasks window # line c: summclr,msgsclr,headclr,taskclr
If the $HOME variable is not present, top will try to write the personal configuration file to the current directory, subject to permissions.
Tips And Tricks
Many of these ‘tricks’ work best when you give top a scheduling boost. So plan on starting it with a nice value of -10, assuming you’ve got the authority.
Kernel Magic
For these tricks, top needs full-screen mode.
- The user interface, through prompts and help, intentionally implies that the delay interval is limited to tenths of a second. However, you’re free to set any desired delay. If you want to see Linux at his scheduling best, try a delay of .09 seconds or less.
For this experiment, under X Windows open an xterm and maximize it. Then do the following:
1. provide a scheduling boost and tiny delay via:nice -n -10 top -d.09
2. keep sorted column highlighting Off so as to minimize path length
3. turn On reverse row highlighting for emphasis
4. try various sort columns (TIME/MEM work well), and normal or reverse sorts to bring the most active processes into view
What you’ll see is a very busy Linux doing what it’s always done for you, but there was no program available to illustrate this.
Under an xterm using ‘white-on-black’ colors, on top’s Color Mapping screen set the task color to black and be sure that task highlighting is set to bold, not reverse. Then set the delay interval to around .3 seconds.
After bringing the most active processes into view, what you’ll see are the ghostly images of just the currently running tasks.
Delete the existing rcfile, or create a new symlink. Start this new version then type ‘T‘ (a secret key, see topic 4c. Task Area Commands, SORTING) followed by ‘W‘ and ‘q‘. Finally, restart the program with -d0 (zero delay).
Your display will be refreshed at three times the rate of the former top, a 300% speed advantage. As top climbs the TIME ladder, be as patient as you can while speculating on whether or not top will ever reach the top.
Bouncing Windows
For these tricks, top needs alternate-display mode.
- With 3 or 4 task displays visible, pick any window other than the last and turn idle processes Off using the ‘i‘ command toggle. Depending on where you applied ‘i‘, sometimes several task displays are bouncing and sometimes it’s like an accordion, as top tries his best to allocate space.
- Set each window’s summary lines differently: one with no memory (‘m‘); another with no states (‘t‘); maybe one with nothing at all, just the message line. Then hold down ‘a‘ or ‘w‘ and watch a variation on bouncing windows — hopping windows.
- Display all 4 windows and for each, in turn, set idle processes to Off using the ‘i‘ command toggle. You’ve just entered the «extreme bounce» zone.
The Big Bird Window
This trick also requires alternate-display mode.
- Display all 4 windows and make sure that 1:Def is the current window. Then, keep increasing window size with the ‘n‘ interactive command until all the other task displays are «pushed out of the nest». When they’ve all been displaced, toggle between all visible/invisible windows using the ‘_‘ command toggle. It’s a truly mind-bending experience.
Related commands
free — Display the amount of free and used memory.
ps — Report the status of a process or processes.
pstree — Display processes in a tree format.
uptime — Display information about how long the system has been running.
Источник


