- 15 simple TOP command examples on Linux to monitor processes
- Linux TOP command
- Note your «top» command variant
- 1. Display processes
- 2. Sort by Memory/Cpu/Process ID/Running Time
- 3. Reverse the sorting order — ‘R’
- 4. Highlight the sorted column with bold text — ‘x’
- 5. Highlight sorted column background color ‘b’
- 6. Change the update delay — ‘d’
- 7. Filter or Search processes — ‘o’/’O’
- 8. Display full command path and arguments of process — ‘c’
- 9. View processes of a user — ‘u’/’U’
- 10. Toggle the display of idle processes — ‘i’
- 11. Hide/Show the information on top — ‘l’, ‘t’, ‘m’
- 12. Forest mode — ‘V’
- 13. Change the number of processes to display — ‘n’
- 14. Display all CPU cores — ‘1’
- 15. Show/Hide columns ‘f’
- 16. Batch mode
- 17. Split output in multiple panels — ‘A’
- Conclusion
- 10 thoughts on “ 15 simple TOP command examples on Linux to monitor processes ”
- Использование команды top в ОС Linux
- Введение
- Работа с командой top
- Использование top в фоновом режиме
- Параметры команды top
- Отображение текущей версии
- Определение задержки между обновлениями экрана
- Получение списка столбцов, поддерживающих сортировку
- Сортировка вывода команды top по имени столбца
- Отображение процессов определённого пользователя
- Отображение дополнительных столбцов в таблице top
- Переключение режимов
- Смена цветов
- Резюме
15 simple TOP command examples on Linux to monitor processes
Linux TOP command
One of the most basic command to monitor processes on Linux is the top command. As the name suggests, it shows the top processes based on certain criterias like cpu usage or memory usage.
The processes are listed out in a list with multiple columns for details like process name, pid, user, cpu usage, memory usage.
Apart from the list of processes, the top command also shows brief stats about average system load, cpu usage and ram usage on the top.
This post shows you some very simple examples of how to use the top command to monitor processes on your linux machine or server.
Note your «top» command variant
Be aware that the top command comes in various variants and each has a slightly different set of options and method of usage.
To check your top command version and variant use the -v option
This post focuses on the top command coming from the procps-ng project. This is the version available on most modern distros like Ubunut, Fedora, CentOS etc.
1. Display processes
To get a glimpse of the running processes, just run the top command as is without any options like this.
And immediately the output would be something like this —
The screen contains a lot of information about the system. The header areas include uptime, load average, cpu usage, memory usage data.
The process list shows all the processes with various process specific details in separate columns.
Some of the column names are pretty self explanatory.
PID — Process ID
USER — The system user account running the process.
%CPU — CPU usage by the process.
%MEM — Memory usage by the process
COMMAND — The command (executable file) of the process
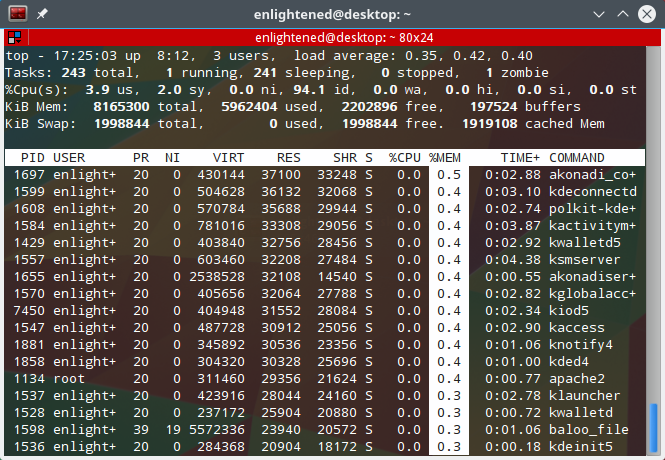
2. Sort by Memory/Cpu/Process ID/Running Time
To find the process consuming the most cpu or memory, simply sort the list.
Press M key ( yes, in capital, not small ) to sort the process list by memory usage. Processes using the most memory are shown first and rest in order.
Here are other options to sort by CPU usage, Process ID and Running Time —
Press ‘P’ — to sort the process list by cpu usage.
Press ‘N’ — to sort the list by process id
Press ‘T’ — to sort by the running time.
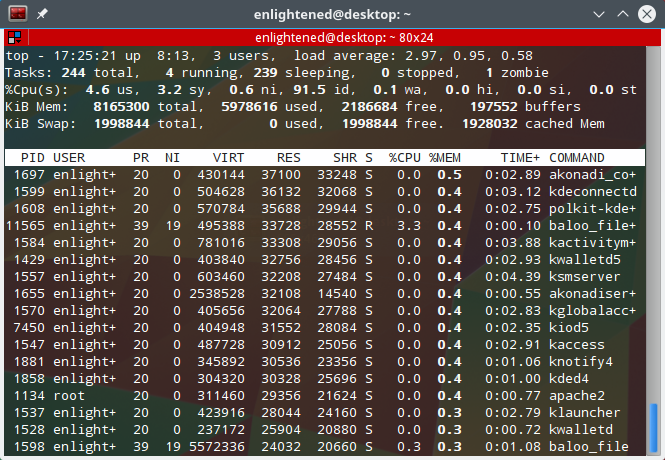
3. Reverse the sorting order — ‘R’
By default the sorting is done in descending order. Pressing ‘R’ shall reverse the sorting order of the currently sorted column
Here is the output sorted in ascending order of cpu usage. Processes consuming the least amount of cpu are shown first.
4. Highlight the sorted column with bold text — ‘x’
Press x, to highlight the values in the sort column with bold text. Here is a screenshot, with the memory column in bold text —
top command highlight column
5. Highlight sorted column background color ‘b’
After highlighting the sorted column with bold font, its further possible to highlight with a different background color as well. This is how it looks
Top command highlight column background
6. Change the update delay — ‘d’
The top command updates the information on the screen every 3.0 seconds by default. This refresh interval can be changed.
Press the ‘d’ key, and top will ask you to enter the time interval between each refresh. You can enter numbers smaller than 1 second as well, like 0.5. Enter the desired interval and hit Enter.
7. Filter or Search processes — ‘o’/’O’
You can filter the process list based on various criterias like process name, memory usage, cpu usage etc. Multiple filter criterias can be applied.
Press the ‘o’ or ‘O’ to activate filter prompt. It will show a line indicating the filter format like this —
Then enter a filter like this and hit Enter.
COMMAND=apache
Now top will show only those processes whose COMMAND field contains the value apache.
Here is another filter example that shows processes consuming CPU actively —
%CPU>0.0
See active filters — Press Ctrl+o to see currently active filters
Clear filter — Press ‘=’ key to clear any active filters
8. Display full command path and arguments of process — ‘c’
Press ‘c’ to display the full command path along with the commandline arguments in the COMMAND column.
9. View processes of a user — ‘u’/’U’
To view the processes of a specific user only, press ‘u’ and then top will ask you to enter the username.
Which user (blank for all)
Enter the desired username and hit Enter.
10. Toggle the display of idle processes — ‘i’
Press ‘i’ to toggle the display of idle/sleeping processes. By default all processes are display.
11. Hide/Show the information on top — ‘l’, ‘t’, ‘m’
The ‘l’ key would hide the load average information.
The ‘m’ key will hide the memory information.
The ‘t’ key would hide the task and cpu information.
Hiding the header information area, makes more processes visible in the list.
12. Forest mode — ‘V’
Pressing ‘V’ will display the processes in a parent child hierarchy. It looks something like this —
13. Change the number of processes to display — ‘n’
Lets say you want to monitor only few processes based on a certain filter criteria. Press ‘n’ and enter the number of processes you wish to display.
It will display a line saying —
Maximum tasks = 0, change to (0 is unlimited)
14. Display all CPU cores — ‘1’
Pressing ‘1’ will display the load information about individual cpu cores. Here is how it looks —
15. Show/Hide columns ‘f’
By default top displays only few columns out of many more that it can display. If you want to add or remove a particular column or change the order of columns, then press f
The fields marked * or bold are the fields that are displayed, in the order in which they appear in this list.
Navigate the list using up/down arrow keys and press ‘d’ to toggle the display of that field. Once done, press q to go back to the process list
The following output displays only PID, USER, CPU, MEMORY and COMMAND columns.
16. Batch mode
Top also supports batch mode output, where it would keep printing information sequentially instead of a single screen. This is useful when you need to log the top output for later analysis of some kind.
Here is a simple example that shows the Cpu usage at intervals of 1 second.
17. Split output in multiple panels — ‘A’
Each panel can be sorted on a different column. Press ‘a’ to move through the panels. Each panel can have a different set of fields displayed and different sort columns.
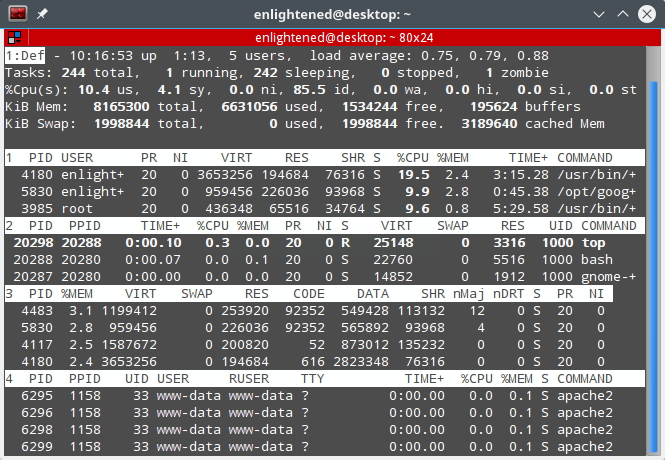
top command multiple panels
Conclusion
Top is a great commandline tool to check system resource usage and process details. Its often used on servers for monitoring and quick diagnosis.
If you are looking for something easier with a better user interface then try htop. Htop has a intuitive user interface, where you need not memorize keyboard shortcuts. Htop has onscreen instructions that guide you on how to use it.
A Tech Enthusiast, Blogger, Linux Fan and a Software Developer. Writes about Computer hardware, Linux and Open Source software and coding in Python, Php and Javascript. He can be reached at [email protected] .
10 thoughts on “ 15 simple TOP command examples on Linux to monitor processes ”
Nice article and great explanation.
if same user id is running multiple times how to delete all others except one.Please any one reply me fast.
exp
PID USER PR %cpu
QPD02201
QPD02201
QPD02201
QPD02201
A really top article!
Hi, thanks for the great article but I’m still looking for an answer for my case: It looks like that all the time. CPU load is around 45-50% all the time but if I add up the CPU usage of the services it never gets close… Why’s that?
Tasks: 251 total, 1 running, 250 sleeping, 0 stopped, 0 zombie
%Cpu0 : 50,1 us, 10,1 sy, 0,0 ni, 39,8 id, 0,0 wa, 0,0 hi, 0,0 si, 0,0 st
%Cpu1 : 55,7 us, 7,2 sy, 0,0 ni, 36,8 id, 0,0 wa, 0,0 hi, 0,2 si, 0,0 st
%Cpu2 : 35,6 us, 4,4 sy, 0,0 ni, 58,8 id, 0,0 wa, 0,0 hi, 1,2 si, 0,0 st
%Cpu3 : 36,7 us, 5,8 sy, 0,0 ni, 56,9 id, 0,0 wa, 0,0 hi, 0,6 si, 0,0 st
KiB Mem : 16242248 total, 12711832 free, 2071424 used, 1458992 buff/cache
KiB Swap: 3809276 total, 3809276 free, 0 used. 13807884 avail Mem
PID USER PR NI VIRT RES SHR S %CPU %MEM TIME+ COMMAND
9066 root 20 0 830468 35332 25632 S 2,2 0,2 2:19.18 metricbeat
5428 www-data 20 0 72168 27716 2520 S 1,2 0,2 3:28.49 kix.Daemon.pl
590 kopano 20 0 291488 41016 24640 S 0,6 0,3 1:27.52 kopano-search
581 kopano 20 0 355280 38644 18984 S 0,4 0,2 1:27.69 kopano-presence
7 root 20 0 0 0 0 S 0,2 0,0 0:31.24 rcu_sched
580 root 20 0 250116 4332 2508 S 0,2 0,0 0:01.37 rsyslogd
821 postgres 20 0 268376 6448 4688 S 0,2 0,0 0:00.07 postgres
1569 mysql 20 0 739704 114760 17024 S 0,2 0,7 0:38.78 mysqld
1802 root 20 0 392128 12028 6828 S 0,2 0,1 0:08.35 docker-containe
1875 root 20 0 3125288 23428 9428 S 0,2 0,1 0:40.27 slapd
2043 root 20 0 818760 70340 28176 S 0,2 0,4 0:37.41 named
2686 kdm 20 0 392288 59108 33904 S 0,2 0,4 0:29.23 kdm_greet
2871 root 20 0 4822492 437276 23464 S 0,2 2,7 2:01.74 java
9560 root 20 0 588668 69552 22952 S 0,2 0,4 0:40.12 packetbeat
10650 root 20 0 38144 3588 3012 R 0,2 0,0 0:04.37 top
Maybe it looks better like this
%Cpu0 : 50,1 us, 10,1 sy,
%Cpu1 : 55,7 us, 7,2 sy,
%Cpu2 : 35,6 us, 4,4 sy,
%Cpu3 : 36,7 us, 5,8 sy,
Источник
Использование команды top в ОС Linux

Введение
Команда top используется в операционной системе Linux для отображения всех активных процессов внутри неё. Данная статья рассказывает о работе с командой top, предоставляя обзор её параметров и отображаемой информации.
Работа с командой top
В простейшем случае, для того, чтобы отобразить активные процессы, нужно просто ввести в терминале Linux следующее:

При этом отображается следующая информация:
В первой строке отображается:
- Время
- Время работы компьютера
- Число пользователей
- Средняя нагрузка (за последний час, полчаса и 15 минут)
Во второй строке отображается:
- Общее число задач
- Количество активных задач
- Количество отложенных задач
- Количество приостановленных задач
- Количество задач-зомби
В третьей строке в процентах отображается:
- Загрузка ЦП задачами пользователя
- Загрузка ЦП системой
- Загрузка ЦП процессами с низким приоритетом
- Время бездействия ЦП
- Загрузка ЦП операциями ввода/вывода
- Загрузка ЦП обработкой аппаратных прерываний
- Загрузка ЦП обработкой программных прерываний
- Время, “украденное” гипервизором

В третьей строке отображается:
- Общий объём доступной системе памяти
- Объём свободной памяти
- Объём используемой памяти
- Объём буферного кэша
В четвёртой строке показан:
- Общий объём SWAP (раздела подкачки)
- Объём свободной памяти в SWAP
- Объём использованной памяти в SWAP
- Объём доступной памяти.
В основной таблице отображается:
- ID процесса
- Уровень пользовательского приоритета
- Уровень “вежливости”
- Объём виртуальной памяти, используемой процессом
- Объем физической памяти, используемый процессом
- Объём совместно используемой памяти
- Коэффициент загрузки ЦП процессом, %
- Коэффициент загрузки памяти процессом, %
- Время работы процесса
- Команда
Использование top в фоновом режиме
Получить доступ к команде top и при этом не вводить её каждый раз в терминал весьма просто.
Для того, чтобы приостановить top и продолжить пользоваться терминалом, достаточно нажать Ctrl+Z.
Вернуть top на первый план можно командой fg.
Параметры команды top
-h – отображает текущую версию
-c – переключает столбец command между отображением команды и имени программы
-d – устанавливает задержку между обновлениями экрана
-o – выполняет сортировку по имени
-p – показывает только процессы с заданными ID
-u – показывает только процессы определенного пользователя
Отображение текущей версии
Для того, чтобы получить информацию о версии top, введите следующее:
Вывод при этом имеет следующий вид:
Определение задержки между обновлениями экрана
Для того чтобы задать задержку между обновления экрана во время использования top, наберите следующее:
Например, чтобы обновлять содержимое каждые 5 секунд, введите top -d 5
Получение списка столбцов, поддерживающих сортировку
Для того чтобы получить список столбцов, по которым можно выполнить сортировку, введите следующее:
Команда top выводит множество столбцов, и вы, вероятно, захотите перенаправить вывод и отобразить его при помощи less. Для этого введите:
Сортировка вывода команды top по имени столбца
Чтобы выбрать столбец, по которому можно выполнить сортировку, воспользуйтесь алгоритмом из предыдущего раздела, затем выполните сортировку используя следующий синтаксис:
Например, сортировку по столбцу %CPU можно выполнить при помощи этой команды:
Отображение процессов определённого пользователя
Для того чтобы показать процессы, запущенные определённым пользователем, используйте команду следующего вида:
Например, для того, чтобы отобразить все процессы пользователя gary, введите следующее:
Отображение дополнительных столбцов в таблице top
Во время работы top нажмите клавишу “F” чтобы увидеть список полей, которые можно отобразить в таблице.
Навигация по списку полей осуществляется с помощью клавиш-стрелок.
Чтобы отобразить определённое поле, нажмите клавишу “D”. Чтобы скрыть поле, нажмите “D” ещё раз. Рядом с отображаемыми полями появляется символ звёздочка (*).
Вы можете активировать сортировку таблицы по определенному параметру, просто выделив его и нажав клавишу “S”.
Для того, чтобы изменения вступили в силу, нажмите клавишу “Enter”. Выйти из меню можно при помощи клавиши “Q”.
Переключение режимов
Во время работы top вы можете нажать клавишу “A”, чтобы переходить между стандартным и альтернативным представлением.
Смена цветов
Для того, чтобы изменить цвет значений, отображаемых в top, нажмите клавишу “Z”.
Смена цвета осуществляется в три стадии:
- Нажмите “S” для того, чтобы изменить цвет общих данных, “M” – сообщений, “H” – заголовков столбцов, “T” – информации о задачах.
- Выберите желаемый цвет для выбранного участка. 0 – черный, 1 – красный, 2 – зеленый, 3 – желтый, 4 – синий, 5 – пурпурный, 6 – голубой, 7 – белый.
- Подтвердите свой выбор нажатием клавиши “Enter”. С помощью клавиши “B” можно применить полужирное начертание текста.
Резюме
Команда top имеет множество параметров, для более подробной справки введите в терминале следующую команду:
Источник


