The !process extension displays information about the specified process, or about all processes, including the EPROCESS block.
This extension can be used only during kernel-mode debugging.
Parameters
/s **** Session Specifies the session that owns the desired process.
/m **** Module Specifies the module that owns the desired process.
Process Specifies the hexadecimal address or the process ID of the process on the target computer.
The value of Process determines whether the !process extension displays a process address or a process ID . If Process is omitted in any version of Windows, the debugger displays data only about the current system process. If Process is 0 and ImageName is omitted, the debugger displays information about all active processes. If -1 is specified for Process information about the current process is displayed.
Flags Specifies the level of detail to display. Flags can be any combination of the following bits. If Flags is 0, only a minimal amount of information is displayed. The default varies according to the version of Windows and the value of Process. The default is 0x3 if Process is omitted or if Process is either 0 or -1; otherwise, the default is 0xF.
Bit 0 (0x1) Displays time and priority statistics.
Bit 1 (0x2) Displays a list of threads and events associated with the process, and their wait states.
Bit 2 (0x4) Displays a list of threads associated with the process. If this is included without Bit 1 (0x2), each thread is displayed on a single line. If this is included along with Bit 1, each thread is displayed with a stack trace.
Bit 3 (0x8) Displays the return address and the stack pointer for each function The display of function arguments is suppressed.
Bit 4 (0x10) Sets the process context equal to the specified process for the duration of this command. This results in a more accurate display of thread stacks. Because this flag is equivalent to using .process /p /r for the specified process, any existing user-mode module list will be discarded. If Process is zero, the debugger displays all processes, and the process context is changed for each one. If you are only displaying a single process and its user-mode state has already been refreshed (for example, with .process /p /r), it is not necessary to use this flag. This flag is only effective when used with Bit 0 (0x1).
ImageName Specifies the name of the process to be displayed. The debugger displays all processes whose executable image names match ImageName. The image name must match that in the EPROCESS block. In general, this is the executable name that was invoked to start the process, including the file extension (usually .exe), and truncated after the fifteenth character. There is no way to specify an image name that contains a space. When ImageName is specified, Process must be zero.
Additional Information
For information about processes in kernel mode, see Changing Contexts. For more information about analyzing processes and threads, see Microsoft Windows Internals, by Mark Russinovich and David Solomon.
Remarks
The following is an example of a !process 0 0 display:
The following table describes some of the elements of the !process 0 0 output.
Element
Meaning
The eight-character hexadecimal number after the word PROCESS is the address of the EPROCESS block. In the final entry in the preceding example, the process address is 0x809258E0.
The hexadecimal number after the word Cid. In the final entry in the preceding example, the PID is 0x44, or decimal 68.
Process Environment Block (PEB)
The hexadecimal number after the word Peb is the address of the process environment block. In the final entry in the preceding example, the PEB is located at address 0x7FFDE000.
Parent process PID
The hexadecimal number after the word ParentCid is the PID of the parent process. In the final entry in the preceding example, the parent process PID is 0x26, or decimal 38.
The name of the module that owns the process. In the final entry in the preceding example, the owner is spoolss.exe. In the first entry, the owner is the operating system itself.
Process object address
The hexadecimal number after the word ObjectTable. In the final entry in the preceding example, the address of the process object is 0x80925c68.
To display full details on one process, set Flags to 7. The process itself can be specified by setting Process equal to the process address, setting Process equal to the process ID, or setting ImageName equal to the executable image name. Here is an example:
Note that the address of the process object can be used as input to other extensions, such as !handle, to obtain further information.
The following table describes some of the elements in the previous example.
Element
Meaning
WAIT
The parenthetical comment after this heading gives the reason for the wait. The command dt nt!_KWAIT_REASON will display a list of all wait reasons.
Lists the amount of time that has elapsed since the process was created. This is displayed in units of Hours:Minutes:Seconds.Milliseconds.
Lists the amount of time the process has been running in user mode. If the value for UserTime is exceptionally high, it might identify a process that is depleting system resources. Units are the same as those of ElapsedTime.
Lists the amount of time the process has been running in kernel mode. If the value for KernelTime is exceptionally high, it might identify a process that is depleting system resources. Units are the same as those of ElapsedTime.
Working Set sizes
Lists the current, minimum and maximum working set size for the process, in pages. An exceptionally large working set size can be a sign of a process that is leaking memory or depleting system resources.
Lists the paged and nonpaged pool used by the process. On a system with a memory leak, looking for excessive nonpaged pool usage on all the processes can tell you which process has the memory leak.
Indicates whether or not the process was created by the POSIX or Interix subsystems.
Indicates the number of private (non-sharable) pages currently being used by the process. This includes both paged in and paged out memory.
In addition to the process list information, the thread information contains a list of the resources on which the thread has locks. This information is listed in the third line of output after the thread header. In this example, the thread has a lock on one resource, a SynchronizationEvent with an address of 80144fc0. By comparing this address to the list of locks shown by the !kdext*.locks extension, you can determine which threads have exclusive locks on resources.
The !stacks extension gives a brief summary of the state of every thread. This can be used instead of the !process extension to get a quick overview of the system, especially when debugging multithread issues, such as resource conflicts or deadlocks.
Process Explorer v16.32
By Mark Russinovich
Published: April 28, 2020
Download Process Explorer(2.5 MB) Run now from Sysinternals Live.
Introduction
Ever wondered which program has a particular file or directory open? Now you can find out. Process Explorer shows you information about which handles and DLLs processes have opened or loaded.
The Process Explorer display consists of two sub-windows. The top window always shows a list of the currently active processes, including the names of their owning accounts, whereas the information displayed in the bottom window depends on the mode that Process Explorer is in: if it is in handle mode you’ll see the handles that the process selected in the top window has opened; if Process Explorer is in DLL mode you’ll see the DLLs and memory-mapped files that the process has loaded. Process Explorer also has a powerful search capability that will quickly show you which processes have particular handles opened or DLLs loaded.
The unique capabilities of Process Explorer make it useful for tracking down DLL-version problems or handle leaks, and provide insight into the way Windows and applications work.
Related Links
Windows Internals Book The official updates and errata page for the definitive book on Windows internals, by Mark Russinovich and David Solomon.
Windows Sysinternals Administrator’s Reference The official guide to the Sysinternals utilities by Mark Russinovich and Aaron Margosis, including descriptions of all the tools, their features, how to use them for troubleshooting, and example real-world cases of their use.
Download
Download Process Explorer(2.5 MB) Run now from Sysinternals Live.
Runs on:
Client: Windows Vista and higher (Including IA64).
Server: Windows Server 2008 and higher (Including IA64).
Installation
Simply run Process Explorer (procexp.exe).
The help file describes Process Explorer operation and usage. If you have problems or questions please visit the Process Explorer forum on Technet.
Note on use of symbols
When you configure the path to DBGHELP.DLL and the symbol path uses the symbol server, the location of DBGHELP.DLL also has to contain the SYMSRV.DLL supporting the server paths used. See SymSrv documentation or more information on how to use symbol servers.
Learn More
Here are some other handle and DLL viewing tools and information available at Sysinternals:
The case of the Unexplained. In this video, Mark describes how he has solved seemingly unsolvable system and application problems on Windows.
Handle — a command-line handle viewer
ListDLLs — a command-line DLL viewer
PsList — local/remote command-line process lister
PsKill — local/remote command-line process killer
Defrag Tools: #2 — Process Explorer In this episode of Defrag Tools, Andrew Richards and Larry Larsen show how to use Process Explorer to view the details of processes, both at a point in time and historically.
Windows Sysinternals Primer: Process Explorer, Process Monitor and More Process Explorer gets a lot of attention in the first Sysinternals Primer delivered by Aaron Margosis and Tim Reckmeyer at TechEd 2010.
—>
Controlling Processes and Threads in WinDbg
In WinDbg, the Processes and Threads window displays information about the systems, processes, and threads that are being debugged. This window also enables you to select a new system, process, and thread to be active.
Opening the Processes and Threads Window
To open the Processes and Threads window, choose Processes and Threads from the View menu. (You can also press ALT+9 or select the Processes and Threads button () on the toolbar. ALT+SHIFT+9 closes the Processes and Threads window.)
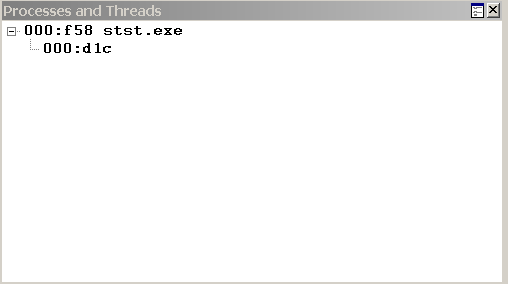
The following screen shot shows an example of a Processes and Threads window.
The Processes and Threads window displays a list of all processes that are currently being debugged. The threads in the process appear under each process. If the debugger is attached to multiple systems, the systems are shown at the top level of the tree, with the processes subordinate to them, and the threads subordinate to the processes.
Each system listing includes the server name and the protocol details. The system that the debugger is running on is identified as .
Each process listing includes the internal decimal process index that the debugger uses, the hexadecimal process ID, and the name of the application that is associated with the process.
Each thread listing includes the internal decimal thread index that the debugger uses and the hexadecimal thread ID.
Using the Processes and Threads Window
In the Processes and Threads window, the current or active system, process, and thread appear in bold type. To make a new system, process, or thread active, select its line in the window.
The Processes and Threads window has a shortcut menu with additional commands. To access the menu, select and hold (or right-click) the title bar or select the icon near the upper-right corner of the window (). The following list describes some of the menu commands:
Move to new dock closes the Processes and Threads window and opens it in a new dock.
Always floating causes the window to remain undocked even if it is dragged to a docking location.
Move with frame causes the window to move when the WinDbg frame is moved, even if the window is undocked.
Additional Information
For other methods of displaying or controlling systems, see Debugging Multiple Targets. For other methods of displaying or controlling processes and threads, see Controlling Processes and Threads.
Analyze a Running Process
Use the following commands to record and analyze the heap memory allocations in a running process. This analysis focuses on stack traces.
Parameters
-p:PID Specifies the process to analyze. PID is the process ID of the process. This parameter is required.
To find the PID of a running process, use Task Manager, Tasklist, or TList.
-f:LogFile Saves the log contents in a text file. By default, UMDH writes the log to stdout (command window).
LogFile specifies the path (optional) and name of the file. If you specify an existing file, UMDH overwrites the file.
NoteВ В If UMDH was not started in Administrator mode, or attempts to write to «protected» paths, it will be denied access.
-v[:MsgFile] Verbose mode. Generates detailed informational and error messages. By default, UMDH writes these messages to stderr.
MsgFile specifies the path (optional) and name of a text file. When you use this variable, UMDH writes the verbose messages to the specified file, instead of to stderr. If you specify an existing file, UMDH overwrites the file.
-g Logs the heap blocks that are not referenced by the process («garbage collection»).
-h Displays help.
Comments
On Windows 2000, if UMDH is reporting errors finding the stack trace database, and you have enabled the Create user mode stack trace database option in GFlags, you might have a symbol file conflict. To resolve it, copy the DBG and PDB symbol files for the application to the same directory, and try again.
 Download Process Explorer (2.5 MB)
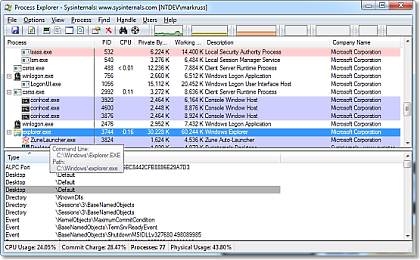

 ) on the toolbar. ALT+SHIFT+9 closes the Processes and Threads window.)