Просмотр отчетов в Консоли на Mac
Приложение «Консоль» может составлять различные отчеты, содержащие общую диагностическую информацию, а также сведения об операционной системе и приложениях. В боковом меню можно получить доступ к следующим отчетам.
Отчеты о сбоях. Системные отчеты и отчеты пользователей системы о сбоях приложений и процессов. Отчеты о сбоях имеют расширение .crash.
Отчеты Spindump. Системные отчеты и отчеты пользователей системы с подробной информацией о неполадках приложений и процессов. Отчеты Spindump имеют расширение .spin.
Отчеты журналирования. Системные отчеты и отчеты пользователей системы с информацией о событиях, произошедших во время работы системы или определенных приложений. Отчеты журналирования имеют расширение .log, ._log или .its.
Диагностические отчеты. Системные отчеты и отчеты пользователей системы с информацией о ресурсах аппаратного обеспечения, времени реакции системы и другими данными. Диагностические отчеты имеют расширение .diag или .dpsub.
Данные анализа Mac. Содержимое хранилища данных отслеживания сообщений доступно по адресу /var/log/DiagnosticMessages.
Системный журнал. Содержимое устаревшего файла системного журнала доступно по адресу /private/var/log/system.log.
Отчеты о пользователях поступают из приложений, в которых работает текущий пользователь. Системные отчеты — из компонентов операционной системы, которые относятся ко всем пользователям. Если Вы вошли в систему в качестве администратора, Вы можете просмотреть все отчеты. Если Вы вошли в систему не в качестве администратора, Вы можете просмотреть только отчеты пользователя.
В приложении «Консоль»  на Mac можно сделать следующее.
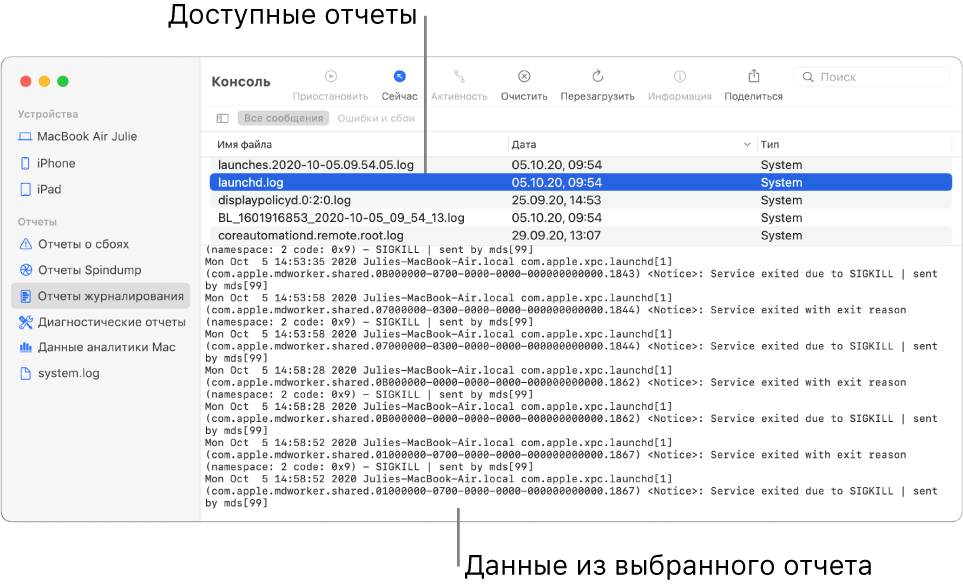
Просмотр отчета. Выберите тип отчета в разделе «Отчеты» в боковом меню (например, отчеты журналирования), затем выберите отчет в верхней части окна. Сведения об отчете появятся ниже.
Во время просмотра отчета у Вас есть следующие возможности.
Открыть отчет в отдельном окне. Дважды нажмите отчет.
Открыть отчет в Finder. Выберите «Файл» > «Показать в Finder».
Переместить отчет в Корзину. Выберите «Файл» > «Переместить в Корзину».
Сортировка отчетов. Поместите указатель на название столбца, по которому нужно выполнить сортировку, и нажмите кнопку мыши. Порядок всех строк в списке отчетов изменяется в соответствии с выбранным для упорядочения столбцом. Нажмите название столбца еще раз, чтобы изменить порядок сортировки.
Поиск текста в отчете. Дважды нажмите отчет, затем введите текст в поле поиска.
По мере ввода будут отображаться только подходящие результаты.
Источник
What is spindump mac os
A latency measurement tool
The «Spindump» tool is a Unix command-line utility that can be used for latency monitoring in traffic passing through an interface. The tool performs passive, in-network monitoring. It is not a tool to monitor traffic content or metadata of individual connections, and indeed that is not possible in the Internet as most connections are encrypted.
The tool looks at the characteristics of transport protocols, such as the QUIC Spin Bit, and attempts to derive information about round-trip times for individual connections or for the aggregate or average values. The tool supports TCP, QUIC, COAP, DNS, ICMP, and SCTP traffic. There’s also an easy way to anonymize connection information so that the resulting statistics cannot be used to infer anything about specific connections or users.
The software is under development, and subject to research on best algorithms.
The tool builds on the Spindump Library, which is a small, simple, and extensible packet analysis tool. It can be integrated into various systems, from routers to tools like the Spindump utility.
Spindump can now report bandwidth data (bytes/sec) for connections and aggregated connections. Spindump supports draft version 20 QUIC now, as a result of hacking at the QUIC interop in London, May 2019. Spindump now reads its own output sent as JSON from another Spindump instance; this can be used to aggregate data at a central point from multiple collection points. Spindump now supports Google QUIC as implemented in Chrome, has improved documentation, and its security has improved with a privilege downgrade on Linux. Spindump is also now able to send collected information to a selected web server or another Spindump instance.
See the news page for more details!
Spindump can be used to observe latency in ongoing connections for debugging purposes, as shown in the below figure:
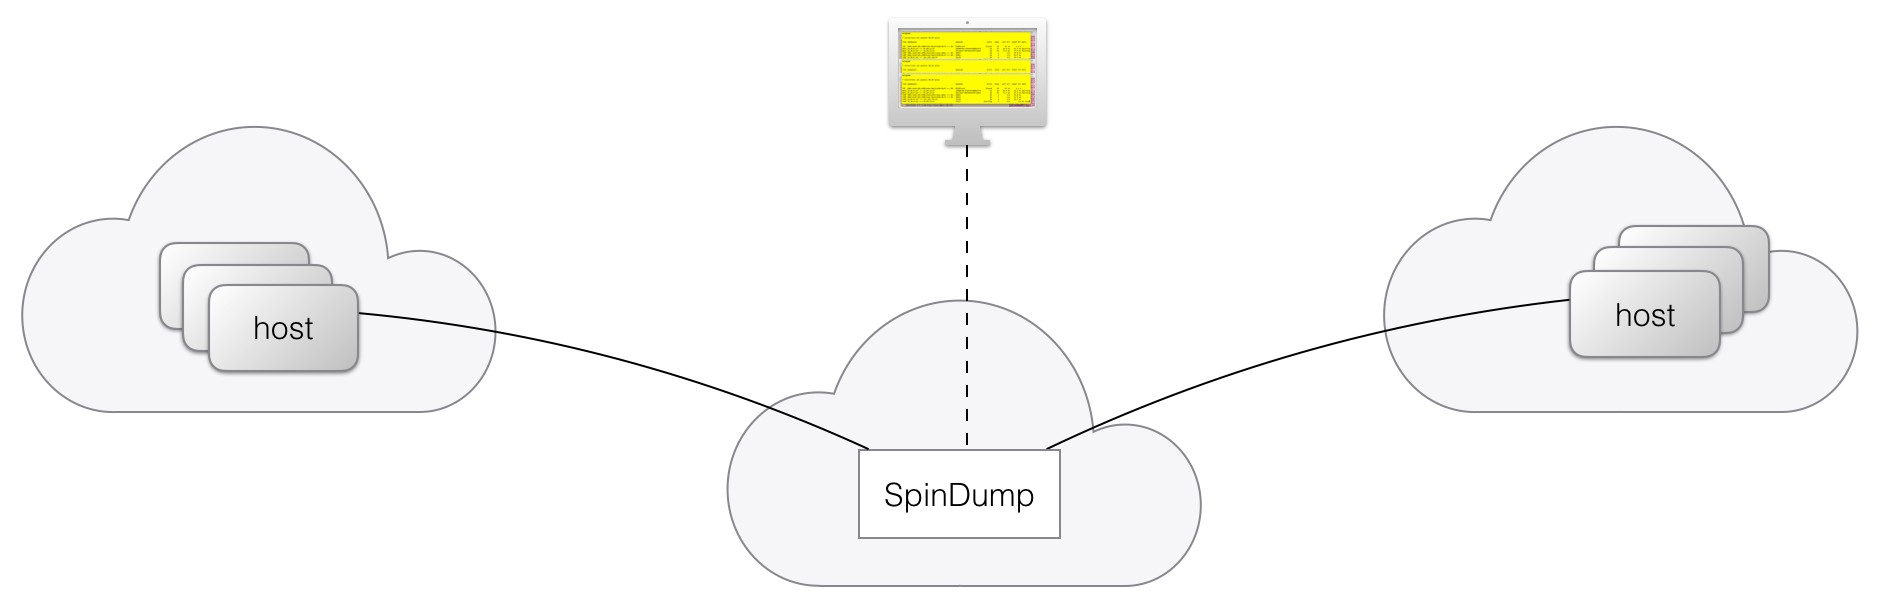
But Spindump could also be used to record information from experiments related to Spin Bit. And the Spin Bit being new in the QUIC design, hopefully it will also help in debugging this new feature.
Spindump can also be used to measure latencies on a more ongoing basis. It can feed information to management and other systems, and could for instance enable alarms to be raised when the circumstances demand that, configurations to be optimized, and so on.
Spindump Command Usage
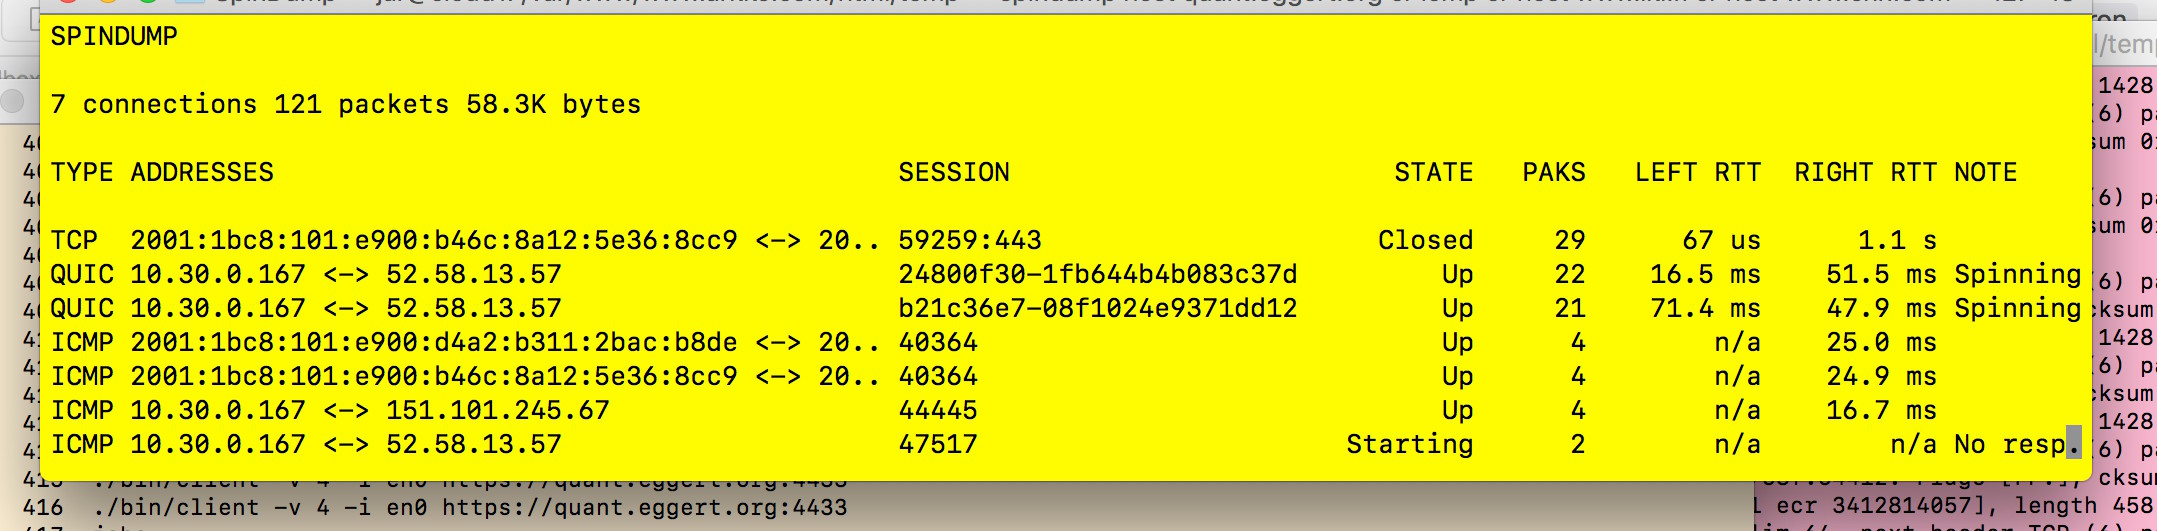
The software is packaged as the «spindump» utility, and simply typing
should show the most active sessions and their current round-trip times (RTTs). The top of the screen shows some status information, while the rest is dedicated to showing connections and their RTTs. You can exit from the tool by pressing Control-C or «Q». In addition, you can use «C» to toggle whether to show closed connections, «U» to whether to show UDP connections, or «A» to show either individual connections or aggregated connections. Pressing «H» shows help information and pressing «S» enables you to set the screen update frequency.
The full command syntax is
If no options or filter is specified, Spindump will look at all packets on the default interface. The filter specification is as specified in other PCAP-based tools such as tcpdump. See the man page for pcap-filter(7) for more details.
To simply start the Spindump tool on the default user interface is enough for most cases:
To look at specific connections, you can enter a filter specification. For instance, the expression «icmp» tracks only ICMP packets, and the expression «tcp and host www.example.com» tracks TCP packets where www.example.com appears either as a source or destination address. So, for instance:
would only look udp port 443 traffic (likely QUIC).
See the usage description for the full description of all options!
The easiest installation method is to retrieve the software from GitHub. Start with this:
Make sure you have the necessary tools to compile; you’ll need the gmake, gcc, and libpcap packages at least. On a Mac OS X, you can install these with the
command. On Ubuntu/Debian linux, do:
On Fedora linux, do:
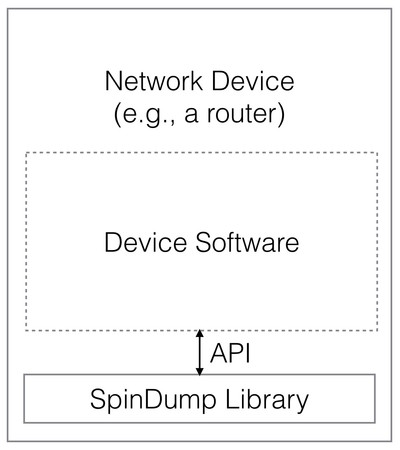
The Spindump software builds on the Spindump Library, a simple but extensibile packet analysis package. The makefile builds a library, libspindump.a that can be linked to a program, used to provide the same statistics as the spindump command does, or even extended to build more advanced functionality. The Spindump command itself is built using this library.
The library can also be used in other ways, e.g., by integrating it to other tools or network devices, to collect some information that is necessary to optimize the device or the network in some fashion, for inst.ance.
See the library API definition page for all the details.
The Spindump command depends on the basic OS libraries (such as libc) as well as libpcap, ncurses, curl, and microhttpd. The Spindump library depends only on libc, unless you use the features that would require libpcap or other libraries.
The software is being worked on, and as of yet seems to be working but definitely needs more testing. IP packet fragmentation is recognised but no packet reassembly is performed; an optional reassembly process would be a useful new feature. The beginnings of connection data anonymization are in the software, but more work is needed on that front as well.
The full list of known bugs and new feature requests can be found from GitHub.
The full documentation of Spindump consists of the following:
- README (this file) contains the introduction and installation instructions.
- The command usage description describes how to use the Spindump command-line tool.
- The format description explains what format Spindump measurement data can be carried in, if it is sent to a collection point rather than shown visually to the user.
- Library API definition contains the definition of the Spindump library API, and an explanation of how and when to use the library
- Full API definition contains the definition of all components in the Spindump library
- News describes recent additions.
About
Spindump is an in-network latency measurement tool with support for QUIC and TCP
Источник
Disable tailspind and spindump to Speed Up your Mac

Apple’s macOS High Sierra introduced enough performance enhancements that my dual-core, 2011 MacBook Air felt like it had new life breathed into it. Occasionally, though – and more and more frequently recently – events would cascade such that my CPU would run at full tilt for 5-10 minutes before finally settling in. When that was happening, Activity Monitor and/or iStat Menus would show two system processes chewing up CPU: tailspind and spindump. Time to figure out how to stop that!
Research led me to these two very loosely-defined scenarios where tailspind and spindump would decide to run 1 :
- An application asks tailspind and spindump to take a snapshot of the state of that application and write it out to disk, or;
- Some application or process would consume maximum CPU for some period of time (30 seconds seems to be the general consensus), and then tailspind and spindump would fire up to take a snapshot of what was going on for future debugging purposes.
It’s this second case that kept happening to me, and possibly to you. The problem is that it would create a cascading scenario of constrained CPU resources where one app would run, then spindump/tailspind would run, consuming CPU of its own, causing other apps to run for too long, causing spindump/tailspind to fire up again … and so on and so forth. This would go on until finally everything had finished. In the interim it would be tailspind and spindump consuming a majority of the CPU while the processes you actually want to run tried to squeak by.
I looked at the logfiles created by spindump/tailspind and they (basically) told me what I already knew: some process needed a significant amount of work done and my 6-year-old CPU took longer than some pre-set limit to do it.
I certainly don’t need extra CPU resources dedicated to telling me that something I’ve decided to run is using the CPU. I know that already. I run Activity Monitor and can see it. And, generally-speaking, the “why?” behind the extra CPU usage is already known, too.
Given this, I set about disabling spindump and tailspind, and my life has been blissful ever since. My MacBook Air wakes up quickly and is immediately responsive. Reboots are no longer something I dread, battery life is much better, and, quite frankly, my machine is fully usable again. It feels like I rewound 4 years in terms of general usability.
Disabling tailspind and spindump on macOS High Sierra
macOS High Sierra 2 includes System Integrity Protection, which means that certain files are untouchable and uneditable. This has the benefit of helping keep your system files pure and malware-free, with the cost of flexibility.
To disable tailspind and spindump we need that flexibility, and that means temporarily disabling System Integrity Protection (SIP). To disable SIP:
- Boot your Mac into Recovery Mode by restarting with Command-R held down until the Apple logo appears.
- Once your Mac is in Recovery Mode, go to Utilities > Terminal .
- In the Recovery Mode Terminal, issue csrutil disable and press return.
- Reboot your Mac.
Once SIP is disabled, the steps to disable tailspind and spindump are pretty straightforward 3 . Launch Terminal and type/paste the following four commands. The first two turn off and render spindump useless, and then the second two do the same for tailspind:
- sudo launchctl unload -w /System/Library/LaunchDaemons/com.apple.spindump.plist
- sudo mv /System/Library/LaunchDaemons/com.apple.spindump.plist /System/Library/LaunchDaemons/com.apple.spindump.plist.bak
- sudo launchctl unload -w /System/Library/LaunchDaemons/com.apple.tailspind.plist
- sudo mv /System/Library/LaunchDaemons/com.apple.tailspind.plist /System/Library/LaunchDaemons/com.apple.tailspind.plist.bak
Make sure to re-enable SIP when you’re finished by performing the steps to disable SIP (in Recovery Mode again), and issuing csrutil enable as step #3.
That’s it. From this point forward, tailspind and spindump will be disabled and will not run on your Mac 4 . It’s advisable to check these after macOS upgrades as it’s entirely possible that an upgrade could re-enable these processes without any warning.
Источник
Отключите tailspind и spindump, чтобы ускорить ваш Mac
После установки MacOS Big Sur в качестве основной обратил внимание на повышенную нагрузку на CPU, загрузка поднималась до 100% и так держалась 5-10 минут. Когда это происходило, в Activity Monitor отображались два системных процесса tailspind и spindump.
Исследования привели меня к двум очень слабо определенным сценариям, в которых tailspind и spindump решили запуститьcя :
- Приложение просит tailspind и spindump сделать снимок состояния этого приложения и записать его на диск;
- Некоторое приложение или процесс потребляли максимум процессорного времени в течение некоторого периода времени (30 секунд, по-видимому, является общим значением), а затем запускались tailspind и spindump, чтобы сделать снимок того, что происходило в будущих целях отладки.
В моём случае было похоже на второй вариант. Проблема возникала при повышенной нагрузке определенными приложениями, что вызывало запуск spindump/tailspind, которые включаясь тормозили систему из-за чего повышалась нагрузка на других приложениях из-за чего снова производился запуск spindump/tailspind и так до тех пор, пока не были закрыты практически все приложения.
Проверив log файлы создаваемые spindump/tailspind я лишний раз убедился в причине их запуска.
Одним словом я решил отключить spindump и tailspind, и с тех пор мой MacBook Pro быстро просыпается и моментально реагирует, время работы от батареи немного улучшилось.
Отключение автозапуска spindump`а в macOS
В MacOS от High Sierra и выше Apple включила защиту целостности системы, что означает, что некоторые файлы недоступны для редактирования. Это помогает поддерживать чистоту и отсутствие вредоносных программ в ваших системных файлах за счет гибкости.
Для отключения tailspind и spindump нам нужно временно отключить защитк целостности системы (SIP). Чтобы отключить SIP:
- Загрузите Mac в режиме восстановления, перезапустив его, удерживайте нажатыми клавиши Command-R до появления логотипа Apple.
- Когда ваш Mac запустится в режиме восстановления, перейдите в « Утилиты»> «Терминал» .
- В терминале режима восстановления выполните команду csrutil disable
- Перезагрузите свой Mac.
Как только SIP отключен, шаги по отключению tailspind и spindump довольно просты . Запустите терминал и введите/вставьте следующие четыре команды. Первые две отключают и делают spindump бесполезным, а затем вторые две делают то же самое для tailspind:
- sudo launchctl unload -w /System/Library/LaunchDaemons/com.apple.spindump.plist
- sudo mv /System/Library/LaunchDaemons/com.apple.spindump.plist /System/Library/LaunchDaemons/com.apple.spindump.plist.bak
- sudo launchctl unload -w /System/Library/LaunchDaemons/com.apple.tailspind.plist
- sudo mv /System/Library/LaunchDaemons/com.apple.tailspind.plist /System/Library/LaunchDaemons/com.apple.tailspind.plist.bak
Обязательно включите SIP по завершении, выполнив шаги по отключению SIP (снова в режиме восстановления) и выполнив csrutil enable
Вот и все. С этого момента, tailspind и spindump будут отключены и не будут работать на вашем Mac. Рекомендуется проверять их наличие после обновлений macOS, поскольку вполне возможно, что обновление может снова включить эти процессы без какого-либо предупреждения.
Если есть желание отключить какие-то другие ненужные для вас службы, вы также можете воспользоваться скриптом для их блокировки (выполнять нужно в режиме восстановления), рекомендую предварительно ознакомится с его содержимым, чтобы не заблокировать используемые вами службы.
Добавить комментарий Отменить ответ
Для отправки комментария вам необходимо авторизоваться.
Источник


