- Kdump — диагностика и анализ причин сбоев ядра
- Установка и настройка kdump
- Тестируем kdump
- Диагностика причин сбоя с помощью утилиты crash
- Заключение
- Common Reasons for Ubuntu Crashes and How to Recover
- How To Free Up Hard Drive Space
- Low Memory
- How To Perform a Memory Test
- Other Hardware Failures
- Intermittent Hardware Problems
- Recovering From an X Server Crash
- Boot Linux From Another Source
- Take A Core Dump: What to do when your app crashes on Linux
- What does it mean to “core dump”?
- So what is a core dump and what information does it contain?
- How does one enable the core dump to be generated, and where can I find this file?
Kdump — диагностика и анализ причин сбоев ядра

Хотя в современных Linux-системах ядро отличается достаточно высоким уровнем стабильности, вероятность серьезных системных ошибок, тем не менее, имеется всегда. Когда происходит неисправимая ошибка, имеет место состояние, называемое паникой ядра (kernel panic): стандартный обработчик выводит на экран информацию, которая должна помочь в устранении неисправности, и входит в бесконечный цикл.
Для диагностики и анализа причин сбоев ядра разработчиками компании RedHat был разработан специализированный инструмент — kdump. Принцип его работы можно кратко описать следующим образом. Создается два ядра: основное и аварийное (именно оно используется для сбора дампа памяти). При загрузке основного ядра под аварийное ядро выделяется определенный размер памяти. При помощи kexec во время паники основного ядра загружается аварийное и собирает дамп.
В этой статье мы подробно расскажем о том, как конфигурировать kdump и анализировать с его помощью системные ошибки. Мы рассмотрим особенности работы с kdump в OC Ubuntu; в других дистрибутивах процедуры настройки и конфигурирования kdump существенно отличаются.
Установка и настройка kdump
Установим kdump с помощью команды
Настройки kdump хранятся в конфигурационном файле /etc/default/kdump-tools
Чтобы активировать kdump, отредактируем этот файл и установим значение параметра USE_KDUMP=1.
Также в конфигурационном файле содержатся следующие параметры:
- KDUMP_KERNEL — полный путь к аварийному ядру;
- KDUMP_INITRD — полный путь к initrd аварийного ядра;
- KDUMP_CORE — указывает, где будет сохранен файл дампа ядра. По умолчанию дамп сохраняется в директории /var/crash (KDUMP_CORE=/var/crash);
- KDUMP_FAIL_CMD — указывает, какое действие нужно совершить в случае ошибки при сохранении дампа (по умолчанию будет выполнена команда reboot -f);
- DEBUG_KERNEL — отладочная версия работающего ядра. По умолчанию используются /usr/lib/debug/vmlinux-$. Если значение этого параметра не установлено, утилита makedumpfile создаст только дамп всех страниц памяти;
- MAKEDUMP_ARGS — содержит дополнительные аргументы, передаваемые утилите makedumpfile. По умолчанию этот параметр имеет значение ‘-c -d 31’, указывающую, что необходимо использовать сжатие и включать в дамп только используемые страницы ядра.
Установив все необходимые параметры, выполним команду update-grub и выберем install the package maintainer’s version.
Затем перезагрузим систему и убедимся в том, что kdump готов к работе:
Обратим особое внимание на параметр crashkernel=384 -:128M. Он означает, что аварийное ядро будет использовать 128 Мб памяти при загрузке. Можно прописать в grub параметр crashkernel = auto: в этом случае память под аварийное ядро будет выделяться автоматически.
Для того, чтобы мы могли анализировать дамп с помощью утилиты crash, нам понадобится также файл vmlinux, содержащий отладочную информацию:
По завершении установки еще раз проверим статус kdump:
Если kdump находится в рабочем состоянии, на консоль будет выведено следующее сообщение:
Тестируем kdump
Вызовем панику ядра при помощи следующих команд:
В результате их выполнения система «зависнет».
После этого в течение нескольких минут будет создан дамп, который будет доступен в директории /var/crash после перезагрузки.
Информацию о сбое ядра можно просмотреть с помощью утилиты crash:
На основе приведенного вывода мы можем заключить, что системному сбою предшествовало событие «Oops: 0002 [#1] SMP», произошедшее на CPU2 при выполнении команды tee.
Утилита crash обладает также широким спектром возможностей для диагностики причин краха ядра. Рассмотрим их более подробно.
Диагностика причин сбоя с помощью утилиты crash
Crash сохраняет информацию обо всех системных событиях, предшествовавших краху ядра. С ее помощью можно воссоздать состояние системы на момент сбоя: узнать, какие процессы были запущены на момент краха, какие файлы открыты и т.п. Эта информация помогает поставить точный диагноз и предупредить крахи ядра в будущем.
В утилите crash имеется свой набор команд:
Для каждой этой команды можно вызвать краткий мануал, например:
Все команды мы описывать не будем (с детальной информацией можно ознакомиться в официальном руководстве пользователя от компании RedHat), а расскажем лишь о наиболее важных из них.
В первую очередь следует обратить внимание на команду bt (аббревиатура от backtrace — обратная трассировка). С ее помощью можно посмотреть детальную информацию о содержании памяти ядра (подробности и примеры использования см. здесь). Однако во многих случаях для определения причины системного сбоя бывает вполне достаточно команды log, выводящее на экран содержимое буфера сообщений ядра в хронологическом порядке.
Приведем фрагмент ее вывода:
В одной из строк вывода будет указано событие, вызвавшее системную ошибку:
С помощью команды ps можно вывести на экран список процессов, которые были запущены на момент сбоя:
Для просмотра информации об использовании виртуальной памяти используется команда vm:
Команда swap выведет на консоль информацию об использовании области подкачки:
Информацию о прерываниях CPU можно просмотреть с помощью команды irq:
Вывести на консоль список файлов, открытых на момент сбоя, можно с помощью команды files:
Наконец, получить в сжатом виде информацию об общем состоянии системы можно с помощью команды sys:
Заключение
Анализ и диагностика причин падения ядра представляет собой очень специфическую и сложную тему, которую невозможно уместить в рамки одной статьи. Мы еще вернемся к ней в следующих публикациях.
Читателей, которые не могут оставлять комментарии здесь, приглашаем к нам в блог.
Источник
Common Reasons for Ubuntu Crashes and How to Recover
We give you as many solutions as possible
Any operating system can crash, including Ubuntu. If you are running Linux and have a problem, here are a few reasons and solutions to help you get out of your crash.
If Ubuntu hangs, the first thing to try is to reboot your system. Sometimes you might have to do a cold boot. Power your computer off and then bring it back up. Restarting your computer resolves many problems such as low memory, application crashes, and the browser hangs.
Make note of what you did just before the computer crashed. If it always happens while using a specific application, research to find out if there are any updates or known issues. Some applications are known to crash at times, such as Audacity and OpenShot Video Editor.

To resolve application issues, restart, repair or reload the software. Or, notify the people who created it.
Firefox updates have also caused Linux to freeze. You may have to avoid using Firefox until they fix the issues.
If an application is not causing your problem, you may be out of room on your hard drive or have a hardware issue.
This article covers the following ways to diagnose and recover from a crash:
- Freeing up hard drive space
- Testing your memory
- Hardware failures
- Intermittent hardware problems
- Recovering from an X Server crash
- Boot Linux from another source
How To Free Up Hard Drive Space
- To find out how much free space you have on your hard drive, click the Start Button, then Accessories, and then Disks.
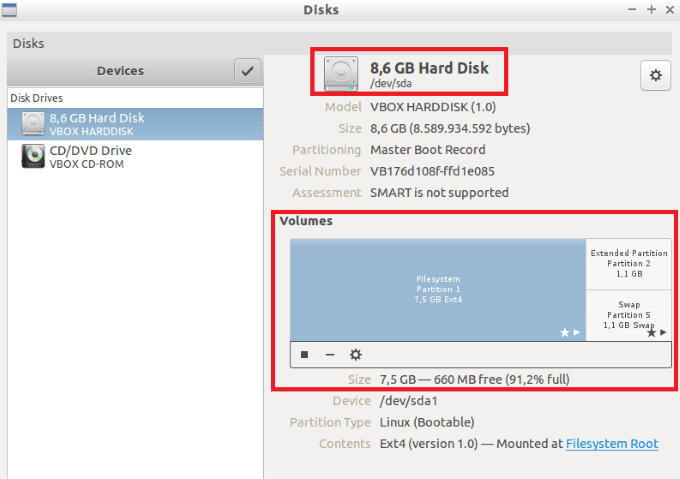
Ubuntu doesn’t have the same disk clean-up tools and built-in defrag like Windows. So, what can you do to free up some disk space?
- Empty your trash
- Delete .ISO downloads
- Remove old kernels you no longer need
- Uninstall games and apps you don’t use
- Use a system cleaner
- Regularly clean APT Cache
- Keep your system updated
The last bullet point above might seem counterintuitive. Linux updates free up space as opposed to Windows updates that take up more space.
Low Memory

If you are running Ubuntu and your system randomly crashes, you may be running out of memory. Low memory could be caused by opening more applications or data files than will fit in the memory you have installed.
If that is the problem, do not open so much at one time or upgrade to more memory on your computer.
Another cause of low memory is a failing RAM. Run a memory test to determine whether your RAM memory is bad.
How To Perform a Memory Test
- Start by turning on or restarting your system.
- Bring up the GRUB menu by holding down Shift on your keyboard.

- Using the arrow keys, find the Ubuntu memtest86+ label.
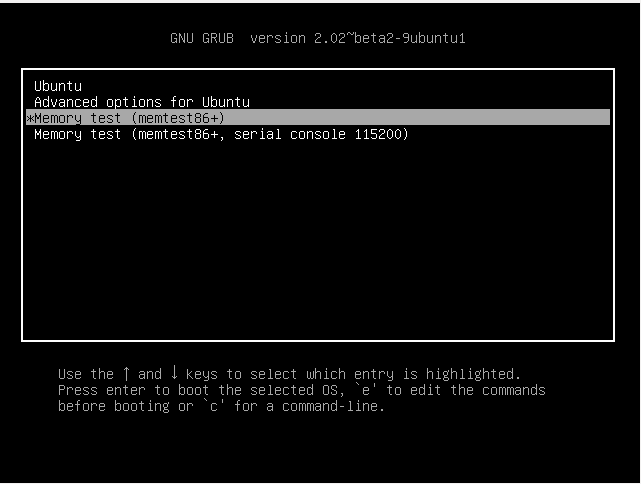
- After you press the enter key, the memory test will automatically run. You will see a blue screen while the test is running.
- The test won’t end until you press the escape key. Let the test run for at least one full pass. If your problem is very intermittent, let the test run much longer.
Should the test find any errors, you need to replace one of your RAM memory cards.
Other Hardware Failures
If your computer powers off and will not power on at all (has no lights and no sounds), first check to make sure there is power at the outlet. The most likely cause if you have power at the outlet is a bad power supply.
If it tries to power up and then powers back down within 30 seconds, you may have a slow or non-moving fan. Or the sensor that detects fan speed may be failing.
Other components that can cause your computer to crash are:
- Overheating due to fans being slow or not turning at all
- Hard drive crash
- Bad power supply
- Failing motherboard or CPU
- Graphics card problems
- Sensors
You can also test your hard drive for failures yourself. A certain number of errors are acceptable. Even new hard drives already have some errors.

If you know how to do your own repairs, replace the failing component. Otherwise, have your computer technician repair your machine.
Intermittent Hardware Problems
The most common causes of sporadic problems are overheating memory failures and hard drive errors.
If testing doesn’t identify the failing component, you may have to replace them one at a time until you find the problem.
Recovering From an X Server Crash
Linux systems provide multiple ways to recover from a crash. The easiest way is a reboot. But there are other methods:
- Use a keyboard shortcut to restart the X server.
- Switch virtual consoles.
- Kill the X server over the network using SSH.
- Use the Magic SysRq key.
Boot Linux From Another Source
What if your computer powers on but refuse to load Linux? You could have a bad hard drive, or the operating system files could be corrupted.
If you have made an Ubuntu Live CD or USB, you can boot from that other operating system.
You need to have done this in advance. Or, you make a Live boot on a different computer.
Many factors can cause your system to crash. There isn’t one solution. In the worst-case scenario, if none of the above suggestions work, you may need a new computer or a good computer technician.
David has a background in small business and lives in Australia. He is a WordPress and Ubuntu Developer who enjoys design, CSS and tech tool integration. Read David’s Full Bio
Источник
Take A Core Dump: What to do when your app crashes on Linux
With many things in life, more choices means more freedom of expression. We can pick and choose what we like personally as a way to express ourselves. Such is the world on Linux. The myriad of different Linux distros along with all the different Desktop managers and Window managers available are daunting. While more choices is nice (in general anyway), it can also cause more confusion. As a cross-platform developer, you’re probably aware that every operating system has their own way of dealing with crashes and crash reports. On Linux this is no different, but it is more confusing because not every Linux distro plays by the same configuration. This blog will answer some fundamental questions you may have about what happens when your application crashes on Linux.
What does it mean to “core dump”?
Whenever an application crashes (and I don’t mean crashing with a Xojo Exception, for example), the operating system can store (or even send) a crash report. On OS X a nice crash reporter dialog shows up and you can even view the details of the crash report and get a sample of the stack trace. On Windows you may receive a similar such dialog, with a button to send the report to Microsoft. This crash report will show up in our Windows Error Reporting dashboard that we have setup with Microsoft, so please do hit that button when you can, it will help us out a lot. On Linux, whenever an app crashes (most commonly by a segmentation fault, i.e. when accessing a bad pointer/memory), it has the option of generating a core dump. In most cases though, this core dump generation is disabled by default.
So what is a core dump and what information does it contain?
Just like the crash report you see on OS X or the crash report you send us from a Windows crash, it’s a file which contains the program’s running state at the point of the crash. It also contains a snapshot of all the virtual memory areas accessed by your app, so yes, there can be confidential information stored in a core dump so be careful who you give it to.
How does one enable the core dump to be generated, and where can I find this file?
This actually depends on your Linux distro/configuration. For purposes of keeping this brief, I will detail the most common steps with links to read further if desired. Let’s assume we’re on a Linux distro that has a running Terminal using bash (for example, Ubuntu distros running Gnome desktop manager). To start, we need to tell the system how big of a core dump to allow. To do this, type the following line in your Terminal:
Exit fullscreen mode
By default, this value is 0, which is why the core dump is never generated. Executing the above line in a bash Terminal will allow the core dump to be generated for that Terminal session. The “unlimited” parameter tells the system not to restrict the size of the core dump file. Now assume you have an application that does crash, run that application in your Terminal session and wait for it to crash. Here’s a very simple example that generates a core dump. I’m on a 64-bit Ubuntu distro and I have failed to install the 32-bit ICU libraries:

After this terminates, you should see a “core” file generated in your current directory (however, depending on your configuration this may be located elsewhere).

Now that you have the core file, you can send this to the developer and he can debug it using gdb. Assuming the developer has access to the debug symbols (or can build the offending crashing app/lib with debug symbols), he/she can gather a fairly decent stack trace to figure out what the issue is. If you’re even slightly curious as to the stack trace, you could even debug this yourself if you know what the offending app/lib that crashed is. In our simple example, I know the crash occurs in XojoConsoleFramework32.so, so I would run gdb like this on the core file:

Now that the core file is loaded in gdb, you can proceed to perform a backtrace:

Note that gdb doesn’t load any debug info from our framework library since we don’t build release frameworks with debug info in them. We do however, store these debug info files locally and use them for purposes of debugging core dumps. So the core file itself, along with the right debug information, is extremely useful to have in debugging the crash. If your Linux app ever crashes, now you know how to generate a core dump, where to find it, and hopefully you’ll be able to send it to the developer(s) so that they can debug it.
Here are some additional resources for further investigation, depending on your needs/distro.
Источник


