Установка виджета температуры процессора и видеокарты для Windows 10
Гаджет, отображающий температуру графического и центрального процессора, необходим для удобства наблюдения за динамикой нагрева этих устройств. Особенно он важен для ноутбуков и стареньких компьютеров, которые не предназначены для работы с современным программным обеспечением.
Постоянный мониторинг за показателями актуален, если CPU или GPU греются из-за того, что лопасти вентилятора и пластины радиатора забиты пылью. Еще распространённая причина изрядного нагрева железа – высохшая термопаста, которая потеряла свои свойства теплопроводности.
Если устранить причину значительного выделения тепловой энергии пользователь не в силах, следует установить виджет температуры процессора и видеокарты для Windows 10. Так как разработчики операционной системы избавились от гаджетов в «Десятке», их можно вернуть одним из следующих способов:
- через гаджеты в программе 8GadgetPack;
- при помощи программы AIDA 64;
- посредством информационной утилиты HWiNFO32.
All CPU Meter
Виджет входит в состав программы 8GadgetPack, вызванной вернуть Windows 10 привычный пользователям функционал плавающих информационных окошек. Он отображает сведения, касающиеся только загрузки центрального процессора. Кроме температуры это: нагрузка на каждое из задействованных ядер, количество использованной оперативной памяти, текущая частота и модель кристалла.
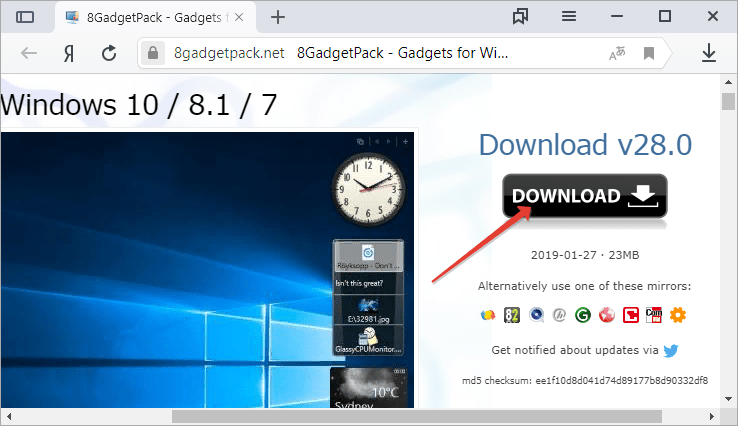
1. Скачайте установщик приложения с сайта https://8gadgetpack.net/ .
2. Инсталлируйте и запустите программу. Подробнее об установке можно прочитать в инструкции (Как установить гаджеты).
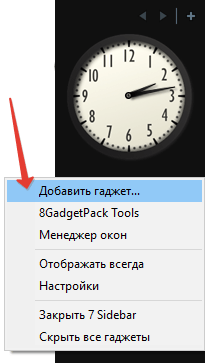
3. Чтобы вывести информер кликните правой клавишей по панели виджетов, которая появится у правой стороны рабочего стола и вызовите команду «Добавить…».
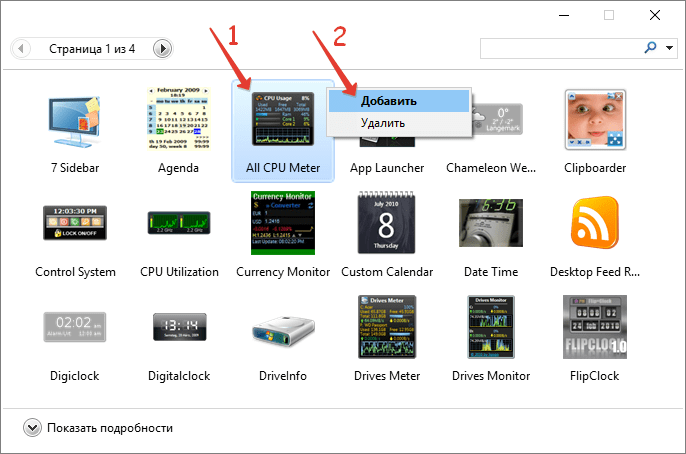
4. Через контекстное меню элемента «All CPU Meter» вызовите команду для его отображения на панели.
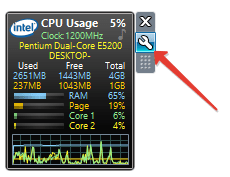
5. Переместите окошко в удобное место на рабочем столе, кликнув по названию процессора в нём. Щелчки по иных областях не позволят изменить положение элемента.
6. Зайдите в настройки при помощи иконки рожкового ключа правее от окна.
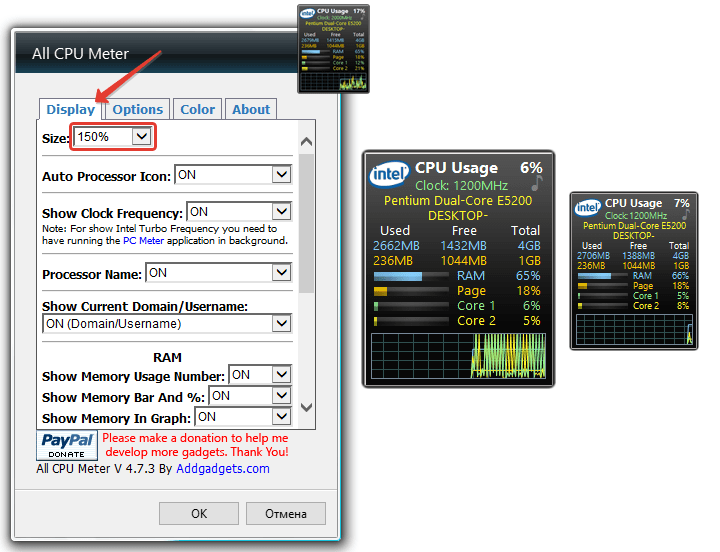
7. Внесите нужные изменения во вкладке «Display» — здесь можно отключить визуализацию неинтересной информации, увеличить размер гаджета.
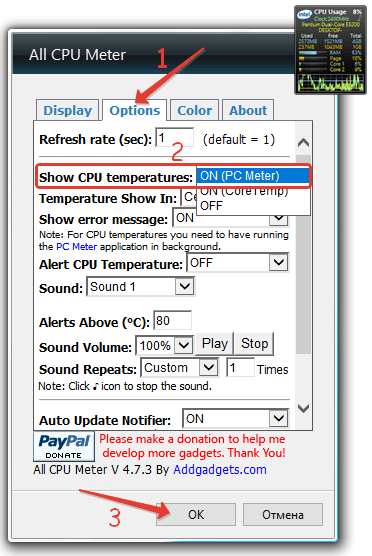
8. Во вкладке «Options» в строчке «Show CPU temperatures» выберите значение «ON PC Meter» или «ON All CPU Meter» в зависимости от выбранного приложения.
9. Укажите остальные данные при необходимости:
- единицы измерения температуры;
- частота обновления информации «Refresh rate (sec)»;
- предупреждение при достижении критического значения, в том числе звуковое;
- предельная температура и т.д.
Во вкладке «Color» задаются цвета, в которые окрасятся те или иные параметры.
В нижних строчках отобразится температура каждого из активных ядер процессора.
HWiNFO32
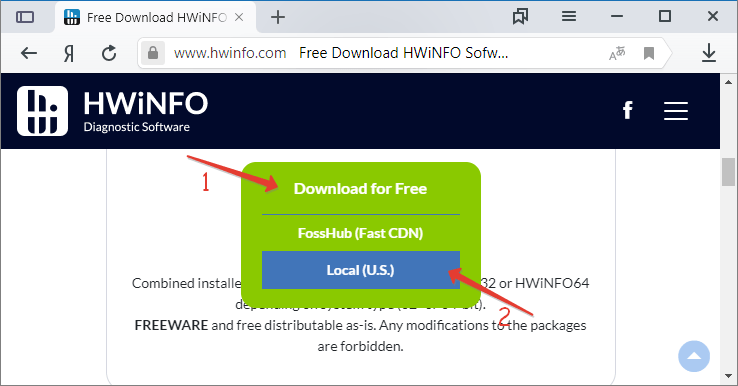
1. Загрузите подходящую версию информационной утилиты по ссылке. https://www.hwinfo.com/download/ .
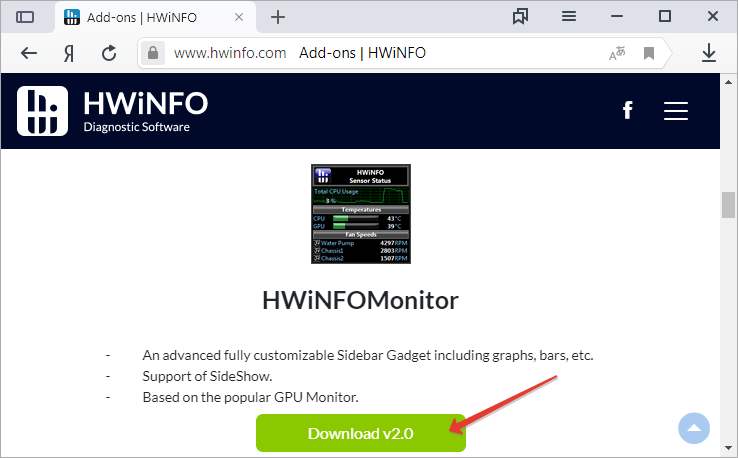
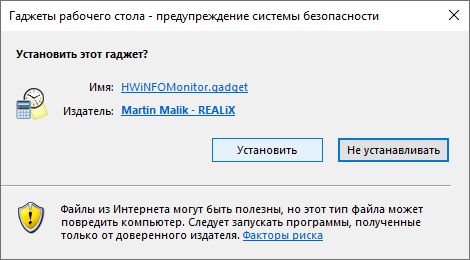
2. Скачайте официальный гаджет со страницы разработчика программы. https://www.hwinfo.com/add-ons/ .
3. Запустите и установите их.
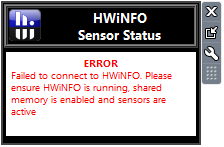
В итоге появится пустой гаджет. Его необходимо настроить через HWiNFO32.
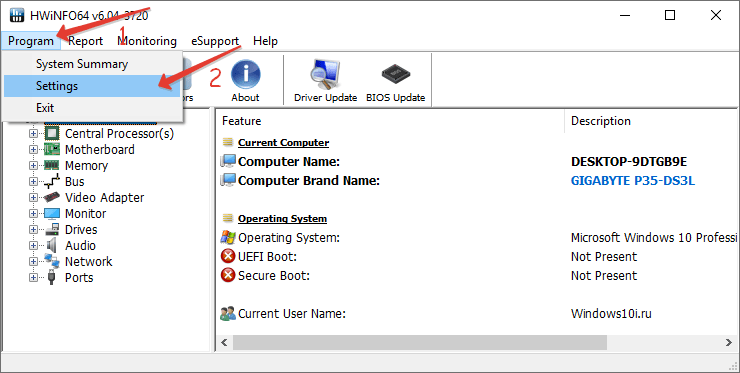
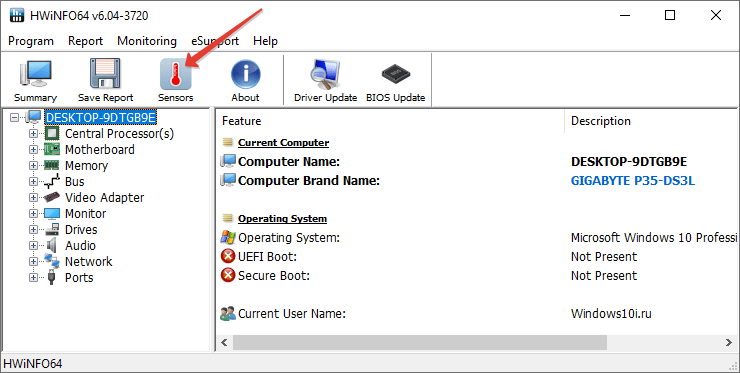
4. Запустите программу и зайдите в параметры её конфигурации через пункт меню «Settings».
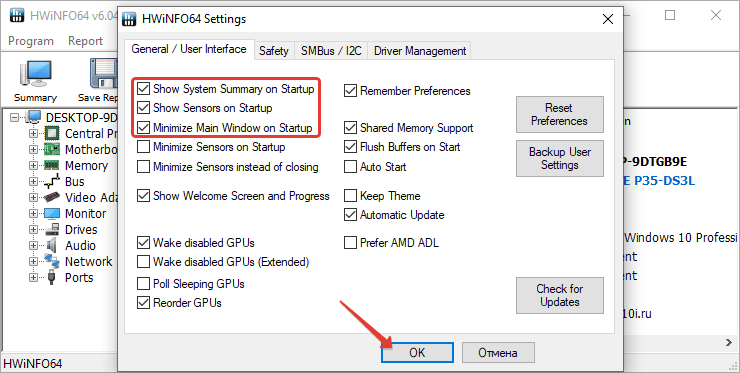
5. Поставьте флажки возле трёх первых пунктов настроек и «Shared Memory Support».
6. Откройте окно «Sensors» через панель инструментов.
После в окне гаджета появится огромный перечень сведений с датчиков. В строке находится температура центрального процессора.
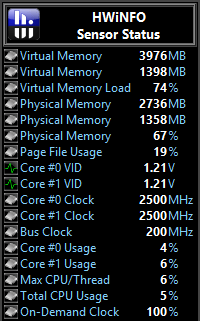
Чтобы информация не исчезла, сверните окно «Sensor Status». HWiNFO должна работать и передавать сведения гаджету, иначе его окно будет пустым.
В настройках доступно множество параметров цвета, текста.
AIDA64
1. Скачайте пробную версию AIDA64 Extreme (можно портативную) и запустите утилиту. https://www.aida64.com/downloads .
2. После считывания информации со всех сенсоров откройте первый пункт главного меню и зайдите в настройки.
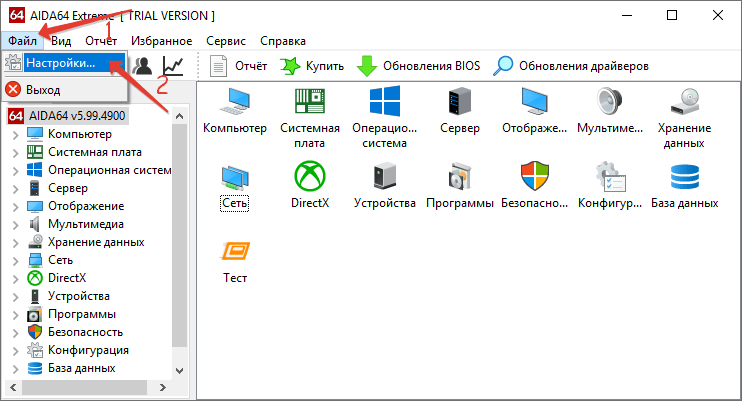
3. Разверните список «Мониторинг температуры» и кликните по ссылке «SensorPanel».
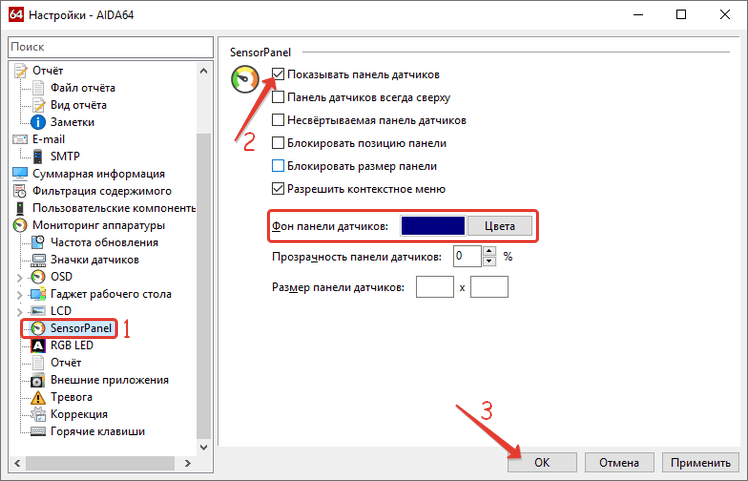
4. Отметьте флажком «Показать панель датчиков».
5. Выберите фоновый цвет окна, его прозрачность и размер, сохраните конфигурацию.
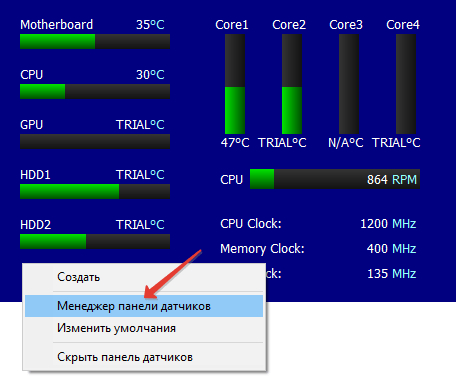
6. Кликните правой кнопкой по панели и выберите «Менеджер панели датчиков».
7. Удалите ненужные показатели, измените их последовательность.
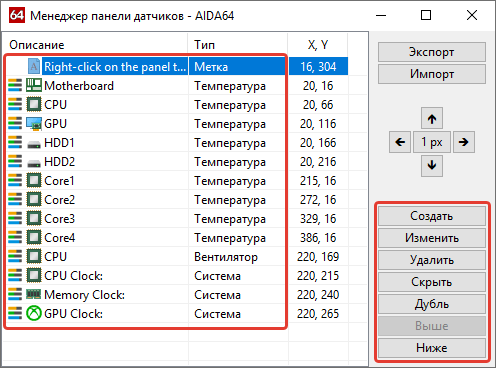
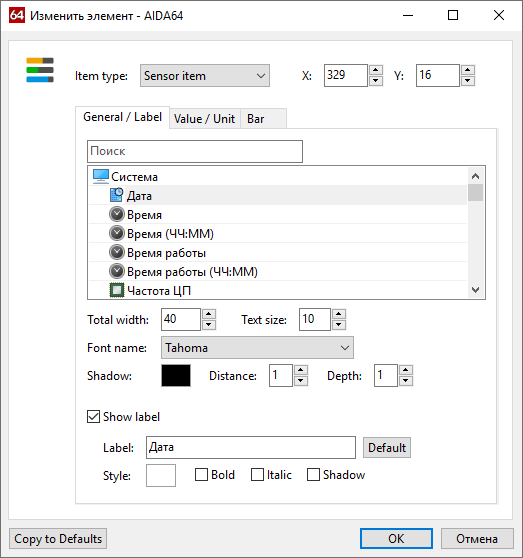
Двойным кликом по любому из параметров откроется окно для его изменения. Здесь можете указать ряд его переменных: цвет, название, значение, размер, положение, шрифт и т.д.
Вид сенсорной панели можно сохранить в отдельный файл при помощи команды «Экспорт».
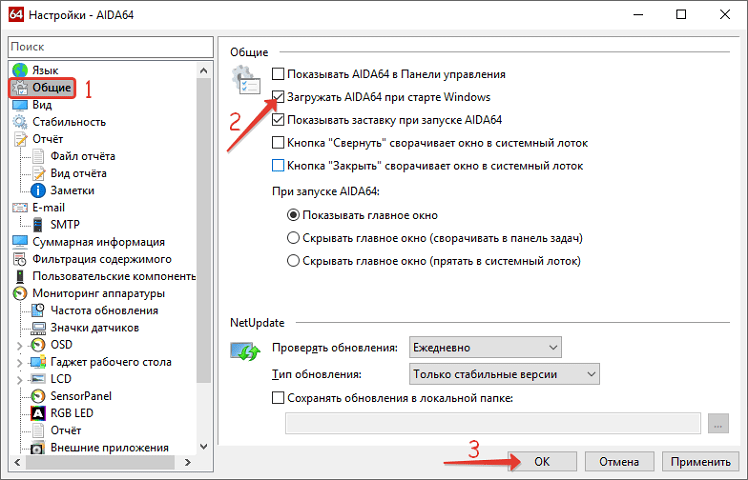
Для автоматического старта гаджета зайдите в настройки и активируйте опции автозапуска утилиты при старте Windows 10 и запуска окна в свернутом виде.
AIDA64 – единственная, программа, которая позволяет мониторить за температурой не только Цп (центрального процессора), но и ядра графической карты. Она же содержит наибольшее количество настроек информационной панели.
GPU Monitor
Монитор ГП — гаджет, который ставится через 8GadgetPack. Скачивайте его и устанавливайте при наличии этой программы. http://7gadget.net/engine/download.php?id=726. Виджет автоматически появится на рабочем столе. Также может быть полезно: «виджеты погоды, температуры процессора и видеокарты, а также часы для рабочего стола».
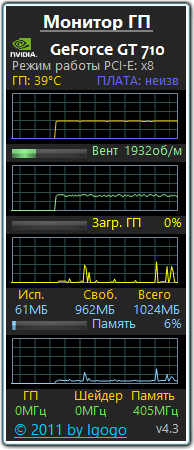
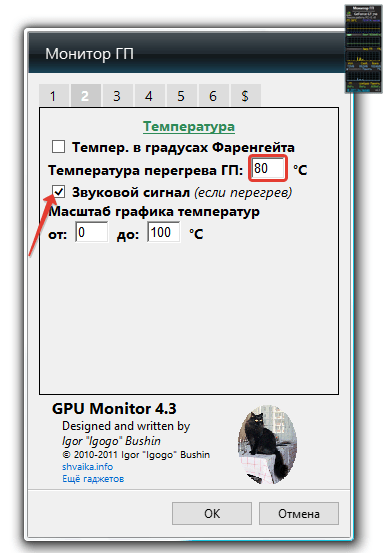
1. Зайдите в настройки и выберите видеокарту.
2. Во второй вкладке укажите единицу её измерения, необходимость в звуковом предупреждении после достижения критической температуры и её значение.
3. В 4-й вкладке уберите ненужные графики, цифры и полоски.
4. В 5-й – укажите цвета отображения данных, если стандартные не устраивают. В 6-й доступна функция записи показаний в текстовый файл.
5. Сохраняйте настройки и пользуйтесь.
Способов решения проблемы много: сторонние гаджеты и приложения. Причем все они имеют большой список параметров, доступных пользователю для изменения, и возможности для кастомизации.
How to Check the CPU Temperature in Windows 10

The temperature of your computer’s processor is pretty vital for keeping it healthy. After all, being the hotspot of calculations within your computer, it’s a good idea to keep it cool! Processors that get a little too hot can cause all kinds of issues with your computer. It may throttle itself to keep cool, which will mean less processing power overall. In dire situations, it will cause the computer to BSOD, freeze, or even shut down or restart itself.
As such, it’s a good idea to check on the CPU temperatures every so often. This is especially true if you put your laptop in situations where it may overheat, such as on your blanket or duvet, as you use the laptop in bed. In this article we explore the different ways you can check CPU temperature in Windows 10.
But First – What’s a “Bad Temperature”?
Unfortunately, it’s not immediately obvious what a good or bad temperature for a processor is. If you looked up your processor’s idle temperature and saw it was at 30°C, is that a good or bad idle temperature? What about 40°, 50°, 60°, or 70°C?
If you want to know what your processor’s max temperature is, search the Web for the product page of your specific CPU, then find where it lists the max ideal temperature for your processor.

If the temperature is listed under something similar to “Maximum Operating Temperature” or “T Case,” then that’s the temperature which you should strive to keep your processor under most of the time. If it says “T Junction” (like above), the general advice is to keep things at least 30°C under this stated temperature. (For the above example we’ll be striving to stay under 70°C.) Either way, if your PC is under this temperature for most (or, ideally, all!) of the time, you’re doing fine.
Now that we know what the temperature limit is, it’s time to explore how to check CPU temperature in Windows 10. This requires the aid of third-party programs which will help keep tabs on how hot the processor is getting.
HWMonitor
This tool does a whole lot more than just monitor CPU temperatures, but on one single screen, you’ll find all the information you need and much more. In the main HWMonitor pane, you can scroll down to see your CPU listed with all its information.

You’ll see the voltage of each core, the amount of CPU being utilized and – most importantly – the temperature of each core. It displays the current temperature, as well as the minimum and maximum temperatures.
There’s not a ton to dig into here because everything is displayed on that one screen. You can switch on a dark mode for those nocturnal monitoring sessions, switch on a status bar, and quickly save a log of your monitoring data with the Ctrl + S shortcut.
MSI Afterburner
Designed with gamers in mind, and for those who want to overclock their PCs, MSI Afterburner doubles as an excellent tool to monitor your PC temperatures. Once you’ve installed and opened Afterburner, you should see a graph on its home screen showing you your GPU temperature, CPU temperature, and various other data.

To reorder the graphs and prioritize CPU temperature so it appears near the top, click “Settings” in Afterburner, then the Monitoring tab. Here you’ll see a menu where you can tick which things you want displayed on the home screen and drag to the top the things you want to appear near the top. Just drag “CPU1 temperature,” “CPU2 temperature,” and all the other CPU temperatures near the top of the graph, and click OK. They’ll appear on the home screen in the order you chose.

When you select “CPU” temperature, you can also tick the “Show in On-Screen Display” box so that it appears in the corner whenever you enter the shortcut for bringing up the OSD. (You can choose what key you want this to be by going to the “On-Screen Display” tab in Afterburner’s settings.)
Open Hardware Monitor
Open Hardware Monitor is a nice solution for getting all your needed statistics in one place. This will be able to tell you what your CPU’s temperatures are as well as your GPU’s temperature, the voltages being used in your computer, and even how fast your system fans are going. This makes it a robust tool that allows you to keep an eye on all your system temperatures.

You can find your CPU’s temperature under the category with your CPU’s name in it. It will list a temperature for each core your processor has.

Many of these temperature monitors allow you to put readings on your taskbar. This is particularly useful if you’re doing system-intensive tasks and want to keep an eye on your temperatures without darting back and forth between the active window and the system monitor. If you’d like to see the CPU temperature in the taskbar, right-click the temperature itself and click “Show in Tray.”

If the reading ends up hiding in the “additional” icons section, you can drag it onto the main active tray. This means it’ll always be visible as long as you can see the taskbar.

Core Temp

If you’d like something a little more focused on the processor itself, Core Temp is a good choice when you need to check CPU temperature in Windows 10. It gives you everything you may want to know about your processor, such as its name, the cores it uses, and – most importantly – its temperature. It will even inform you of your processor’s T Junction limit, listed as “Tj. Max” above your temperatures.

If you’d like to see the temperature in the system tray, it should be enabled by default. If it’s not, click “Options,” then “Settings.”

Click the “Windows Taskbar” tab, then “Enable Windows 7 Taskbar features,” followed by “Temperature,” then “OK.”

Speccy
Another all-in-one suite, Speccy, comes as a nice package of various systems diagnostics, including the ability to check CPU temperature in Windows 10. As soon as you open Speccy, you’re shown all the relevant temperatures you need to know for a healthy laptop. It’s also great for digging up information on your system, so make sure you remember this application should you need information about your operating system or motherboard, for instance.

If you click on “CPU” on the left, you can get more focused information on your processor.

If you’d like the temperature to appear in the tray, click “View,” then “Options.”

Click “System tray,” then “Minimize to tray,” followed by “Display metrics in tray,” then select “CPU.”

Now when you minimize Speccy, you can keep tabs on how hot your CPU is running as you do other things.
Help! My Processor Is Too Hot!
If the above methods lead you to discover that you have quite a toasty processor, don’t panic. There are many solutions you can use to bring your processor down to a more reasonable level. We published an article about how to cool down an overheating laptop, so see if the solutions there will help bring your CPU down to a more manageable heat.
Checking the Heat
Being a vital part of your laptop, an overheating processor is a cause for concern. With third party apps, however, you can easily check CPU temperature in Windows 10 and ensure your processor is working as cool as it should.
Want to do more laptop maintenance? Then read our guides on how to fix a misbehaving laptop touchpad, as well as a laptop keyboard.


