- How to capture WiFi traffic using Wireshark on Windows
- Winpcap Capture Limitations and WiFi traffic on Wireshark
- Acrylic Wi-Fi Sniffer
- Acrylic Wi-Fi Sniffer and WiFi interfaces in Wireshark
- WiFi traffic capturing using Wireshark
- Video tutorial Acrylic Wi-Fi with Wireshark on Windows
- Захват и анализ сетевого трафика в Windows Server 2008 R2 /2012
- Capture Network Traffic with netsh trace command
How to capture WiFi traffic using Wireshark on Windows
Wireshark uses libpcap or Winpcap libraries to capture network traffic on Windows. Winpcap libraries are not intended to work with WiFi network cards, therefore they do not support WiFi network traffic capturing using Wireshark on Windows. Monitor mode for Windows using Wireshark is not supported by default.
Winpcap Capture Limitations and WiFi traffic on Wireshark
Capture is mostly limited by Winpcap and not by Wireshark. However, Wireshark includes Airpcap support, a special -and costly- set of WiFi hardware that supports WiFi traffic monitoring in monitor mode. In other words, it allows capturing WiFi network traffic in promiscuous mode on a WiFi network. However these cards have been discontinued and are deprecated, so they cannot capture traffic on networks running the latest WiFi standards (802.11ac).
Acrylic Wi-Fi Sniffer is an innovative alternative for capturing Wi-Fi traffic in monitor mode from Windows, including the latest 802.11ac standard.
Acrylic Wi-Fi Sniffer
Acrylic Wi-Fi Sniffer also enables Wi-Fi packet capture in monitor mode with Wireshark on Windows (in the latest versions Wireshark 3.0.0 or higher) and with other Acrylic Wi-Fi products such as Heatmaps or Professional. Because it has been designed as an economical and easily configurable alternative to AirPCAP hardware, it can capture all data available with this type of card, including SNR values, and is compatible with the latest 802.11ac standard in all channel widths (20, 40, 80 and 160 MHz).
If you want to know more about capture modes or discover the features that these two alternatives provide within Acrylic Wi-Fi products, please visit “Monitor mode and native capture mode in Acrylic Wi-Fi” article.
Acrylic Wi-Fi Sniffer and WiFi interfaces in Wireshark
This integration is much easier than the previous one. Just install Acrylic Wi-Fi Sniffer and in the control panel of the sniffer click on the button “Install integration” as shown in the image below
Once done, start Wireshark as administrator and all Acrylic Wi-Fi Sniffer available interfaces will be displayed.
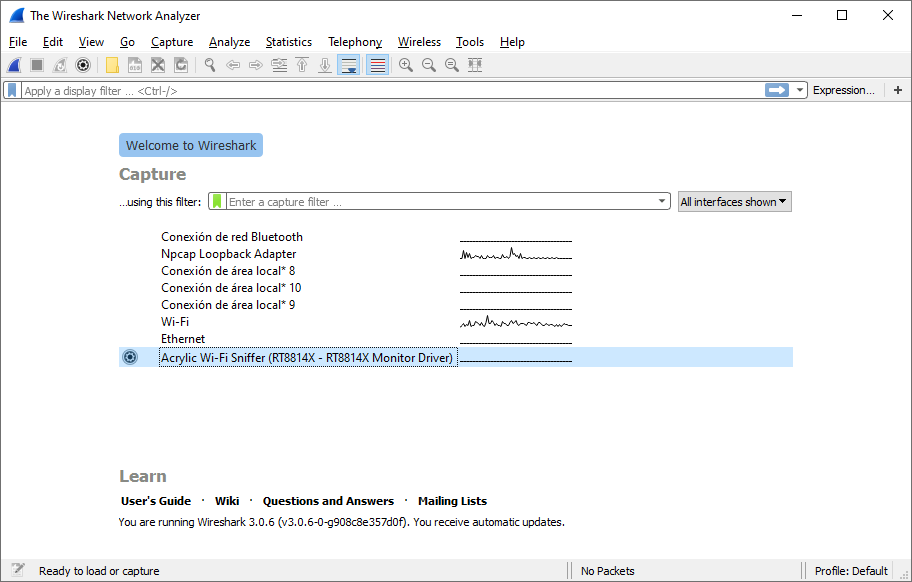
Select an interface to use with Acrylic Wi-Fi Sniffer and click on the configuration wheel as seen in the previous screenshot and configure both channels and bandwidth where the capture will be carried out.
Once configured, we can start the capture in Wireshark and start receiving packets.
We have added a toolbar in WireShark that allows to quickly change the configuration on-the-go as shown in the image below
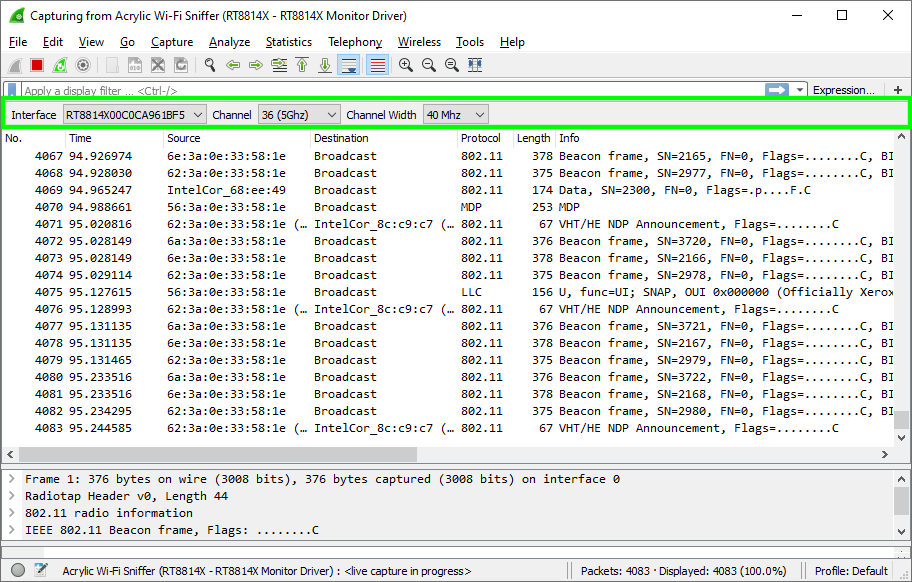
In order to activate it please go to “View” menu > “Interface toolbars” > “Acrylic Wi-Fi Sniffer interface integration”.
WiFi traffic capturing using Wireshark

In short, after installing Acrylic Wi-Fi Sniffer we start Wireshark as Administrator (right-click on Wireshark icon and select “Run as Administrator”) and select any Wi-Fi card that appears with the name NDIS network interface or Acrylic Wi-Fi Sniffer. In our case “Dell Wireless 1702/b/g/n WiFi Card” (integrated into Dell equipment) and the “RT8814X” (via Acrylic Wi-Fi Sniffer)
Video tutorial Acrylic Wi-Fi with Wireshark on Windows
You can download Acrylic Wi-Fi Sniffer which also allows integration with Wireshark during the evaluation period.
Capture WiFi traffic with Wireshark and Acrylic Wi-Fi Sniffer
Analyze WiFi packets with Wireshark in Windows with Acrylic Wi-Fi Sniffer
We appreciate your comments, please share this article on your social networks with the buttons below. Don’t forget to check our hardware compatibility list for better performance.
Захват и анализ сетевого трафика в Windows Server 2008 R2 /2012
 В системах Windows для захвата и последующего анализа сетевого трафика многие из нас пользуются такими известными инструментами как Network Monitor или Wireshark. Захват трафика через эти инструменты в наблюдаемой системе предполагает установку дополнительных компонент, выстраивающихся в функции сетевого обмена. Начиная с Windows 7 / Windows Server 2008 R2 у нас появилась возможность выполнять захват трафика встроенными в систему средствами, то есть мы можем выполнить захват трафика на интересующей нас системе не выполняя непосредственную установку дополнительных программных средств, а полученный в результате захвата файл сетевого дампа в дальнейшем анализировать на той системе где установлены соответствующие средства анализа, например на рабочей станции администратора с установленным Network Monitor.
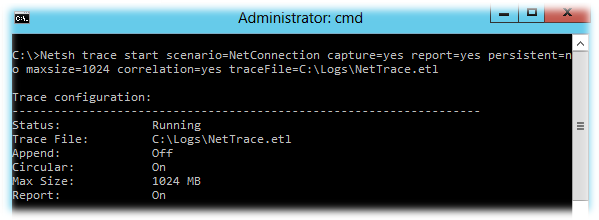
Для того, чтобы активировать захват сетевого трафика проходящего через все сетевые интерфейсы на интересующей нас системе выполним команду с правами Администратора:
При этом каталог, который мы указываем в качестве сохранения файла захвата должен существовать в файловой системе, иначе мы получим ошибку ‘ The system cannot find the path specified ‘ .
Если обследуемая система имеет несколько сетевых интерфейсов и нас интересует трафик только на определённом интерфейсе, то синтаксис команды будет выглядеть примерно так:
Захват трафика запущен и после того, как мы выполнили необходимые манипуляции, например воспроизвели изучаемую проблему из-за которой мы и решили анализировать трафик, останавливаем захват трафика командой:
В результате будет сгенерирован ETL файл а также CAB архив содержащий дополнительные данные, которые могут потребоваться для анализа сетевых проблем. 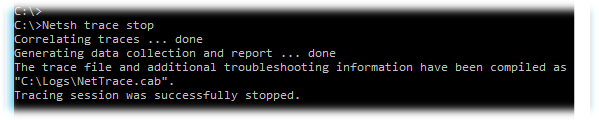
Полученный ETL файл копируем на рабочую станцию Администратора, запускаем Network Monitor и открываем файл из меню File > Open > Capture
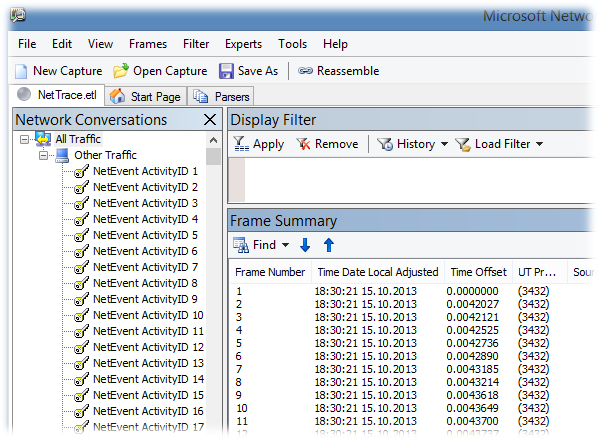
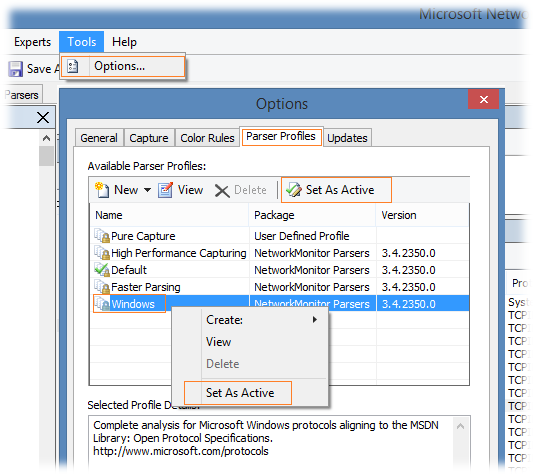
Загруженные данные будут разложены на фреймы с малопонятной структурой, да ещё и с предупреждением в описании практически каждого фрейма типа ‘Windows stub parser: Requires full Common parsers. See the «How Do I Change Parser Set Options(Version 3.3 or before) or Configure Parser Profile (Version 3.4)» help topic for tips on loading these parser sets ‘. Для того чтобы получить более или менее читаемый вид, нужно применить так называемый Parser Profile. Через меню Tools > Options откроем свойства Parser Profiles и назначим в качестве активного профиля – Windows
После этого данные трассировки будут перечитаны и представлены в более удобоваримой форме и теперь можно «забуриваться» в анализ…
Capture Network Traffic with netsh trace command
A very useful netsh capture command when you are not able to install Wireshark or Micorosft Network Monitor app inside a server. Windows has a built in command that allows you to capture network traffic.
To start capturing (Run command prompt as Administrator)
Run the examples below to start the capture
To stop the capture: netsh trace stop
To show current status: netsh trace show status
Shows capture options: netsh trace show capturefilterHelp
EXAMPLES:
Capture all network traffic and stop when capture grows to 500MB
netsh trace start capture=yes tracefile=c:\temp\trace.etl fileMode=single maxSize=500
Capture all network traffic between local server and the destination =x.x.x.x or =(192.168.1.7,192.168.1.9) or =!(192.168.1.10)
netsh trace start capture=yes Ethernet.Type=IPv4 IPv4.Address=x.x.x.x tracefile=c:\temp\trace.etl
Capture only UDP traffic (Default capture size is 250MB if not specified)
netsh trace start capture=yes protocol=17 tracefile=c:\temp\trace.etl
Capture only UDP traffic between local server and the destintion x.x.x.x
netsh trace start capture=yes Ethernet.Type=IPv4 IPv4.Address=x.x.x.x protocol=17 tracefile=c:\temp\trace.etl
Capture all network traffic on a specific Network Interface
netsh trace start capture=yes tracefile=c:\temp\trace.etl CaptureInterface=”Local Area Connection”
Capture all ICMP traffic until the file reaches 500MB
netsh trace start capture=yes protocol=1 tracefile=c:\temp\trace.etl fileMode=single maxSize=500
Generated Files:
mytrace.cab Open > mytrace.etl
3. The capture will look all broken up, you need to activate a proper Windows Parser to make it readable.
4. Click on Tools > Options > Parser Profiles > Select “Windows Parser” and set it as Active (top right corner)
5. Now the capture will be in the proper format
Opening the capture in Wireshark
1. By default the capture has .etl format, wireshark will not be able to read it.
2. You need to open the .etl file in Microsoft Message Analyzer and Save as .cap format
3. Now you can open it up in wireshark
Common Protocols (Link to Source)
1 – ipv4-ICMP
4 – Ipv4
6 – TCP
17 – UDP
41 – Ipv6
58 – Ipv6-ICMP
Options
capture=yes|no
Specifies whether packet capture is enabled in addition to trace events.
If unspecified, the default entry for capture is no.
traceFile=path\filename
Specifies the location to save the output file.
If unspecified, the default value is: “traceFile=%LOCALAPPDATA%\Temp\NetTraces\NetTrace.etl”
persistent=yes|no
Specifies whether the tracing session resumes upon restarting the computer, and continues to function until the “Netsh trace stop” command is issued. If unspecified, the default entry for persistent is no.
fileMode= single|circular|append
Specifies which file mode is applied when tracing output is generated.
If unspecified, the default entry “fileMode=circular” is used.
maxSize
If the maxSize parameter is unspecified, the default value of 250 MB is used.
If the value is set to 0, then there is no maximum.
To specify the maxSize=0, you must also specify filemode=single. By default, filemode=circular.
overwrite=yes|no
Specifies whether an existing trace output file – in either the specified or default location – will be overwritten. If parameter traceFile is not specified, then the default location and filename is applied, and any pre-existing version of the trace file is automatically overwritten. See parameter traceFile for default path and filename details.
Capture Filters:
Capture filters are only supported when capture is explicitly
enabled with capture=yes. Supported capture filters are:
CaptureInterface=
Enables packet capture for the specified interface name or GUID. Use
‘netsh trace show interfaces’ to list available interfaces.
e.g. CaptureInterface=<716a7812-4aee-4545-9d00-c10efd223551>
e.g. CaptureInterface=!<716a7812-4aee-4545-9d00-c10efd223551>
e.g. CaptureInterface=”Local Area Connection”
Ethernet.Address=
Matches the specified filter against both source and destination
MAC addresses.
e.g. Ethernet.Address=00-0D-56-1F-73-64
Ethernet.SourceAddress=
Matches the specified filter against source MAC addresses.
e.g. Ethernet.SourceAddress=00-0D-56-1F-73-64
Ethernet.DestinationAddress=
Matches the specified filter against destination MAC addresses.
e.g. Ethernet.DestinationAddress=00-0D-56-1F-73-64
Ethernet.Type=
Matches the specified filter against the MAC ethertype.
e.g. Ethernet.Type=IPv4
e.g. Ethernet.Type=NOT(0x86DD)
e.g. Ethernet.Type=(IPv4,IPv6)
Wifi.Type=
Matches the specified filter against the Wifi type. Allowed values
are ‘Management’ and ‘Data’. If not specified, the Wifi.Type filter
is not applied.
Note: This capture filter does not support ranges, lists or negation.
e.g. Wifi.Type=Management
Matches the specified filter against the IP protocol.
e.g. Protocol=6
e.g. Protocol=!(TCP,UDP)
e.g. Protocol=(4-10)
IPv4.Address=
Matches the specified filter against both source and destination
IPv4 addresses.
e.g. IPv4.Address=157.59.136.1
e.g. IPv4.Address=!(157.59.136.1)
e.g. IPv4.Address=(157.59.136.1,157.59.136.11)
IPv4.SourceAddress=
Matches the specified filter against source IPv4 addresses.
e.g. IPv4.SourceAddress=157.59.136.1
IPv4.DestinationAddress=
Matches the specified filter against destination IPv4 addresses.
e.g. IPv4.DestinationAddress=157.59.136.1
IPv6.Address=
Matches the specified filter against both source and destination
IPv6 addresses.
e.g. IPv6.Address=fe80::5038:3c4:35de:f4c3\%8
e.g. IPv6.Address=!(fe80::5038:3c4:35de:f4c3\%8)
IPv6.SourceAddress=
Matches the specified filter against source IPv6 addresses.
e.g. IPv6.SourceAddress=fe80::5038:3c4:35de:f4c3\%8
IPv6.DestinationAddress=
Matches the specified filter against destination IPv6 addresses.
e.g. IPv6.DestinationAddress=fe80::5038:3c4:35de:f4c3\%8
CustomMac=
Matches the specified filter against the value at the specified
offset starting with the MAC header.
Note: This capture filter does not support ranges, lists or negation.
e.g. CustomMac=UINT8(0x1,0x23)
e.g. CustomMac=ASCIISTRING(3,test)
e.g. CustomMac=UNICODESTRING(2,test)
CustomIp=
Matches the specified filter against the value at the specified
offset starting with the IP header.
Note: This capture filter does not support ranges, lists or negation.
e.g. CustomIp=UINT16(4,0×3201)
e.g. CustomIp=UINT32(0x2,18932)
CaptureMultiLayer=
Enables multi-layer packet capture.
Note: This capture filter does not support ranges, lists or negation.


