- Анализ аварийных дампов Windows
- Содержание
- Анализ аварийного дампа утилитой BlueScreenView
- Анализ аварийного дампа отладчиком WinDbg
- Установка Debugging Tools for Windows (WinDbg)
- Настройка отладочных символов
- Анализ аварийного дампа
- Получение информации о проблемном драйвере
- Аппаратные причины возникновения критических ошибок
- Диагностика неисправностей диска
- Диагностика неисправностей памяти
- Настройка параметров сохранения аварийного дампа
- Crash dump- collecting data message
- Синий экран с сообщением «Collecting data for crash dump»
- Решение
Анализ аварийных дампов Windows
В случае критической ошибки система останавливает свою работу, отображает синий экран смерти (BSOD), информация об ошибке и содержимое памяти сохраняется в файле подкачки. При последующей загрузке системы, на основе сохраненных данных, создается аварийный дамп c отладочной информацией. В системном журнале событий создается запись о критической ошибке.
Если критическая ошибка возникла на ранней стадии загрузки системы или в результате ошибки произошел отказ дисковой подсистемы, аварийный дамп сохранен не будет.
Аварийный дамп может быть проанализирован с помощью утилиты BlueScreenView или системного отладчика WinDbg (Debugging Tools for Windows).
Содержание
Анализ аварийного дампа утилитой BlueScreenView
Простейшим инструментом для анализа аварийных дампов является утилита BlueScreenView от NirSoft.
BlueScreenView сканирует папку с минидампами и отображает информацию по найденным отказам.
По каждому отказу отображается дата, данные об ошибке и драйвер, который предположительно вызвал отказ.
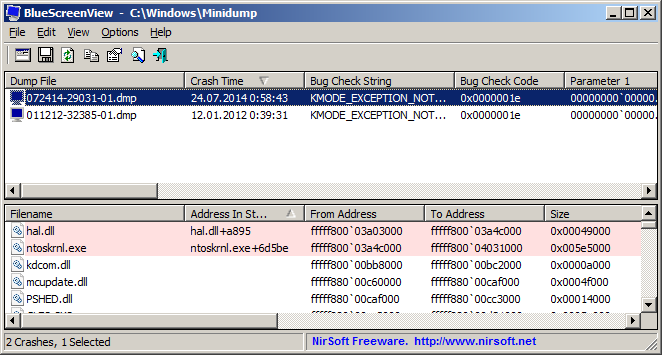
В нижней части окна отображается список загруженных в системе драйверов. Модули, к которым выполнялось обращение в момент отказа, выделены цветом, на них следует обратить особое внимание, они могут быть причиной отказа.
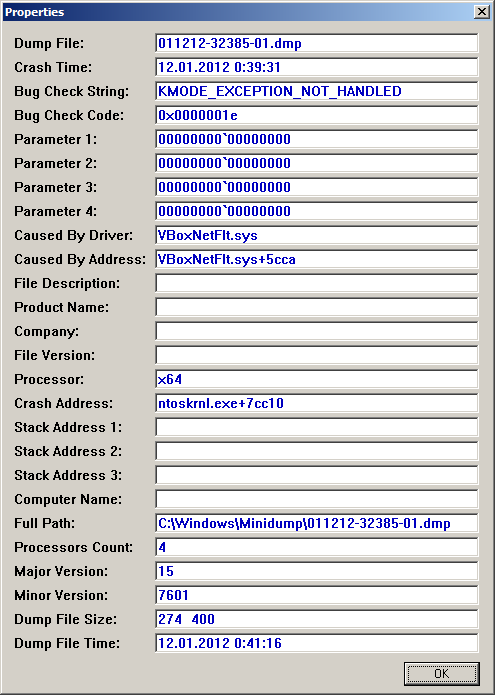
По двойному клику отображается дополнительная информация.
Анализ аварийного дампа отладчиком WinDbg
С помощью WinDbg из аварийного дампа можно вытащить более детальную информацию, включая расшифровку стека.
Установка Debugging Tools for Windows (WinDbg)
Microsoft распространяет WinDbg только в составе SDK, загрузить веб-установщик можно на странице загрузки.
Для анализа аварийных дампов установка SDK не требуется. Скачать Debugging Tools for Windows (WinDbg) отдельным пакетом можно здесь.
После установки, корректируем ярлык для запуска WinDbg. В свойствах ярлыка, устанавливаем флажок запуска от имени администратора. Также, в качестве рабочей папки, задаем: %SystemRoot%\Minidump.
Настройка отладочных символов
Отладочные символы содержат символические имена функций из исходного кода. Они необходимы для расшифровки и интерпретации аварийного дампа.
При первом запуске WinDbg, необходимо указать путь к отладочным символам, для этого открываем меню File, Symbol File Path, или используем комбинацию Ctrl+S.
Следующей строкой включаем загрузку отладочных символов из сети, задаем локальный путь для сохранения файлов и адрес для загрузки из интернета:
Анализ аварийного дампа
В меню выбираем File, Open Crash Dump, или нажимаем Ctrl+D.
Указываем путь к дампу %SystemRoot%\MEMORY.DMP или %SystemRoot%\Minidump\файл.dmp.
Загрузка отладочных символов из интернета может занять некоторое время.
Для получения детальной информации выполняем команду:
Дебаггер сам вам предложит ее выполнить, достаточно навести указатель мыши на ссылку и кликнуть.
В результате получаем следующий вывод:
Получение информации о проблемном драйвере
Если удалось обнаружить драйвер, в котором возникла ошибка, имя драйвера будет отображено в полях MODULE_NAME и IMAGE_NAME.
Чтобы получить путь к файлу и прочую информацию, щелкаем по ссылке на модуль:
Если полный путь к драйверу не указан, по умолчанию используется папка %SystemRoot%\system32\drivers.
Находим указанный файл, и изучаем его свойства.
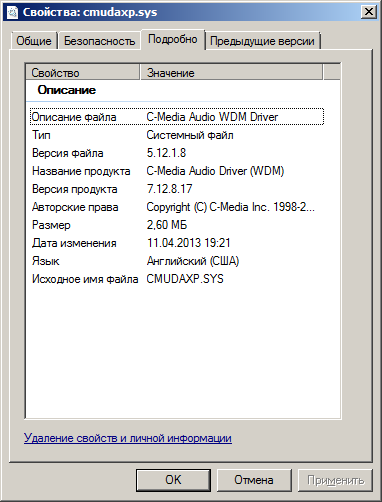
Обновляем проблемный драйвер.
Аппаратные причины возникновения критических ошибок
Источником критических ошибок нередко бывают неисправности в дисковой подсистеме, или в подсистеме памяти.
Диагностика неисправностей диска
В случае ошибок дисковой подсистемы, аварийный дамп может не сохраняться.
Чтобы исключить проблемы с диском, проверяем системный журнал событий на наличие ошибок чтения и записи на диск.
Проверяем параметры S.M.A.R.T жесткого диска, получить их можно, например, с помощью программы SpeedFan.
Особое внимание обращаем на параметры: «Current Pending Sector Count» и «Uncorrectable Sector Count», ненулевые значения этих параметров сигнализируют о неисправности диска.
Ненулевое значение параметра: «UltraDMA CRC Error Count», сигнализирует о проблеме с SATA-кабелем.
Подробнее о параметрах S.M.A.R.T. читаем в статье Википедии.
Диагностика неисправностей памяти
Проблемы с памятью нередко могут стать причиной самых разнообразных глюков, включая различные синие экраны, зависания, аварийное завершение программ, повреждение реестра, повреждение файловой системы и данных.
Выявить проблемы с памятью можно с помощью утилиты Memtest86+.
Загружаем образ по ссылке, записываем на диск, загружаемся с диска, запускается тест.
Начиная с Windows Vista, в системе имеется свой тест памяти. Для его запуска нажимаем «Пуск», в строке поиска набираем «памяти«, выбираем «Средство диагностики памяти Windows».
Проблемы с памятью в некоторых случаях могут быть устранены обновлением BIOS.
Настройка параметров сохранения аварийного дампа
Для изменения параметров сохранения аварийного дампа нажимаем кнопку «Пуск», щелкаем на «Компьютер» правой кнопкой мыши, в контекстном меню выбираем «Свойства». В окне «Система» слева выбираем «Дополнительные параметры системы», в группе «Загрузка и восстановление» нажимаем кнопку «Параметры».
Crash dump- collecting data message
My computer keeps shutting down and freezing up. When I click check why Windows shut down it says:
Problem Event Name-blue screen
OS version 6.060000.2.0.0.768.3
Locale ID 1033
Additional info about prob.
BC code 77
BCPI 00000001
I’ve also seen the message — Crash dump-collecting data
I’ve also seen a black screen
It says-One of your disks needs to be checked for consistency. It goes through 3 stages, then restarts
You can read the minidump files yourself with the FREE utility from Nirsoft below.
The main likely causes for this error are hard drive issues, memory and/or malware infections
though there are others. Read through the troubleshooter here and look in the Event Viewer,
check the 2nd parameter of the BBCode with the BlueScreenView utility and when you get to
the various suggested repair methods check the next message for more details for each.
Remember to report back here the info from Event Viewer and the BlueScreenViewer.
BCCode: 77 0x00000077
Cause
If the first parameter is 0 or 1, the stack signature in the kernel stack was not found. This error is probably caused by defective hardware, such as a RAM error. Your parameter is 1.
If the first parameter is 2, the driver stack returned an inconsistent status for the read of the page. For example, the driver stack returned a success status even though it did not read the whole page.
If the first parameter is any value other than 0, 1, or 2, the value of the first parameter is an NTSTATUS error code that the driver stack returns after it tries to retrieve the page of kernel data. You can determine the exact cause of this error from the I/O status code (the second parameter). Some common status codes include the following:
- 0xC000009A, or STATUS_INSUFFICIENT_RESOURCES, indicates a lack of nonpaged pool resources. This status code indicates a driver error in the storage stack. (The storage stack should always be able to retrieve this data, regardless of software resource availability.)
- 0xC000009C, or STATUS_DEVICE_DATA_ERROR, indicates bad blocks (sectors) on the hard disk.
- 0xC000009D, or STATUS_DEVICE_NOT_CONNECTED, indicates defective or loose cabling, termination, or that the controller does not see the hard disk drive.
- 0xC000016A, or STATUS_DISK_OPERATION_FAILED, indicates bad blocks (sectors) on the hard disk.
- 0xC0000185, or STATUS_IO_DEVICE_ERROR, indicates improper termination or defective cabling on SCSI devices or that two devices are trying to use the same IRQ.
These status codes are the most common ones that have specific causes. For more information about other possible status codes that might be returned, see the Ntstatus.h file in the Microsoft Windows Driver Kit (WDK).
A virus infection can also cause this bug check.
Resolving the Problem
Resolving a bad block problem: If you can restart the computer after the error, Autochk runs automatically and attempts to map the bad sector to prevent it from being used anymore.
If Autochk does not scan the hard disk for errors, you can manually start the disk scanner. Run Chkdsk /f /r on the system partition. You must restart the computer before the disk scan begins. If you cannot start the system because the error, use the Recovery Console and run Chkdsk /r.
Warning If your system partition is formatted with the FAT file system, the long file names that the Windows operating system uses might be damaged if you use Scandisk or another MS-DOS-based hard disk tool to verify the integrity of your hard disk drive from MS-DOS. Always use the version of Chkdsk that matches your version of the Windows operating system.
Resolving a defective hardware problem: If the I/O status is 0xC0000185 and the paging file is on an SCSI disk, check the disk cabling and SCSI termination for problems.
Resolving a failing RAM problem: Run the hardware diagnostics that the system manufacturer supplies, especially the memory scanner. For more information about these procedures, see the owner’s manual for your computer.
Check that all the adapter cards in the computer are properly seated. Use an ink eraser or an electrical contact treatment, available at electronics supply stores, to ensure adapter card contacts are clean.
Check the System Log in Event Viewer for additional error messages that might help identify the device that is causing the error. You can also disable memory caching of the BIOS to try to resolve this error.
Make sure that the latest Windows Service Pack is installed.
If the preceding steps fail to resolve the error, take the system motherboard to a repair facility for diagnostic testing. A crack, a scratched trace, or a defective component on the motherboard can cause this error.
Resolving a virus infection: Check your computer for viruses by using any up-to-date, commercial virus scanning software that examines the Master Boot Record of the hard disk. All Windows file systems can be infected by viruses.
Look in the Event Viewer to see if anything is reported about those.
http://www.computerperformance.co.uk/vista/vista_event_viewer.htm
MyEventViewer — Free — a simple alternative to the standard event viewer of Windows.
TIP — Options — Advanced Filter allows you to see a time frame instead of the whole file.
http://www.nirsoft.net/utils/my_event_viewer.html
This is my generic troubleshooter and can probably give a little more specific help when you give the
BCC codes.
Here are some methods to possibly fix the blue screen issue. If you could give the Blue Screen info
that would help. Such as the BCC and the other 4 entries on the lower left. And any other error
information such as STOP codes and info such as IRQL_NOT_LESS_OR_EQUAL or PAGE_FAULT_IN_NONPAGED_AREA and similar messages.
BCCode: 116
BCP1: 87BC9510
BCP2: 8C013D80
BCP3: 00000000
BCP4: 00000002
or in this format :
Stop: 0x00000000 (oxoooooooo oxoooooooo oxooooooooo oxoooooooo)
tcpip.sys — Address 0x00000000 base at 0x000000000 DateStamp 0x000000000
This is an excellent tool for posting Blue Screen Error Information
BlueScreenView scans all your minidump files created during ‘blue screen of death’
crashes, and displays the information about all crashes in one table — Free
http://www.nirsoft.net/utils/blue_screen_view.html
Many BlueScreens are caused by old or corrupted drivers, especially video drivers however there
are other causes.
You can do these in Safe Mode if needed or from Command Prompt from Vista DVD or Recovery
Options if your system has that installed by the maker.
You can try a System Restore back to a point before the problem started if there is one.
Start — type this in Search Box -> COMMAND find at top and RIGHT CLICK — RUN AS ADMIN
Enter this at the prompt — sfc /scannow
How to analyze the log file entries that the Microsoft Windows Resource Checker (SFC.exe)
program generates in Windows Vista cbs.log
http://support.microsoft.com/kb/928228
The log might give you the answer if there was a corrupted driver. (Does not tell all the possible
driver issues).
Also run CheckDisk so we can rule out corruption as much as possible.
Often updating drivers will help, usually Video, Sound, Network Card (NIC), WiFi, 3rd party
keyboard and mouse, as well as other major device drivers.
Manually look at manufacturer’s sites for drivers — and Device Maker’s sites.
http://pcsupport.about.com/od/driverssupport/ht/driverdlmfgr.htm
How to fix BlueScreen (STOP) errors that cause Windows Vista to shut down or restart
unexpectedly
http://support.microsoft.com/kb/958233
Understanding and Decoding BSOD (blue screen of death) Messages
http://www.taranfx.com/blog/?p=692
Windows — Troubleshooting Blue Screen Errors
http://kb.wisc.edu/page.php?id=7033
In some cases this might be required.
StartUp Repair from Recovery Options or Vista disk
Синий экран с сообщением «Collecting data for crash dump»
Вложения
 | Minidump.rar (78.7 Кб, 11 просмотров) |
Периодически вылезает синий экран — collecting data for crash dump
Периодически вылезает синий экран — collecting data for crash dump Отчет AIDA64 можно.
Чёрный экран с сообщением «DISK BOOT FAILURE, INSERT SYSTEM DISK AND PRESS ENTER»
У меня такая проблема при включении винчестера к компу, запускаю процессор выходит черный экран в.
Синий экран смерти. Отсутствие драйвера «dam EhStorClass»
Добрый вечер! Проблема такова: при работе с ПК (не важно в игре или в браузере) встречается.
Win 10 — вылетает синий экран «Clock watchdog timeout»
В Win 10 вылетает синий экран «Clock watchdog timeout» при просмотре видеороликов в браузере.
Добавлено через 1 минуту
4 из 4-ёх 1000007e AMPPAL.sys
Вложения
| Report.rar (121.3 Кб, 8 просмотров) |
Решение
SP 1 установить
И драйверы надо брать не из драйверопаков, а с сайтов оборудования
от этого отталкивайтесь
Заказываю контрольные, курсовые, дипломные и любые другие студенческие работы здесь или здесь.
Синий экран смерти «Dumping physical memory to disk»
Примерно месяц назад на ноутбуке модели Dell inspirion N7110 стали появляться различные.
Синий экран » Смерти «,при завершении работы Windows 7
Добрый день всем.Заметил я такое два дня назад.Вроде в инете нашел что да как,но,ничего не.
FAQ по расшифровке BSOD (синий «экран смерти»)
Оглавление: 0x00000001: APC_INDEX_MISMATCH 0x0000000A: IRQL_NOT_LESS_OR_EQUAL .
 BSOD (синий «экран смерти») постоянные ошибки
Собрал компьютер, после установки операционки через 2 недели начинают выскакивать ошибки при.


