- Entering Debugger Commands in WinDbg
- Opening the Debugger Command Window
- Using the Debugger Command Window
- Getting Started with Windows Debugging
- 1. Determine the host and the target
- 2. Determine the type: kernel-mode or user-mode
- 3. Choose your debugger environment
- 4. Determine how to connect the target and host
- 5. Choose either the 32-bit or 64-bit debugging tools
- 6. Configure symbols
- 7. Configure source code
- 8. Become familiar with debugger operation
- 9. Become familiar with debugging techniques
- 10. Use the debugger reference commands
- 11. Use debugging extensions for specific technologies
- 12. Learn about related Windows internals
- 13. Review additional debugging resources
- KD Command-Line Options
- Parameters
Entering Debugger Commands in WinDbg
The Debugger Command window is the primary debugging information window in WinDbg. You can enter debugger commands and view the command output in this window.
NoteВ В This window displays «Command» in the title bar. However, this documentation always refers to this window as «the Debugger Command window» to avoid confusing it with the Command Prompt windows that are used to issue Microsoft MS-DOS commands.
Opening the Debugger Command Window
To open the Debugger Command window, choose Command from the View menu. (You can also press ALT+1 or select the Command button ( ) on the toolbar. ALT+SHIFT+1 closes the Debugger Command window.)
The following screen shot shows an example of a Debugger Command window.
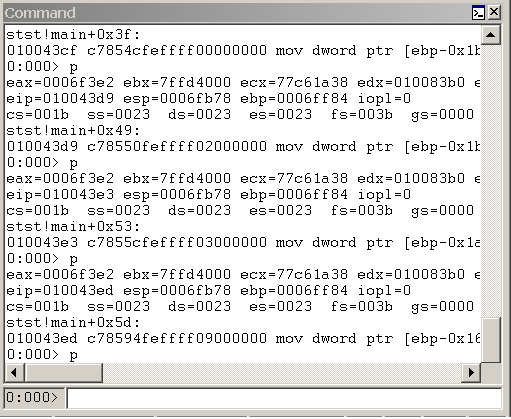
Using the Debugger Command Window
The Debugger Command window is split into two panes. You type commands in the smaller pane (the command entry pane) at the bottom of the window and view the output in the larger pane at the top of the window.
In the command entry pane, use the UP ARROW and DOWN ARROW keys to scroll through the command history. When a command appears, you can edit it or press ENTER to run the command.
The Debugger Command window contains a shortcut menu with additional commands. To access this menu, select and hold (or right-click) the title bar of the window or select the icon near the upper-right corner of the window (). The following list describes some of the menu commands:
Add to command output adds a comment to the command output, similar to the Edit | Add to Command Output command.
Clear command output deletes all of the text in the window.
Choose text color and recolor selection. opens a dialog box that enables you to choose the text color in which to display the text that is selected in the Debugger Command window.
Word wrap turns the word wrap status on and off. This command affects the whole window, not only commands that you use after this state is selected. Because many commands and extensions produce formatted displays, it is not recommended that you use word wrap.
Mark current location sets a marker at the current cursor location in the command window. The name of the mark is the contents of the line to the right of the cursor.
Go to mark causes the window to scroll so that the line that contains the chosen mark is positioned at the top of the window.
Always floating causes the window to remain undocked, even if it is dragged to a docking location.
Move with frame causes the window to move when the WinDbg frame is moved, even if the window is undocked. For more information about docked, tabbed, and floating windows, see Positioning the Windows.
Getting Started with Windows Debugging
This article covers how to get started with Windows Debugging. If your goal is to use the debugger to analyze a crash dump, see Analyze crash dump files by using WinDbg.
To get started with Windows Debugging, complete the tasks that are described in this article.
1. Determine the host and the target
The debugger runs on the host system, and the code that you want to debug runs on the target system.
Host Target

Because it is common to stop instruction execution on the processor during debugging, two computer systems are typically used. In some situations, you might be able to use a virtual machine as the second system. For example, you might be able to use a virtual PC that is running on the same PC as the code that you need to debug. However, if your code is communicating to low-level hardware, using a virtual PC may not be the best approach. For more information, see Setting up network debugging of a virtual machine — KDNET.
2. Determine the type: kernel-mode or user-mode
Next, you need to determine whether you will do kernel-mode or user-mode debugging.
Kernel mode is the processor-access mode in which the operating system and privileged programs run. Kernel-mode code has permission to access any part of the system, and it is not restricted like user-mode code. Kernel-mode code can gain access to any part of any other process running in either user mode or kernel mode. Much of the core OS functionality and many hardware device drivers run in kernel mode.
User mode is the mode that applications and subsystems on the computer run in. Processes that run in user mode do so within their own virtual address spaces. They are restricted from gaining direct access to many parts of the system, including system hardware, memory that was not allocated for their use, and other portions of the system that might compromise system integrity. Because processes that run in user mode are effectively isolated from the system and other user-mode processes, they cannot interfere with these resources.
If your goal is to debug a driver, determine if the driver is a kernel-mode driver or a user-mode driver. Windows Driver Model (WDM) drivers and Kernel-Mode Driver Framework (KMDF) are both kernel-mode drivers. As the name sugests, User-Mode Driver Framework (UMDF) drivers are user-mode drivers.
For some issues, it can be difficult to determine which mode the code executes in. In that case, you may need to pick one mode and look to see what information is available in that mode. Some issues require using the debugger in both user mode and kernel mode.
Depending on what mode you decide to debug in, you will need to configure and use the debuggers in different ways. Some debugging commands operate the same in both modes, and some commands operate differently in different modes.
For information about using the debugger in kernel mode, see the following articles:
For information about using the debugger in user mode, see Getting started with WinDbg (user-mode).
3. Choose your debugger environment
WinDbg works well in most situations, but there are times when you may want to use another debugger, such as console debuggers for automation or Visual Studio. For more information, see Debugging environments.
4. Determine how to connect the target and host
Typically, target and host systems are connected by an Ethernet network. If you are doing early bring-up work, or you don’t have an Ethernet connection on a device, other network connection options are available. For more information, see these articles:
5. Choose either the 32-bit or 64-bit debugging tools
Which debugging tools to choose—32-bit or 64-bit—depends on the version of Windows that is running on the target and host systems and on whether you are debugging 32-bit or 64-bit code. For more information, see Choosing the 32-Bit or 64-Bit debugging tools.
6. Configure symbols
To use all of the advanced functionality that WinDbg provides, you must load the proper symbols. If you do not have symbols properly configured, you will receive messages indicating that symbols are not available when you attempt to use functionality that is dependent on symbols. For more information, see Symbols for Windows debugging (WinDbg, KD, CDB, NTSD).
7. Configure source code
If your goal is to debug your own source code, you will need to configure a path to your source code. For more information, see Source path.
8. Become familiar with debugger operation
The Debugger operation section of this documentation describes debugger operation for various tasks. For example, Loading debugger extension DLLs explains how to load debugger extensions. To learn more about working with WinDbg, see Debugging using WinDbg.
9. Become familiar with debugging techniques
Standard debugging techniques apply to most debugging scenarios, and examples include setting breakpoints, inspecting the call stack, and finding a memory leak. Specialized debugging techniques apply to particular technologies or types of code. Examples include Plug and Play debugging, KMDF debugging, and RPC debugging.
10. Use the debugger reference commands
Over time, you will use different debugging commands as you work in the debugger. Use the .hh (open HTML help file) command in the debugger to display help information about any debugging command. For more information about the available commands, see Debugger reference.
11. Use debugging extensions for specific technologies
There are multiple debugging extensions that provide parsing of domain-specific data structures. For more information, see Specialized extensions.
12. Learn about related Windows internals
This documentation assumes a knowledge of Windows internals. To learn more about Windows internals (including memory usage, context, threads, and processes), review additional resources, such as Windows Internals by Mark Russinovich, David Solomon, and Alex Ionescu.
13. Review additional debugging resources
Additional resources include the following books and videos:
- Inside Windows Debugging: Practical Debugging and Tracing Strategies by Tarik Soulami
- Advanced Windows Debugging by Mario Hewardt and Daniel Pravat
- Defrag Tools, episodes 13 through 29, about WinDbg
KD Command-Line Options
First-time users of KD should begin with the Debugging Using KD and NTKD section.
The KD command line uses the following syntax.
Descriptions of the KD command-line options follow. Only the -remote and -server options are case-sensitive. The initial hyphen can be replaced with a forward-slash (/). Options which do not take any additional parameters can be concatenated — so kd -r -n -v can be written as kd -rnv.
If the -remote or -server option is used, it must appear before any other options on the command line.
Parameters
-server ServerTransport
Creates a debugging server that can be accessed by other debuggers. For an explanation of the possible ServerTransport, see Activating a Debugging Server. When this parameter is used, it must be the first parameters on the command line.
-remote ClientTransport
Creates a debugging client, and connects to a debugging server that is already running. For an explanation of the possible ClientTransport values, see Activating a Debugging Client. When this parameter is used, it must be the first parameters on the command line.
-a Extension
Sets the default extension DLL. The default is kdextx86.dll or kdexts.dll. There must be no space after the «a», and the .dll file name extension must not be included. For details, and other methods of setting this default, see Loading Debugger Extension DLLs.
-b
This option no longer supported.
-bonc
If this option is specified, the debugger will break into the target as soon as the session begins. This is especially useful when connecting to a debugging server that might not be currently broken into the target.
-cfr «filename«
Specifies the path and name of a script file. This script file is executed as soon as the debugger is started, and any time the target is restarted. If filename contains spaces it must be enclosed in quotation marks. If the path is omitted, the current directory is assumed. If the file does not exist, no error occurs. For details, see Using Script Files.
-clines lines
Sets the approximate number of commands in the command history which can be accessed during remote debugging. For details, and for other ways to change this number, see Using Debugger Commands.
-d
After a reboot, the debugger will break into the target computer as soon as a kernel module is loaded. (This break is earlier than the break from the -b option.) See Crashing and Rebooting the Target Computer for details and for other methods of changing this status.
-ee <masm|c++>
Sets the default expression evaluator. If masm is specified, MASM expression syntax will be used. If c++ is specified, C++ expression syntax will be used. If the -ee option is omitted, MASM expression syntax is used as the default. See Evaluating Expressions for details.
-failinc
Causes the debugger to ignore any questionable symbols. When debugging a user-mode or kernel-mode minidump file, this option will also prevent the debugger from loading any modules whose images can’t be mapped. For details and for other methods of controlling this, see SYMOPT_EXACT_SYMBOLS.
-i ImagePath
Specifies the location of the executables that generated the fault. If the path contains spaces, it should be enclosed in quotation marks.
-iu KeyString
Registers debugger remoting as an URL type so that users can auto-launch a debugger remote client with an URL. KeyString has the format remdbgeng://RemotingOption . RemotingOption is a string that defines the transport protocol as defined in the topic Activating a Debugging Client. If this action succeeds, no message is displayed; if it fails, an error message is displayed.
The -iu parameter must not be used with any other parameters. This command will not actually start KD.
-k ConnectType
Tells the debugger how to connect to the target. For details, see Debugging Using KD and NTKD.
-kl
Starts a kernel debugging session on the same machine as the debugger.
-kqm
Starts KD in quiet mode.
-kx ExdiOptions
Starts a kernel debugging session using an EXDI driver. EXDI drivers are not described in this documentation. If you have an EXDI interface to your hardware probe or hardware simulator, please contact Microsoft for debugging information.
-lines
Enables source line debugging. If this option is omitted, the .lines (Toggle Source Line Support) command will have to be used before source debugging will be allowed. For other methods of controlling this, see SYMOPT_LOAD_LINES.
-log<a|au|o|ou> LogFile
Begins logging information to a log file. If LogFile already exists, it will be overwritten if -logo is used, or output will be appended to the file if -loga is used. The -logau and -logou options operate similar to -loga and -logo respectively, except that the log file is a Unicode file. For more details, see Keeping a Log File in KD.
-m
Indicates that the serial port is connected to a modem. Instructs the debugger to watch for the carrier-detect signal.
-myob
If there is a version mismatch with dbghelp.dll, the debugger will continue to run. (Without the -myob switch, this is considered a fatal error.)
A secondary effect of this option is that the warning that normally appears when breaking into the target computer is suppressed.
-n
Noisy symbol load: Enables verbose output from symbol handler. For details and for other methods of controlling this, see SYMOPT_DEBUG.
-noio
Prevents the debugging server from being used for input or output. Input will only be accepted from the debugging client (plus any initial command or command script specified by the -c command-line option).
All output will be directed to the debugging client. For more details, see Activating a Debugging Server.
-noshell
Prohibits all .shell commands. This prohibition will last as long as the debugger is running, even if a new debugging session is begun. For details, and for other ways to disable shell commands, see Using Shell Commands.
-QR Server
Lists all debugging servers running on the specified network server. The double backslash (\\) preceding Server is optional. See Searching for Debugging Servers for details.
The -QR parameter must not be used with any other parameters. This command will not actually start KD.
-r
Displays registers.
-s
Disables lazy symbol loading. This will slow down process startup. For details and for other methods of controlling this, see SYMOPT_DEFERRED_LOADS.
-sdce
Causes the debugger to display File access error dialog boxes during symbol load. For details and for other methods of controlling this, see SYMOPT_FAIL_CRITICAL_ERRORS.
-secure
Activates Secure Mode.
-ses
Causes the debugger to perform a strict evaluation of all symbol files and ignore any questionable symbols. For details and for other methods of controlling this, see SYMOPT_EXACT_SYMBOLS.
-sflags 0xNumber
Sets all the symbol handler options at once. Number should be a hexadecimal number prefixed with 0x — a decimal without the 0x is permitted, but the symbol options are binary flags and therefore hexadecimal is recommended. This option should be used with care, since it will override all the symbol handler defaults. For details, see Setting Symbol Options.
-sicv
Causes the symbol handler to ignore the CV record. For details and for other methods of controlling this, see SYMOPT_IGNORE_CVREC.
-sins
Causes the debugger to ignore the symbol path and executable image path environment variables. For details, see SYMOPT_IGNORE_NT_SYMPATH.
-snc
Causes the debugger to turn off C++ translation. For details and for other methods of controlling this, see SYMOPT_NO_CPP.
-snul
Disables automatic symbol loading for unqualified names. For details and for other methods of controlling this, see SYMOPT_NO_UNQUALIFIED_LOADS.
-srcpath SourcePath
Specifies the source file search path. Separate multiple paths with a semicolon (;). If the path contains spaces, it should be enclosed in quotation marks. For details, and for other ways to change this path, see Source Path.
-sup
Causes the symbol handler to search the public symbol table during every symbol search. For details and for other methods of controlling this, see SYMOPT_AUTO_PUBLICS.
-t PrintErrorLevel
Specifies the error level that will cause the debugger to display an error message. This is a decimal number equal to 0, 1, 2, or 3. The values are described as follows:


