- Tools Included in Debugging Tools for Windows
- Installation Directory
- Using Debugger Commands
- Debugger Command Window Prompt
- Kinds of Commands
- Editing, Repeating, and Canceling Commands
- Expression Syntax
- Aliases
- Self-Repeating Commands
- Установка Debugging Tools for Windows
- Установка Debugging Tools for Windows при помощи web-инсталлятора
- Установка Debugging Tools for Windows с ISO-образа Windows SDK
- Установка Debugging Tools for Windows через .msi файл
- Дополнительные сведения
- Состав Debugging Tools for Windows
Tools Included in Debugging Tools for Windows
Debugging Tools for Windows includes several tools in addition to the debugging engine and the Debugging Environments. The tools are in the installation directory of Debugging Tools for Windows.
DumpChk
Validate a memory dump file.
GFlags
Control registry keys and other settings.
Kill
Terminate a process.
Logger and LogViewer
Record and display function calls and other actions of a program.
PLMDebug
Use the Windows debugger to debug Windows app, which run under Process Lifecycle Management (PLM). With PLMDebug, you can take manual control of suspending, resuming, and terminating a Windows app.
Remote Tool
Remotely control any console program, including KD, CDB, and NTSD. See Remote Debugging Through Remote.exe.
TList
List all running processes.
UMDH
Analyze heap allocations.
USBView
Display USB host controllers and connected devices.
DbgRpc (Dbgrpc.exe)
Display Microsoft Remote Procedure Call (RPC) state information. See RPC Debugging and Using the DbgRpc Tool.
KDbgCtrl (Kernel Debugging Control, Kdbgctrl.exe)
Control and configure the kernel debugging connection. See Using KDbgCtrl.
SrcSrv
A source server that can be used to deliver source files while debugging.
SymSrv
A symbol server that the debugger can use to connect to a symbol store.
SymProxy
Create a single HTTP symbol server on your network that all your debuggers can point to. This has the benefit of pointing to multiple symbol servers (both internal and external) with a single symbol path, handling all authentication, and increasing performance via symbol caching. Symproxy.dll is in the SymProxy folder in the installation directory.
SymChk
Compare executable files to symbol files to verify that the correct symbols are available.
AgeStore
Removes old entries in the downstream store of a symbol server or a source server.
DBH
Display information about the contents of a symbol file.
PDBCopy
Remove private symbol information from a symbol file, and control which public symbols are included in the file.
DbgSrv
A process server used for remote debugging. See Process Servers (User Mode).
KdSrv
A KD connection server used for remote debugging.See KD Connection Servers (Kernel Mode).
DbEngPrx
A repeater (small proxy server) used for remote debugging. See Repeaters.
Breakin (Breakin.exe)
Causes a user-mode break to occur in a process. For help, open a Command Prompt window, navigate to the installation directory, and enter breakin /?.
List (File List Utility) (List.exe)
For help, open a Command Prompt window, navigate to the installation directory, and enter list /?.
RTList (Remote Task List Viewer) (Rtlist.exe)
List running processes via a DbgSrv process server. For help, open a Command Prompt window, navigate to the installation directory, and enter rtlist /?.
Installation Directory
The default installation directory for 64 bit OS installs for the debugging tools is C:\Program Files (x86)\Windows Kits\10\Debuggers\. If you have a 32-bit OS, you can find the Windows Kits folder under C:\Program Files. To determine if you should use the 32 bit or 64 bit tools, see Choosing the 32-Bit or 64-Bit Debugging Tools.
Using Debugger Commands
For KD or CDB, «Debugger Command window» refers to the whole window. You enter commands at the prompt at the bottom of the window. If the commands have any output, the window displays the output and then displays the prompt again.
For Visual Studio, «Debugger Command window» refers to a window that is labeled «Debugger Immediate Window» in the title bar. This window has two panes:
In the small, bottom pane, you enter commands.
In the large, upper pane, you view command output.
For WinDbg, «Debugger Command window» refers to the window that is labeled «Command» in the title bar. This window contains two panes:
In the small, bottom pane, you enter commands.
In the large, upper pane, you view command output.
This window is always open at the beginning of a debugging session. You can reopen or switch to this window by selecting Command on the View menu, pressing ALT+1, or selecting the Command (Alt+1) button ( ) on the toolbar.
You can use the UP ARROW and DOWN ARROW keys to scroll through the command history. When a previous command appears, you can edit it and then press ENTER to execute the previous command (or the edited version of the previous command). The cursor does not have to be at the end of the line for this procedure to work correctly.
Debugger Command Window Prompt
When you are performing user-mode debugging, the prompt in the Debugger Command window looks like the following example.
In the preceding example, 2 is the current process number, and 005 is the current thread number.
If you attach the debugger to more than one computer, the system number is included before the process and thread number, as in the following example.
In this example, 3 is the current system number, 2 is the current process number, and 005 is the current thread number.
When you are performing kernel-mode debugging on a target computer that has only one processor, the prompt looks like the following example.
However, if the target computer has multiple processors, the number of the current processor appears before the prompt, as in the following example.
If the debugger is busy processing a previously issued command, new commands will temporarily not be processed, although they can be added to the command buffer. In addition, you can still use control keys in KD and CDB, and you can still use menu commands and shortcut keys in WinDbg. When KD or CDB is in this busy state, no prompt is displayed. When WinDbg is in this busy state, the following indicator will appear in place of the prompt:
You can use the .pcmd (Set Prompt Command) command to add text to this prompt.
Kinds of Commands
WinDbg, KD, and CDB support a variety of commands. Some commands are shared between the debuggers, and some are available only on one or two of the debuggers.
Some commands are available only in live debugging, and other commands are available only when you debug a dump file.
Some commands are available only during user-mode debugging, and other commands are available only during kernel-mode debugging.
Some commands are available only when the target is running on certain processors. For more information about all of the commands and their restrictions, see Debugger Commands.
Editing, Repeating, and Canceling Commands
You can use standard editing keys when you enter a command:
Use the UP ARROW and DOWN ARROW keys to find previous commands.
Edit the current command with the BACKSPACE, DELETE, INSERT, and LEFT ARROW and RIGHT ARROW keys.
Press the ESC key to clear the current line.
You can press the TAB key to automatically complete your text entry. In any of the debuggers, press the TAB key after you enter at least one character to automatically complete a command. Press the TAB key repeatedly to cycle through text completion options, and hold down the SHIFT key and press TAB to cycle backward. You can also use wildcard characters in the text and press TAB to expand to the full set of text completion options. For example, if you type fo*!ba and then press TAB, the debugger expands to the set of all symbols that start with «ba», in all modules with module names that start with «fo». As another example, you can complete all extension commands that have «prcb» in them by typing !*prcb and then pressing TAB.
When you use the TAB key to perform text completion, if your text fragment begins with a period (.), the text is matched to a dot command. If your text fragment begins with an exclamation point (!), the text is matched to an extension command. Otherwise, the text is matched with a symbol. When you usee the TAB key to enter symbols, pressing the TAB key completes code and type symbols and module names. If no module name is apparent, local symbols and module names are completed. If a module or module pattern is given, symbol completion completes code and type symbols from all matches.
You can select and hold (or right-click) in the Debugger Command window to automatically paste the contents of the clipboard into the command that you are typing.
The maximum command length is 4096 characters. However, if you are controlling the user-mode debugger from the kernel debugger, the maximum line length is 512 characters.
In CDB and KD, press the ENTER key by itself to repeat the previous command. In WinDbg, you can enable or disable this behavior. For more information about this behavior, see ENTER (Repeat Last Command).
If the last command that you issued presents a long display and you want to cut it off, use the CTRL+C key in CDB or KD. In WinDbg, use Debug | Break or press CTRL+BREAK.
In kernel-mode debugging, you can cancel commands from the keyboard of the target computer by pressing CTRL+C.
You can use the .cls (Clear Screen) command to clear all of the text from the Debugger Command window. This command clears the whole command history. In WinDbg, you can clear the command history by using the Edit | Clear Command Output command or by selecting Clear command output on the shortcut menu of the Debugger Command window.
Expression Syntax
Many commands and extension commands accept expressions as their arguments. The debugger evaluates these expressions before executing the command. For more information about expressions, see Evaluating Expressions.
Aliases
Aliases are text macros that you can use to avoid having to retype complex phrases. There are two kinds of aliases. For more information about aliases, see Using Aliases.
Self-Repeating Commands
You can use the following commands to repeat an action or conditionally execute other commands:
Установка Debugging Tools for Windows
Debugging Tools for Windows — Инструменты отладки кода операционных систем Windows. Представляют собой набор свободно распространяемых программ от Microsoft, предназначенных для отладки кода пользовательского режима и режима ядра: приложений, драйверов, служб, модулей ядра. В состав инструментария входят отладчики консольного и GUI- режимов, утилиты для работы с символами, файлами, процессами, утилиты для обеспечения удаленной отладки. Инструментарий содержит в себе утилиты, с помощью которых можно находить причины сбоев в различных компонентах системы. Debugging Tools for Windows с определенного момента недоступны для скачивания в форме автономного дистрибутива и входят в состав Windows SDK (Windows Software Development Kit). Набор инструментальных средств Windows SDK, в свою очередь, доступен в виде части программы подписки MSDN или же может быть свободно загружен в качестве отдельного дистрибутива с сайта msdn.microsoft.com. По заявлению разработчиков, последняя и самая актуальная версия Debugging Tools for Windows содержится именно в Windows SDK.
Debugging Tools for Windows обновляются и выкладываются в публичный доступ достаточно часто и процесс этот никак не зависит от выпуска операционных систем. Поэтому, периодически проверяйте наличие новых версий.
Давайте теперь посмотрим, что же, в частности, позволяют нам средства Debugging Tools for Microsoft Windows:
- Отлаживать локальные приложения, службы (сервисы), драйвера и ядро;
- Отлаживать по сети удаленные приложения, службы (сервисы), драйвера и ядро;
- Отлаживать работающие приложения в режиме реального времени;
- Анализировать файлы дампов памяти приложений, ядра и системы в целом;
- Работать с системами на базе архитектур x86/x64/Itanium;
- Отлаживать программы пользовательского режима и режима ядра;
Доступны следующие версии Debugging Tools for Windows: 32-bit x86, Intel Itanium, 64-bit x64. Нам потребуются две из них: x86 либо x64.
Доступны несколько способов установки Debugging Tools for Windows, в данной же статье мы будем рассматривать лишь основные из них:
- Установка посредством web-инсталлятора.
- Установка Debugging Tools for Windows с ISO-образа Windows SDK.
- Установка Debugging Tools for Windows непосредственно из пакетов dbg_amd64.msi / dbg_x86.msi .
Остается неясен еще во какой момент, зачем мне инсталлировать отладочный инструментарий на компьютер? Зачастую ведь сталкиваешься с ситуацией, когда вмешательство в рабочую среду крайне нежелательно! И уж тем более что инсталляция нового продукта, то есть внесение изменений в реестр/файлы системы, может быть совершенно недопустима. Примерами могут служить критически-важные сервера. Почему бы разработчикам не продумать вариант с портабельными (portable) версиями приложений, не требующих установки?
От версии к версии процесс установки пакета Debugging Tools for Windows претерпевает некоторые изменения. Давайте теперь перейдем непосредственно к процессу установки и рассмотрим способы, которыми можно установить инструментарий.
Установка Debugging Tools for Windows при помощи web-инсталлятора
Переходим на страницу Архив Windows SDK и находим раздел под названием Windows 10 и ниже пункт «Windows 10 SDK (10586) и эмулятор устройства с Windows 10 Mobile (Майкрософт) (версия 10586.11)».

Щелкаем по пункту УСТАНОВИТЬ ПАКЕТ SDK . После щелчка скачиваем и запускаем файл sdksetup.exe , который и инициирует процесс онлайн-установки Windows SDK. На начальном этапе инсталятор проверит наличие в системе установленного пакета .NET Framework последней версии (в данный момент это 4.5). Если пакет отсутствует, что будет предложена установка и по окончании выполнена перезагрузка станции. Сразу после перезагрузки, на этапе авторизации пользователя, стартует процесс инсталляции уже непосредственно Windows SDK.
Зачастую, при выборе всех без исключения компонентов пакета, в процессе установки могут возникнуть ошибки. В этом случае рекомендуется устанавливать компоненты выборочно, минимально необходимый набор.
После завершения инсталляции Debugging Tools for Windows расположение файлов отладки при данном методе инсталляции у нас будет следующим:
- 64-битные версии: C:\Program Files (x86)\Windows Kits\x.x\Debuggers\x64
- 32-битные версии: C:\Program Files (x86)\Windows Kits\x.x\Debuggers\x86
* где x.x — определенная версия комплекта разработки;
Заметили, что версии 8 и выше, пути инсталляции заметно отличаются от классических для всех предыдущих версий средств отладки?
Огромным плюсом данного способа установки Debigging Tools for Windows является установка версий отладочных средств сразу всех архитектур.
Установка Debugging Tools for Windows с ISO-образа Windows SDK
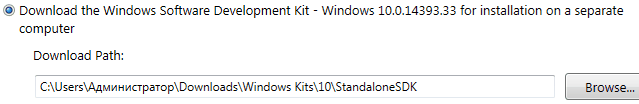
Данный метод подразумевает установку Debugging Tools for Windows с использованием полного инсталляционного образа Windows SDK (Software Developers Kit). До определенного времени, скачать образ ISO для соответствующей системы можно было на странице Архив Windows SDK. Однако, в данный момент, получить ISO-образ SDK можно через запуск web-инсталлятора sdksetup.exe , и выбора пункта Download the Windows Software Development Kit в стартовом окне инсталлятора:
Как было выяснено, предыдущий метод установки при помощи веб-инсталлятора достаточно капризен и зачастую завершается ошибкой. На чистых системах устанавливается без проблем, однако на достаточно уже нагруженных возникают многочисленные проблемы. Если у Вас именно такой случай, то воспользуйтесь данным методом.
Соответственно, на странице необходимо подобрать требуемый дистрибутив, для меня (да и думаю для многих) в данный момент это «Пакет Windows SDK для Windows 7 и .NET Framework 4» и чуть ниже нажать на ссылку «Получить ISO-образ DVD-диска».
При работе с сайтом msdn.microsoft.com советую воспользоваться браузером Internet Explorer, поскольку были замечены случаи неработоспособности конкурирующих продуктов!
Далее у нас имеется выбор между тремя вариантами образа:
| Имя | Назначение |
|---|---|
| GRMSDK_EN_DVD.iso | Образ SDK для систем с архитектурой x86 (32-битных). |
| GRMSDKIAI_EN_DVD.iso | Образ SDK для систем с архитектурой ia64. |
| GRMSDKX_EN_DVD.iso | Образ SDK для систем с архитектурой x64 (64-битных). |
Соответственно, необходимо выбрать исключительно по необходимости. Обычно разрядность Debugging Tools for Windows совпадает с разрядностью системы. У меня исследуемые системы, в основном, 64-битные, поэтому я в большинстве случаев скачиваю образ для 64-битной системы GRMSDKX_EN_DVD.iso .
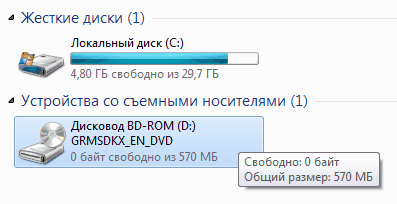
Затем, после скачивания образа, нам необходимо с имеющимся ISO-образом как-то работать. Традиционным способом является, конечно же, запись компакт-диска, но ведь это достаточно долгий и иногда затратный метод. Предлагаю воспользоваться бесплатными утилитами по созданию в системе виртуальных дисковых устройств. Лично я для этой цели предпочитаю пользоваться программой DEAMON Tools Lite. У кого-то могут быть и другие предпочтения, более прямые или легковесные утилиты, на вкус и цвет, как говорится.. После инсталляции DAEMON Tools Lite, я просто щелкаю два раза на файл образа GRMSDKX_EN_DVD.iso и в системе у меня появляется новый виртуальный компакт диск:
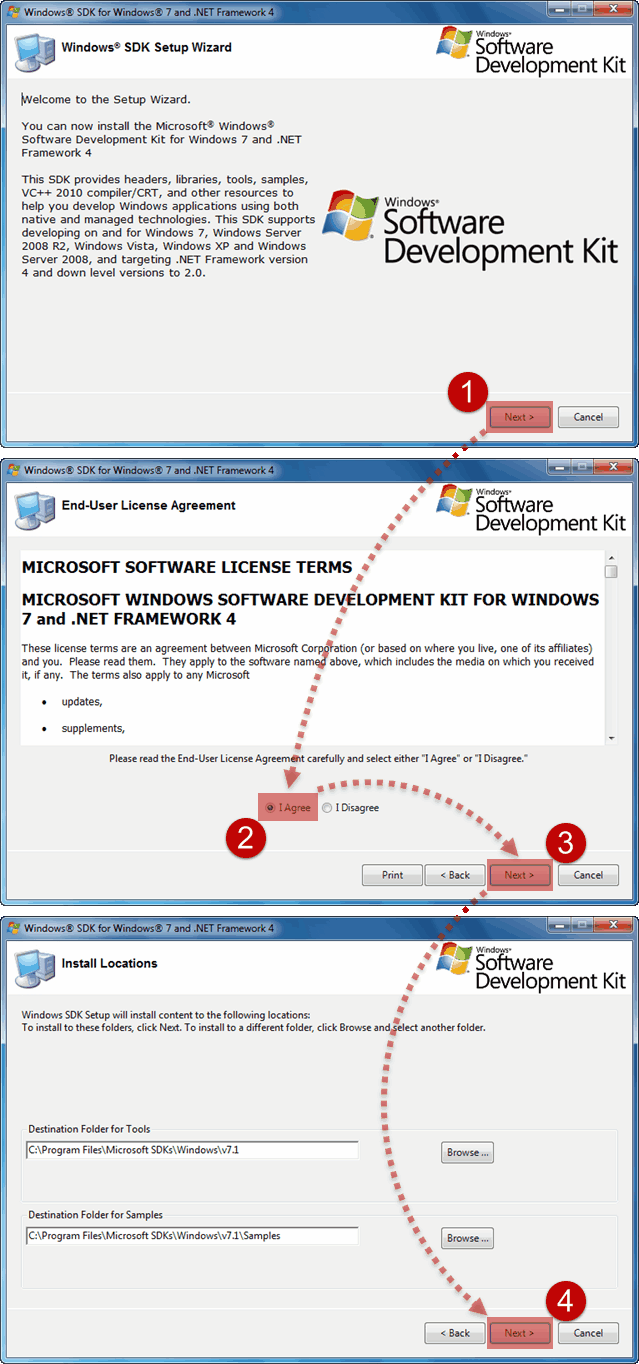
Уже затем двойным щелчком активирую автозагрузку и запускаю инсталляцию Windows SDK:
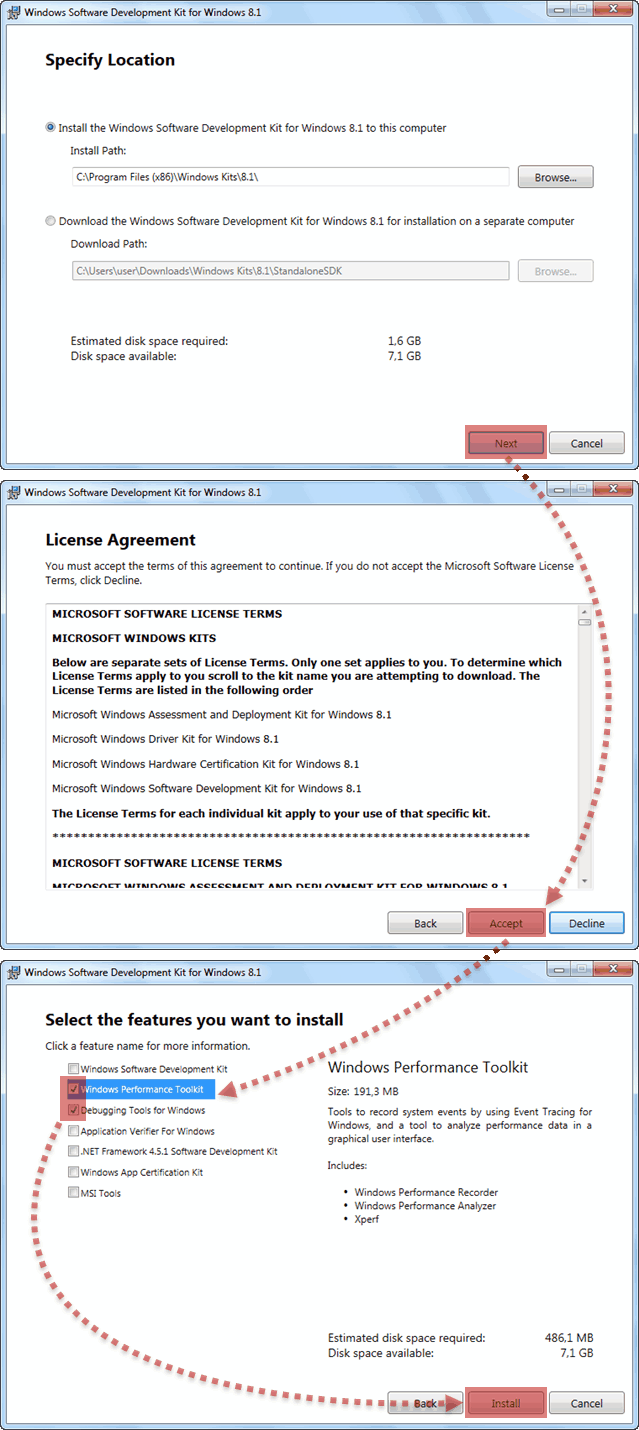
Когда подходит очередь выбирать устанавливаемые компоненты из списка, то отключаем абсолютно все опции кроме помеченных на скриншоте. Это поможет избежать ненужных нам сейчас ошибок.
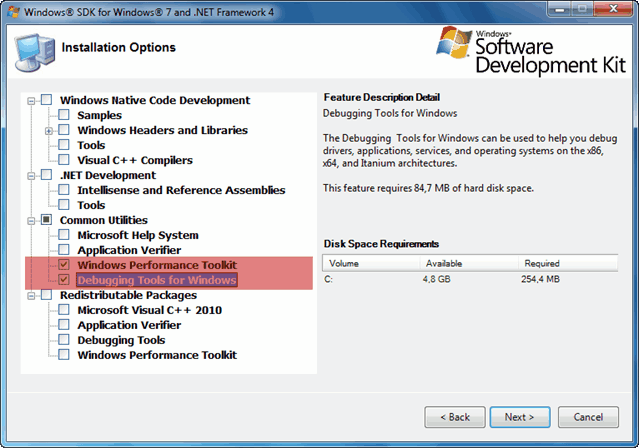
Все именно так, на скриншоте отмечено две опции: «Windows Performance Toolkit» и «Debugging Tools for Windows». Выбирайте обе, потому как Windows Performance Toolkit Вам непременно пригодится в работе! Далее, после нажатия кнопки «Next» инсталляция продолжается в обычном режиме. И в конце вы увидите надпись «Installation Complete».
По окончании инсталляции рабочие директории комплекта Debugging Tools for Windows будут следующими:
- Для версии x86: C:\Program Files (x86)\Debugging Tools for Windows (x86)
- Для версии x64: C:\Program Files\Debugging Tools for Windows (x64)
На этом установку Debugging Tools for Windows можно считать оконченной.
Установка Debugging Tools for Windows через .msi файл
В случае возникновения проблем при инсталляции Debugging Tools for Windows двумя предыдущими способами, у нас в запасе остается еще один, самый надежный и проверенный временем, выручавший, так сказать, не раз. Когда-то, до интеграции в Windows SDK, Debugging Tools for Windows были доступны в виде отдельного инсталлятора .msi, который и сейчас можно найти, однако уже в недрах дистрибутива Windows SDK. Поскольку у нас на руках имеется уже ISO-образ Windows SDK, то мы можем не монтировать его в систему, а просто открыть при помощи всем уже хорошо знакомого архиватора WinRAR, ну или любого другого продукта, работающего с содержимым ISO-дисков.
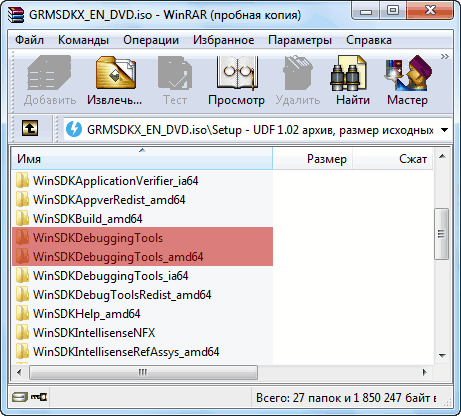
После открытия образа нам необходимо пройти в каталог «Setup», находящийся в корне и далее выбрать одну из директорий:
- Для установки 64-битной версии: \Setup\WinSDKDebuggingTools_amd64 и распаковать из этого каталога файл dbg_amd64.msi .
- Для установка 32-битной версии: \Setup\WinSDKDebuggingTools и распаковать из этого каталога файл dbg_x86.msi .
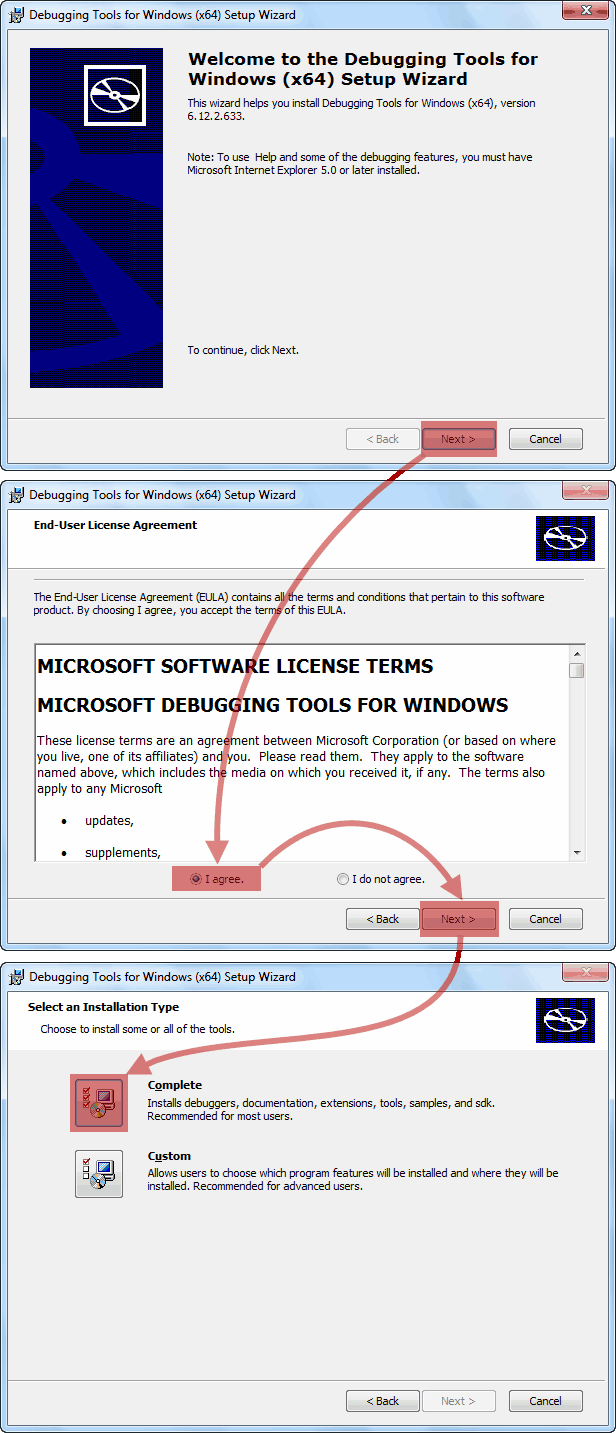
Далее, запускаем распакованный только что .msi файл и стартуем установку Debugging Tools for Windows.
По окончании инсталляции рабочие директории комплекта Debugging Tools for Windows будут следующими:
- Для версии x86: C:\Program Files (x86)\Debugging Tools for Windows (x86)
- Для версии x64: C:\Program Files\Debugging Tools for Windows (x64)
На этом установку Debugging Tools for Windows можно считать выполненной.
Дополнительные сведения
Не знаю с чем это связано, быть может с моей невнимательностью, но после инсталляции Отладочных средств для Windows, инсталлятор не прописывает в системную переменную пути Path путь к каталогу с отладчиком. Это накладывает определенные ограничения на запуск различных отладочных задач напрямую из консоли. Поэтому, в случае отсутствия пути, я самостоятельно прописываю в окне Переменные среды путь к отладочным средствам:
- C:\Program Files (x86)\Windows Kits\10\Debuggers\x86
- C:\Program Files (x86)\Windows Kits\10\Debuggers\x64
* В вашем случае пути могут отличаться как по причине использования ОС другой разрядности, так и по причине использования SDK другой версии.
Утилиты пакета Debugging Tools for Windows могут работать в качестве переносных приложений, достаточно просто скопировать с рабочей системы каталог Microsoft Windows Performance Toolkit и использовать его в качестве портабельной версии на рабочем сервере. Но не забывайте учитывать разрядность системы!! Если Вы даже произвели полную инсталляцию пакета на критически-важную систему, то работать можно начинать прямо после инсталляции, перезагрузка не требуется.
Состав Debugging Tools for Windows
И теперь напоследок приведем состав Debugging Tools for Windows:


