- Download Debugging Tools for Windows
- Download WinDbg Preview
- Debugging Tools for Windows 10 (WinDbg)
- Adding the Debugging Tools for Windows if the SDK is already installed
- Looking for the debugging tools for earlier versions of Windows?
- Learn more about the debuggers
- Getting Started with WinDbg (User-Mode)
- Launch Notepad and attach WinDbg
- Launch your own application and attach WinDbg
- Отладчик Windows (WinDbg) Windows Debugger (WinDbg)
- MinnowBoard Max (МИКРОТЕСТОВ) MinnowBoard Max (MBM)
- Настройка сетевого подключения Setup network connection
- Raspberry Pi 2 или 3 (RPi2 или RPi3) Raspberry Pi 2 or 3 (RPi2 or RPi3)
- Настройка последовательного подключения Setup serial connection
- Драгонбоард (DB) DragonBoard (DB)
- Настройка USB-подключения Setup USB connection
- Настройка последовательного подключения Setup serial connection
Download Debugging Tools for Windows
The Windows Debugger (WinDbg) can be used to debug kernel-mode and user-mode code, analyze crash dumps, and examine the CPU registers while the code executes.
To get started with Windows debugging, see Getting Started with Windows Debugging.
Download WinDbg Preview
WinDbg Preview is a new version of WinDbg with more modern visuals, faster windows, and a full-fledged scripting experience. It is built with the extensible object-orientated debugger data model front and center. WinDbg Preview is using the same underlying engine as WinDbg today, so all the commands, extensions, and workflows still work as they did before.
Download WinDbg Preview from the Microsoft Store: WinDbg Preview.
Learn more about installation and configuration in WinDbg Preview — Installation.
Debugging Tools for Windows 10 (WinDbg)
Get Debugging Tools for Windows (WinDbg) from the SDK: Windows 10 SDK. Use the download link on the Windows 10 SDK page, as the Debugging Tools for Windows are not available as part of Visual Studio.
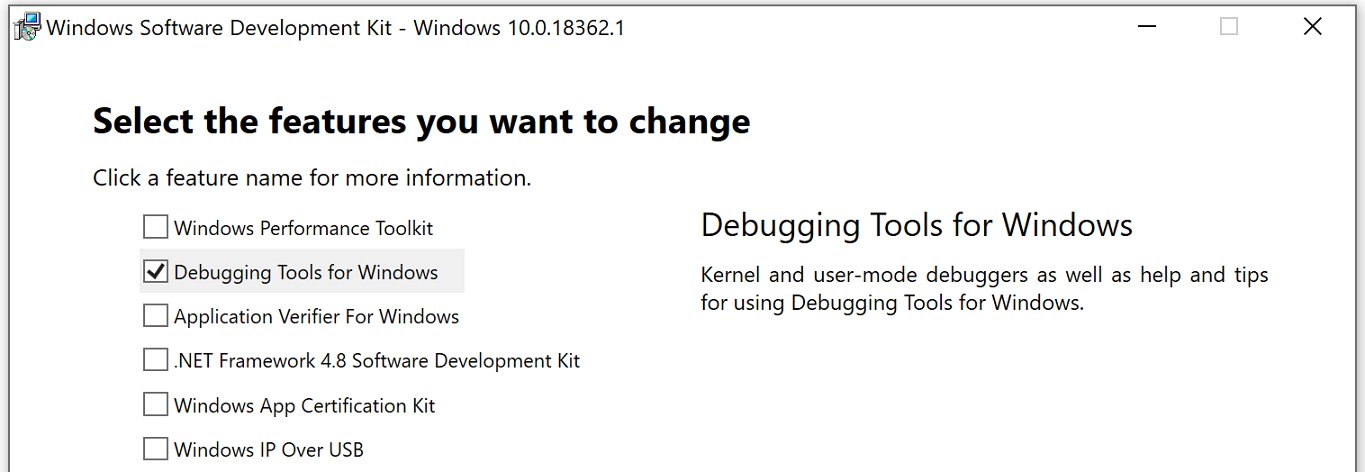
If you just need the Debugging Tools for Windows, and not the Windows Driver Kit (WDK) for Windows 10, you can install the debugging tools as a standalone component from the Windows Software Development Kit (SDK).
In the SDK installation wizard, select Debugging Tools for Windows, and deselect all other components.
Adding the Debugging Tools for Windows if the SDK is already installed
If the Windows SDK is already installed, open Settings, navigate to Apps & features, select Windows Software Development Kit, and then select Modify to change the installation to add Debugging Tools for Windows.
Looking for the debugging tools for earlier versions of Windows?
To download the debugger tools for previous versions of Windows, you need to download the Windows SDK for the version you are debugging from the Windows SDK and emulator archive. In the installation wizard of the SDK, select Debugging Tools for Windows, and deselect all other components.
Learn more about the debuggers
Learn more about WinDbg and other debuggers in Debugging Tools for Windows (WinDbg, KD, CDB, NTSD).
Getting Started with WinDbg (User-Mode)
WinDbg is a kernel-mode and user-mode debugger that is included in Debugging Tools for Windows. Here we provide hands-on exercises that will help you get started using WinDbg as a user-mode debugger.
For information about how to get Debugging Tools for Windows, see Debugging Tools for Windows (WinDbg, KD, CDB, NTSD).
After you have installed the debugging tools, locate the installation directories for 64-bit (x64) and 32-bit (x86) versions of the tools. For example:
- C:\Program Files (x86)\Windows Kits\10\Debuggers\x64
- C:\Program Files (x86)\Windows Kits\10\Debuggers\x86
Launch Notepad and attach WinDbg
Navigate to your installation directory, and open WinDbg.exe.
On the File menu, choose Open Executable. In the Open Executable dialog box, navigate to the folder that contains notepad.exe (typically, C:\Windows\System32). For File name, enter notepad.exe. Select Open.
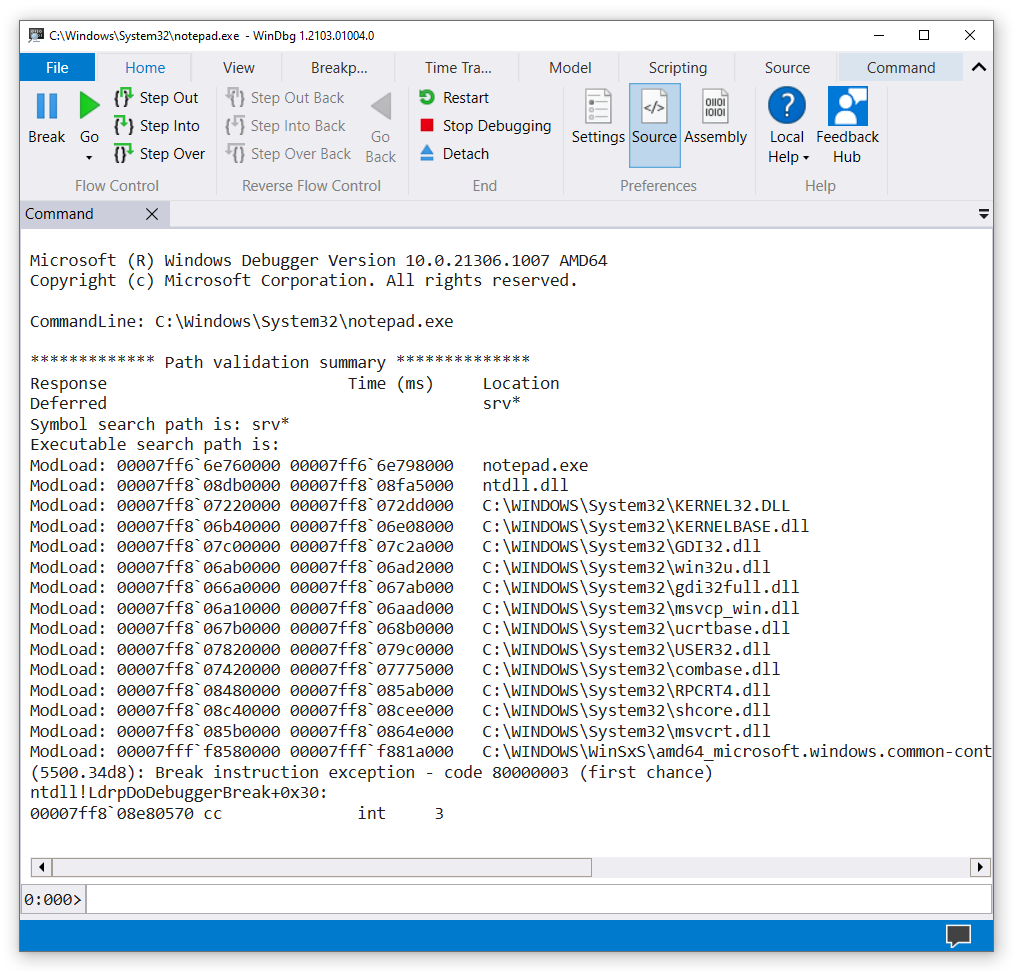
Near the bottom of the WinDbg window, in the command line, enter this command:
The output is similar to this:
The symbol search path tells WinDbg where to look for symbol (PDB) files. The debugger needs symbol files to obtain information about code modules (function names, variable names, and the like).
Enter this command, which tells WinDbg to do its initial finding and loading of symbol files:
To see the symbols for the Notepad.exe module, enter this command:
NoteВ В If you don’t see any output, enter .reload again.
To see symbols in the Notepad.exe module that contain main, use the examine symbols command like this to list modules that match the mask:
The output is similar to this:
To put a breakpoint at notepad!wWinMain, enter this command:
To verify that your breakpoint was set, enter this command:
The output is similar to this:
To start Notepad running, enter this command:
Notepad runs until it comes to the WinMain function, and then breaks in to the debugger.
To see a list of code modules that are loaded in the Notepad process, enter this command:
The output is similar to this:
To see a stack trace, enter this command:
The output is similar to this:
To start Notepad running again, enter this command:
To break in to Notepad, choose Break from the File menu.
To set and verify a breakpoint at ZwWriteFile, enter these commands:
Enter g to start Notepad running again. In the Notepad window, enter some text and choose Save from the File menu. The running code breaks in when it comes to ZwCreateFile. Enter k to see the stack trace.
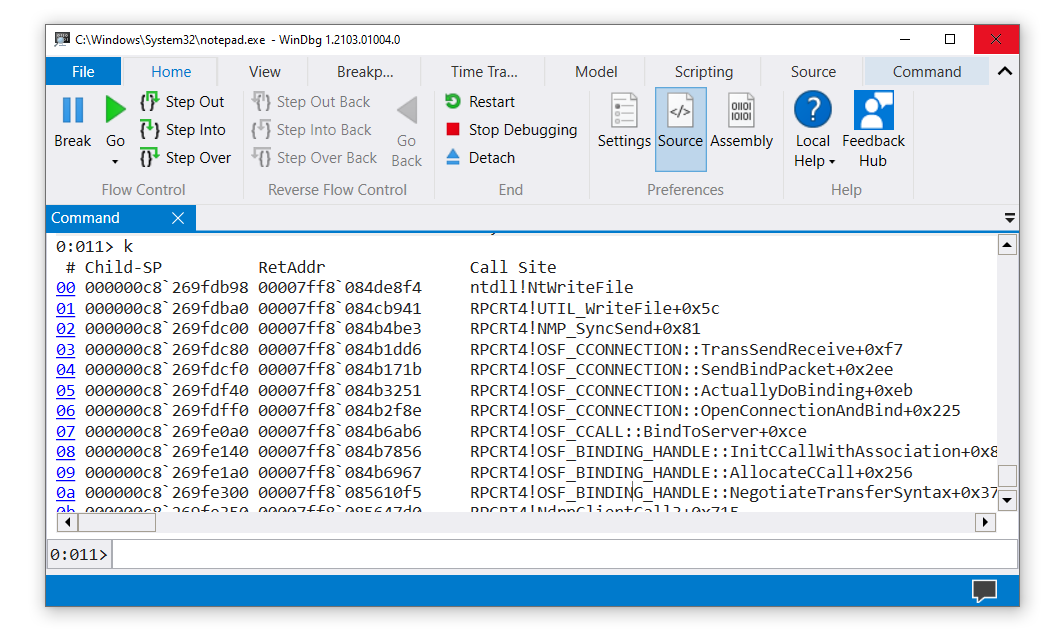
In the WinDbg window, just to the left of the command line, notice the processor and thread numbers. In this example the current processor number is 0, and the current thread number is 11. So we are looking at the stack trace for thread 11 (which happens to be running on processor 0).
To see a list of all threads in the Notepad process, enter this command (the tilde):
The output is similar to this:
In this example, there are 14 threads with indexes 0 through 13.
To look at the stack trace for thread 0, enter these commands:
The output is similar to this:
To quit debugging and detach from the Notepad process, enter this command:
Launch your own application and attach WinDbg
Suppose you have written and built this small console application.
For this exercise, we will assume that the built application (MyApp.exe) and the symbol file (MyApp.pdb) are in C:\MyApp\x64\Debug. We will also assume that the application source code is in C:\MyApp\MyApp and that the target machine compiled MyApp.exe.
On the File menu, choose Open Executable. In the Open Executable dialog box, navigate to C:\MyApp\x64\Debug. For File name, enter MyApp.exe. Select Open.
Enter these commands:
Now WinDbg knows where to find symbols and source code for your application. In this case, the source code location doesn’t need to be set with .srcpath because the symbols have fully qualified paths to the source files.
Enter these commands:
Your application breaks in to the debugger when it comes to its main function.
WinDbg displays your source code and the Command window.

On the Debug menu, choose Step Into (or press F11). Continue stepping until you have stepped into MyFunction. When you step into the line y = x / p2 , your application will crash and break in to the debugger. The output is similar to this:
Enter this command:
WinDbg displays an analysis of the problem (division by 0 in this case).
Отладчик Windows (WinDbg) Windows Debugger (WinDbg)
Отладка устройства Windows 10 IoT базовая с помощью мощного отладчика Windows, WinDbg. Debug your Windows 10 IoT Core device using the powerful Windows debugger, WinDbg.
В следующих разделах описывается, как успешно подключиться с WinDbg к устройству Windows 10 IoT базовая для отладки. The following sections describe how to successfully connect with WinDbg to a Windows 10 IoT Core device for debugging purposes. Сюда входит описание необходимых параметров программного обеспечения на устройстве, а также физические подключения оборудования. This includes a description of the necessary software settings on the device as well as the physical hardware connections.
WinDbg — очень мощный отладчик, с которым знакомы большинство разработчиков Windows. WinDbg is a very powerful debugger that most Windows developers are familiar with. Однако если вы только приступите к работе и хотите узнать больше о WinDbg, перейдите по следующим ссылкам: However, if you are just getting started and would like to learn more about WinDbg, please visit the following links:
MinnowBoard Max (МИКРОТЕСТОВ) MinnowBoard Max (MBM)
Вы можете подключить WinDbg к устройству MinnowBoard Max с помощью сетевого подключения. You can connect WinDbg to the MinnowBoard Max device using a network connection.
Настройка сетевого подключения Setup network connection
Чтобы включить отладку ядра с помощью WinDbg по сети, убедитесь, что: In order to enable kernel debugging with WinDbg over a network, ensure that:
Кабель Ethernet подключен к сети MinnowBoard Max Device. An Ethernet cable is connected to MinnowBoard Max device to your network
MinnowBoard Max Device имеет допустимый IP-адрес в вашей сети. The MinnowBoard Max device has a valid IP address in your network
Активное подключение к устройству MinnowBoard Max с помощью PowerShell An active connection to the MinnowBoard Max device via PowerShell
Используя активное подключение PowerShell, выполните следующие команды в параметре MinnowBoard Max, чтобы включить отладку по сети. Using the active PowerShell connection, execute the following commands on the MinnowBoard Max to enable debugging over the network.
bcdedit -dbgsettings net hostip: port:
Эта команда включает отладку по сети. This command enables debugging over the network. Кроме того, он указывает IP-адрес компьютера, на котором будет выполняться WinDbg (DEV_PC_IP_ADDRESS), номер сетевого порта, используемого для подключения (PORT_NUM), и уникальный ключ, который будет использоваться для различения нескольких подключений (ключ). Additionally, it specifies the IP address of the PC where WinDbg will be running (DEV_PC_IP_ADDRESS), the network port number to use for the connection (PORT_NUM), and a unique key to be used to differentiate multiple connections (KEY)
Для PORT_NUM и ключа можно использовать следующие значения в качестве примеров: 50045 и 1.2.3.4 соответственно, хотя вы можете изменить их по своему усмотрению. For PORT_NUM and KEY, you can use the following values as examples: 50045 and 1.2.3.4 respectively, although you are free to change them as you see fit
bcdedit -debug on
- Эта команда включает отладку на устройстве This command turns on debugging on the device
На компьютере разработчика запустите WinDbg с PORT_NUM и КЛЮЧЕВЫМи значениями, приведенными в предыдущих шагах, как показано ниже. «c:\Program Files (x86)\Debugging Tools for Windows (x86)\windbg.exe» -k net:port=
,key= On the developer PC, start WinDbg with the PORT_NUM and the KEY values provided in the previous steps as follows: «c:\Program Files (x86)\Debugging Tools for Windows (x86)\windbg.exe» -k net:port=
Если вы установили любой из установленных комплектов Windows, вы можете найти WinDbg в разделе C:\Program Files (x86)\Windows Kits\10\Debuggers\x86\WinDbg.exe If you have any of the Windows kits installed, you may find WinDbg under C:\Program Files (x86)\Windows Kits\10\Debuggers\x86\WinDbg.exe
- Перезагрузка устройства Иоткоре для повторного подключения к отладчику Reboot the IoTCore device to reconnect to the debugger
Raspberry Pi 2 или 3 (RPi2 или RPi3) Raspberry Pi 2 or 3 (RPi2 or RPi3)
Вы можете подключить WinDbg к Raspberry Pi 2 или 3 с помощью последовательного подключения. You can connect WinDbg to the Raspberry Pi 2 or 3 using a serial connection.
Настройка последовательного подключения Setup serial connection
Чтобы включить отладку ядра с помощью WinDbg через последовательное подключение, убедитесь, что: In order to enable kernel debugging with WinDbg over a serial connection, ensure that:
У вас есть отладочный кабель, такой как последовательный кабель от USB до TTL от Adafruit или фтди. You have a debug cable such as the USB-to-TTL Serial Cable from Adafruit or FTDI.
Кабель Ethernet или активный WiFi, соединяющий устройство Raspberry Pi 2 или 3 с вашей сетью (для IP-подключений, таких как SSH или PowerShell). An Ethernet cable or active WiFi connecting your Raspberry Pi 2 or 3 device to your network (for IP connections like SSH or PowerShell)
Устройство Raspberry Pi 2 или 3 имеет допустимый IP-адрес в сети The Raspberry Pi 2 or 3 device has a valid IP address in your network
Активное подключение к устройству Raspberry Pi 2 или 3 с помощью PowerShell или SSH An active connection to the Raspberry Pi 2 or 3 device via PowerShell or SSH
UART0 будет использоваться на устройстве Raspberry Pi 2 или 3 для подключения отладки ядра. UART0 will be used on the Raspberry Pi 2 or 3 device for the kernel debugging connection. Ниже показаны сопоставления ПИН-кода для Raspberry Pi 2 или 3, а также последовательных кабелей: The following shows the pin mappings for the Raspberry Pi 2 or 3 as well as the serial cables:
Основная идея для создания правильных последовательных подключений заключается в том, что хотя одно устройство использует его для передачи данных, другое устройство использует RX для получения данных. The basic idea for making the correct serial connections is to remember that while one device uses its TX to transmit data, the other device uses its RX to receive the data. Ниже перечислены рекомендуемые подключения. Recommended connections are listed below:
Соединение ЕФИЕСП больше не создается. The EFIESP junction is no longer created. Его необходимо подключить самостоятельно. для получения идентификатора GUID можно использовать команду mountvol. You’ll have to mount it yourself,you can use mountvol command to get the GUID. mkdir C:\EFIESP mountvol C:\EFIESP \?\Volume
Используя активное подключение PowerShell, выполните следующие команды на устройстве Raspberry Pi 2 или 3, чтобы включить отладку по последовательному подключению. Using the active PowerShell connection, execute the following commands on the Raspberry Pi 2 or 3 device to enable debugging over the serial connection.
bcdedit /store c:\EFIESP\EFI\Microsoft\Boot\BCD -dbgsettings serial
- Приведенная выше команда включает последовательное подключение для отладки. The above command enables the serial connection for debugging
- Скорость передачи для Raspberry Pi 2 или 3 жестко запрограммирована на 921600, поэтому вам не нужно указывать его. The baud-rate for the Raspberry Pi 2 or 3 is hard-coded to 921600, so you don’t have to specify it
bcdedit /store c:\EFIESP\EFI\Microsoft\Boot\BCD -debug on
- Эта команда включает отладку на устройстве This command turns on debugging on the device
На компьютере разработчика получите порт номера порта COM, назначенный в системе для кабеля USB – TTL. On the developer PC, get the COM port number PORT assigned in the system for the USB-to-TTL cable. Он будет доступен в Device Manager в разделе «порты (COM & LPT)». This will be available in Device Manager under «Ports (COM & LPT)».
«C:\Program Files (x86)\Debugging Tools for Windows (x86)\windbg.exe» -k com:port=
- Запуск WinDbg с номером порта Start WinDbg with the PORT number
Если вы установили любой из установленных комплектов Windows, вы можете найти WinDbg в разделе C:\Program Files (x86)\Windows Kits\10\Debuggers\x86\WinDbg.exe If you have any of the Windows kits installed, you may find WinDbg under C:\Program Files (x86)\Windows Kits\10\Debuggers\x86\WinDbg.exe
- Перезагрузка устройства Иоткоре для повторного подключения к отладчику Reboot the IoTCore device to reconnect to the debugger
Драгонбоард (DB) DragonBoard (DB)
Вы можете подключить WinDbg к Драгонбоард с помощью последовательного или USB-подключения. You can connect WinDbg to the DragonBoard using a serial or USB connection.
Используя активное подключение PowerShell или SSH к Драгонбоард, выполните следующие команды, чтобы включить отладку. Using the active PowerShell or SSH connection to your DragonBoard, execute the following commands to enable debugging.
- bcdedit /store c:\EFIESP\EFI\Microsoft\Boot\BCD /debug
ON - Включает отладчик Enables the debugger
Настройка USB-подключения Setup USB connection
По умолчанию параметры отладчика USB настраиваются в тестовых образах. By default the USB debugger settings are configured in the test images.
Когда отладчик ядра USB включен, порты USB на устройстве Драгонбоард могут не работать (например, клавиатура, USB-порт Ethernet может не работать). Once USB kernel debugger is on, USB ports on the DragonBoard device might not work (i.e. keyboard, usb ethernet might not work).
Настройка последовательного подключения Setup serial connection
bcdedit /store c:\EFIESP\EFI\Microsoft\Boot\BCD /dbgsettings Serial debugport:1 baudrate:115200
- Настраивает последовательный порт Configures the serial port
Перезагрузка устройства Иоткоре для повторного подключения к отладчику Reboot the IoTCore device to reconnect to the debugger


