Like many other types of drivers, Storport miniport drivers must create entries in the system event log to keep administrators informed of the condition of attached storage devices. These event log entries are often created in response to device-related failures. Events can also be logged for telemetry, debugging, and optimization.
Although the Windows kernel itself provides a flexible interface for creating event log entries, the Storport miniport model does not allow miniport drivers to access that interface directly. Instead, Storport provides a wrapper around the kernel’s system event log facility, and miniport drivers use the wrapper to create event log entries.
Specifically, Storport provides the following event log routines:
StorPortLogTelemetryEx allows a miniport to log a tracelogging measures or telemetry event with miniport-customized data (Windows 10 version 1903 and newer).
StorPortEtwChannelEvent2, StorPortEtwChannelEvent4, and StorPortEtwChannelEvent8 allow miniports to publish ETW events to a storage trace channel (Windows 10 version 1809 and newer).
StorPortLogSystemEvent allows miniports to create an event log entry (Windows 7 and newer).
Storport logs events under the «Microsoft-Windows-Storage-Storport» provider name. Errors are logged in the Operational channel, and debug/analytics are logged in Diagnose (Analytic and Debug). When using the Event Viewer application, you must first enable the Diagnose channel to view it (to enable, click on View->Show Analytic and Debug Logs).
The above functions are implemented as Storport extended functions and are available to miniport drivers using the existing extended function interface. Use of the extended function interface avoids a direct dynamic link reference to the new function. By avoiding that direct reference, miniport drivers that use the new function load properly on operating systems that do not support the function, with the function returning STOR_STATUS_NOT_IMPLEMENTED when not supported. In this way, vendors can create a single miniport driver that runs on multiple OS releases, taking advantage of the new event logging function where it is supported.
Note: In versions of Storport prior to Windows 7, Storport’s system event log interface, StorPortLogError, gave miniport drivers access to a small fraction of the capabilities of the kernel’s system event log facility, which impacts the usefulness of miniport event log entries.
For general information about Windows events, see Windows Events.
Windows Setup Log Files and Event Logs
Windows® Setup creates log files for all actions that occur during installation. If you are experiencing problems installing Windows, consult the log files to troubleshoot the installation.
WindowsВ Setup log files are available in the following directories:
Log file location
Description
Log location before Setup can access the drive.
Log location when Setup rolls back in the event of a fatal error.
Log location of Setup actions after disk configuration.
Used to log Plug and Play device installations.
Location of memory dump from bug checks.
Location of log minidumps from bug checks.
Location of Sysprep logs.
WindowsВ Setup Event Logs
WindowsВ Setup includes the ability to review the WindowsВ Setup performance events in the Windows Event Log viewer. This enables you to more easily review the actions that occurred during WindowsВ Setup and to review the performance statistics for different parts of WindowsВ Setup. You can filter the log so as to view only relevant items that you are interested in. The WindowsВ Setup performance events are saved into a log file that is named Setup.etl, which is available in the %WINDIR%\Panther directory of all installations. To view the logs, you must use the Event Viewer included with the Windows media that corresponds to the version of the customized image that you are building.
To view the logs on a computer that does not include the corresponding kit, you must run a script from the root of the media that installs the Event Trace for Windows (ETW) provider. From the command line, type:
where D is the drive letter of the Windows DVD media.
To view the WindowsВ Setup event logs
Start the Event Viewer, expand the Windows Logs node, and then click System.
In the Actions pane, click Open Saved Log and then locate the Setup.etl file. By default, this file is available in the %WINDIR%\Panther directory.
The log file contents appear in the Event Viewer.
To Export the log to a file
From the command line, use the Wevtutil or Tracerpt commands to save the log to an .xml or text file. For information about how to use these tools, see the command-line Help. The following commands show examples of how to use the tools:
Writing to the System Event Log
Errors are specified by their NTSTATUS value. The system predefines particular NTSTATUS values that can be used by drivers, and driver writers can define additional errors. Note that only certain NTSTATUS values can be used when logging errors.
Each NTSTATUS value that can be used when logging errors has an associated error message. For example, the parallel port driver uses the NTSTATUS value PAR_INTERRUPT_CONFLICT to represent hardware interrupt conflicts, with message text «Interrupt conflict detected for %1».
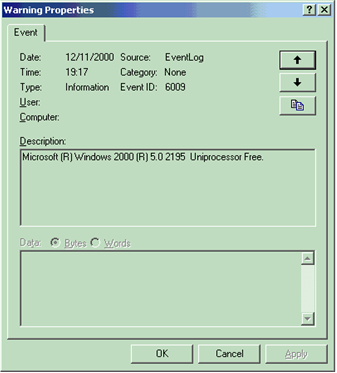
The Event Viewer displays the message text in the Description text box on the log entry’s property sheet. If the message text string contains «%1», the Event Viewer replaces it with the name of the device that logged the entry. The message text can contain additional parameters of the form «%2», «%3», and so on. When the driver logs the error, it can provide string values for those parameters. These string values are known as insertion strings. The Event Viewer will automatically insert them in place of the percent values.
The driver can also include binary data in the log entry, known as dump data. The Event Viewer displays the dump data in the Data text box of the log entry’s property sheet.
You can bring up the property sheet for a log entry by double-clicking the entry in the Event Viewer. The following screen shot shows a sample log entry property sheet.
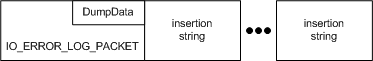
Drivers use the IoAllocateErrorLogEntry routine to allocate an error log entry. Log entries consist of a variable-length IO_ERROR_LOG_PACKET header, followed by insertion strings.
The following diagram shows the layout of an error log entry in memory.
The ErrorCode member of IO_ERROR_LOG_PACKET specifies the NTSTATUS value of the error. The DumpData member specifies any dump data for the log entry. DumpData is a variable-sized array, whose size is specified by the DumpDataSize member. Drivers specify the beginning of the first insertion string with the StringOffset member, and the number of strings in the NumberOfStrings member. Each insertion string itself is a null-terminated Unicode string.
Once the driver fills out the allocated error log entry, it writes the entry to the error log by using IoWriteErrorLogEntry. IoWriteErrorLogEntry automatically frees the memory allocated for the log entry. Drivers can use IoFreeErrorLogEntry to free any unused log entries.
Predefined error codes (of the form IO_ERR_XXX) are defined in the ntiologc.h header file that is included with the Windows Driver Kit (WDK). The error message associated with each error code can be found in the comments for ntiologc.h, next to the error code’s declaration. To use a predefined error code, the driver must register the system file, iologmsg.dll, as the source of the associated error messages. For further information, see Registering as a Source of Error Messages.
Drivers can also define their own custom error types, and associated error messages. For further information, see Defining Custom Error Types.
Windows Event Logs — Event Log FAQ
What is Windows event log?
Event logs are special files that record significant events on your computer, such as when a user logs on to the computer or when a program encounters an error. Whenever these types of events occur, Windows records the event in an event log. Users might find the details in event logs helpful when troubleshooting problems with Windows and other programs.
Unlike UNIX syslog, Microsoft event log is not a text file and it is impossible to view it with simple text editors. Microsoft Windows event log is a binary file that consists of special records – Windows events.
Microsoft Windows runs Event Log Service to manage event logs, configure event publishing, and perform operations on the logs. Windows Event Log service exposes a special API, which allows applications to maintain and manage event logs.
Windows event logging was introduced in Windows NT operating system (version 3.1) in 1993. This Windows edition came with three Windows logs: Application event log, System event log and Security event log. Modern versions of Windows come with more than a hundred of Windows eventlogs, and third party applications can create and integrate into Windows logging their own event logs.
How to view event logs?
You can view eventlogs using Event Viewer (comes with Windows operating system) or third-party Windows event viewers. We recommend using our Event Log Explorer software – it provides a lot of advanced features for event log management.
What is Windows Event Log Service?
Windows Event Log Service is a Windows service that manages events and event logs. It supports logging events, querying events, subscribing to events, archiving event logs, and managing event metadata. It helps to display events in both XML and plain text format. This service is enabled and starts automatically by default. You should not stop or disable this service. Stopping Windows Event Log service may compromise security and reliability of the system.
What are Windows event log files?
Windows Event Log Service lets users to save (backup) event logs to files. Windows NT, 2000 and XP/2003 save event logs to EVT format. Windows Vista/2008 and better save logs to EVTX format. Having backup event files are essential for incident investigation.
Windows event logs are also files, but they are commonly locked by Windows (Event Log Service) and it is impossible to open these files on «live» system. But if the computer is started from another disk or the system drive from the analyzed machine is connected to another computer, you can read event logs as files. The default location of event logs on Vista/2008 and better is «C:\Windows\System32\winevt\Logs\». Windows Event Viewer allows you to open event file as follows:
Click Open Saved Log in Actions pane of Event Viewer.
Select your event log file and it will appear in Windows Event Viewer as a log.
Our Event Log Explorer software also works with event files and does it even better than Event Viewer, e.g. it lets you read even damaged event files.
What is Windows Application event log?
The Application log contains events logged by applications or programs. For example, a database program might record a file error in the application log. Program developers decide which events should be logged. E.g. Microsoft SQL Server logs details about important events linked with SQL server, e.g. «out of memory», «backup failure» etc. One application log commonly contains events logged from different sources (applications), so it is incorrect to rely solely on event ID when analyzing the Application log. You should always rely on event ID along with event source. Some applications, such as Internet Explorer, Power Shell create own event log instead of using Windows application event log. Such logs look exactly like standard Windows event logs and Event Viewer (as well as Event Log Explorer) can read these event logs. Application logs are commonly useful for application support teams.
What is Windows System event log?
The System log contains events logged by Windows system components. For example, the failure of a driver or other system component to load during startup is recorded in the system log. The event types logged by system components are predetermined by Windows. Similarly to Application log, System event log lists events from different sources (system components) so you should not rely only on event ID when analyzing System log, instead you should rely on event ID along with event source. System logs are essential for system administrators and technicians.
Code Integrity Event Log Messages
The following are warning events that are logged to the Code Integrity operational log:
Code Integrity is unable to verify the image integrity of the file because file hash could not be found on the system.
Code Integrity detected an unsigned driver.
This event is related to Software Quality Monitoring (SQM).
The following are informational events that are logged to the Code Integrity verbose log:
Code Integrity found a set of per-page image hashes for the file in a catalog .
Code Integrity found a set of per-page image hashes for the file in the image embedded certificate.
Code Integrity found a file hash for the file in a catalog .
Code Integrity found a file hash for the file in the image embedded certificate.
Code Integrity determined an unsigned kernel module is loaded into the system. Check with the publisher to see whether a signed version of the kernel module is available.
Code Integrity is unable to verify the image integrity of the file because the set of per-page image hashes could not be found on the system.
Code Integrity is unable to verify the image integrity of the file because the set of per-page image hashes could not be found on the system. The image is allowed to load because kernel mode debugger is attached.
Code Integrity is unable to verify the image integrity of the file because a file hash could not be found on the system. The image is allowed to load because kernel mode debugger is attached.