- Открываем дампы памяти DMP
- Варианты открытия DMP
- Способ 1: BlueScreenView
- Способ 2: Microsoft Debugging Tools for Windows
- Заключение
- How to open DMP memory dump file.
- Replies (7)
- Чем открыть файл дампа памяти Windows MEMORY.DMP
- Просмотр и анализ файла минидампа.
- Просмотр полного дампа памяти MEMORY.DMP.
- Установка и настройка WinDBG.
- Просмотр и анализ файла MEMORY.DMP.
Открываем дампы памяти DMP

Варианты открытия DMP
Расширение DMP зарезервировано за файлами дампов памяти: снимков состояния RAM в определённый момент работы системы или отдельного приложения, которые нужны разработчикам для последующей отладки. Такой формат используют сотни видов ПО, и рассмотреть их все в объёмах данной статьи невозможно. Наиболее же часто встречающийся тип DMP-документа – так называемый малый дамп памяти, где записаны подробности сбоя системы, который привёл к появлению синего экрана смерти, потому на нём и сосредоточимся.
Способ 1: BlueScreenView
Небольшая бесплатная утилита от разработчика-энтузиаста, основной функцией которой является предоставление возможности просмотра DMP-файлов. Не нуждается в установке на компьютер – достаточно распаковать архив в любое подходящее место.
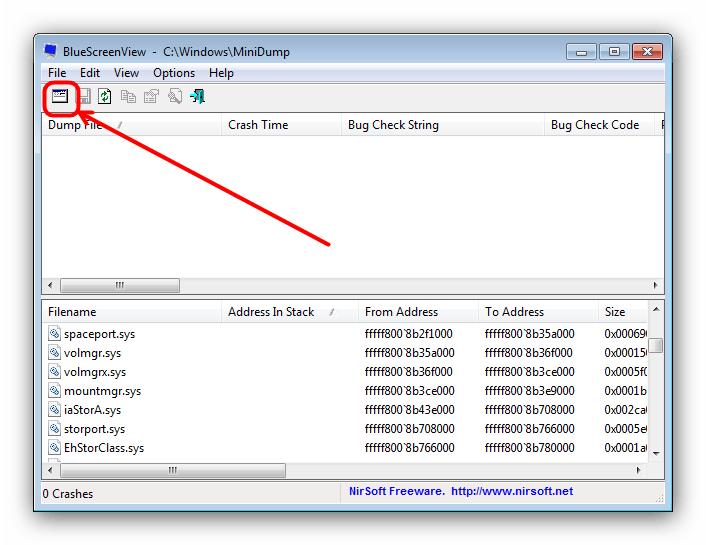
- Для открытия отдельного файла нажмите на кнопку с иконкой программы на панели инструментов.
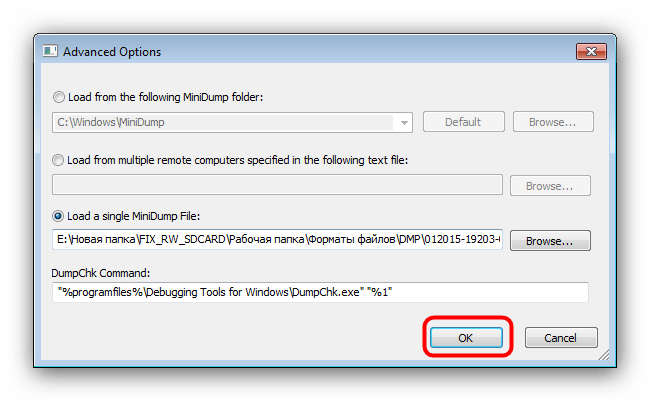
В окне «Advanced Options» отметьте чекбокс «Load a single Minidump File» и нажмите «Browse».

С помощью «Проводника» перейдите к папке с DMP-файлом, выделите его и нажмите «Открыть». 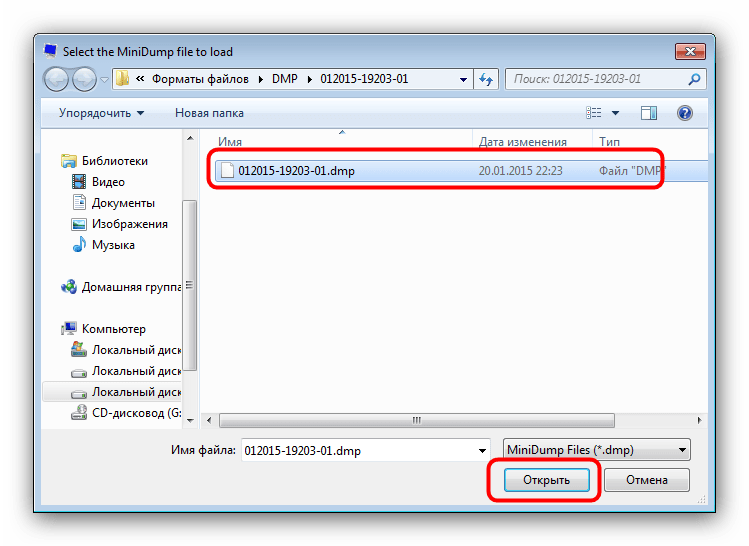
По возвращении в окно «Advanced Options» нажмите «ОК».
Утилита BlueScreenView рассчитана на продвинутых пользователей, потому её интерфейс может показаться сложным для новичка. Кроме того, доступна она только на английском языке.
Способ 2: Microsoft Debugging Tools for Windows
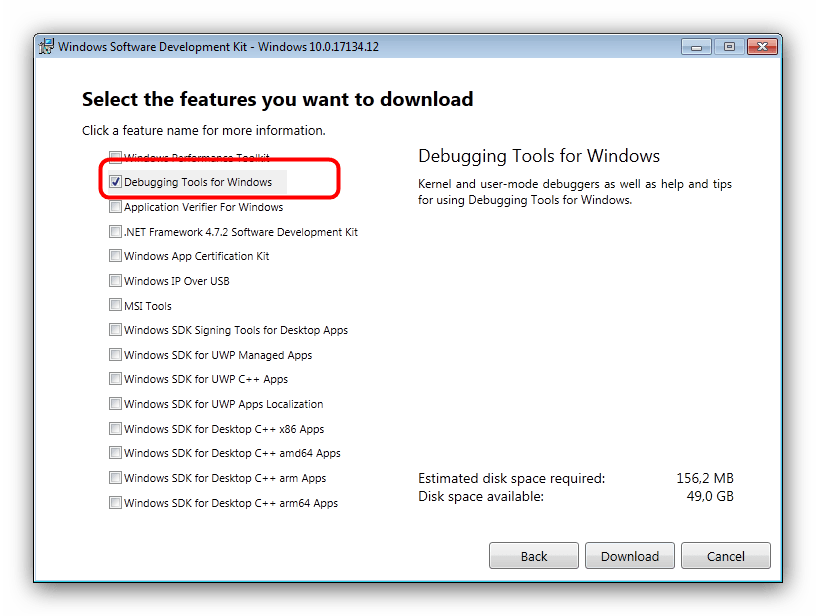
В составе среды разработки Windows SDK распространяется инструмент для отладки, который называется Debugging Tools for Windows. Приложение, рассчитанное на разработчиков, способно открывать в том числе и DMP-файлы.
- Для экономии места можно выбрать только Debugging Tools for Windows, отметив соответствующий пункт в процессе загрузки компонентов.
Запустить утилиту можно через «Пуск». Для этого откройте «Все программы», выберите «Windows Kits», а затем — «Debugging Tools for Windows».
Для запуска программы используйте ярлык «WinDbg». 
Внимание! Для открытия DMP-файлов используйте только x64- или x86-версии дебаггера!


Утилита Debugging Tools for Windows ещё более сложная, чем BlueScreenView, и тоже не имеет русской локализации, однако предоставляет более подробную и точную информацию.
Заключение
Как видим, основную сложность при открытии DMP-файлов составляют сами программы, рассчитанные больше на специалистов, чем на рядовых пользователей.
How to open DMP memory dump file.
Hello people.
I had a problem ( ? ) with a ‘bugcheck’ in Event Viewer / System every boot and resolved this ‘bugcheck’ by removing the MEMORY DMP file from system32 — I transferred it to the desktop.
So now I have a 0.99Gb DMP file on the desktop that I cannot open.The file was created when the system was installed -Dec 2003 and modified Dec 2012 — and I would like to open it but cannot find a way. It had Adobe Reader on its file properties but it never opens , Adobe Reader say » not a supported file type or file damaged».
I have only 38Gb hard drive so 0.99Gb is significant to me .
Should I just delete it?
Is it just meant only for Windows Error Reports ?
( I have been having computer crashes since mid-Dec 2011 and have set the small memory dump (64K) for computer crashes — now have 51 mini-dump files. But the crashes were mostly in Jan and Feb and down to only 1 or 2 a month . )
Thank you for taking the time to read this.
Replies (7)
I’d suggest you to refer this article in order to open DMP files.
8 people found this reply helpful
Was this reply helpful?
Sorry this didn’t help.
Great! Thanks for your feedback.
How satisfied are you with this reply?
Thanks for your feedback, it helps us improve the site.
How satisfied are you with this reply?
Thanks for your feedback.
![]()
I would not install the MS debugging tools — unless you are really interested in how to understand crash dump files (most people aren’t). That advice is flaccid.
You should remove any kind of DMP or .dmp or dump files on your desktop — that is not where they belong.
Look in your c:\windows\minidump folder and if you have 51 dump files (files that have a .dmp extension), I would delete the all so the minidump folder is empty and that will give you a «fresh» start.
The, after that, if your system crashes and you get a Blue Screen of Death (BSOD), start a new thread about that crash and somebody that actually knows how XP works and already has the debugging tools installed and knows how to use them can help you figure out what is going on. Your system should not be crashing.
Sometimes the crashes are easy to figure out, sometimes you might need to accumulate 4 or 5 crash dumps to get enough clues to figure out the problem.
Here is how you should have your system set up:
Right click My Computer, Properties, Advanced, Startup and Recovery Settings.
In the System failure section:
Put a check mark in the «Write an event to the system log» box
Put a check mark in the «Send an administrative alert» box
Uncheck the «Automatically restart» box
In the Write debugging information section, choose:
Small memory dump (64 KB)
Set the Small dump directory to:
Click OK, OK to save the settings.
Restart your computer and then wait for the next restart/crash.
Remember that Support Engineers (and sometimes Forum Moderators) will reply to any new post ASAP as long as the reply contains a link to a KB article, their work is done. The reply doesn’t have to work, it doesn’t have to be right and it doesn’t even have to make sense — it just has to have a link to a KB article to «count» for their quotas.
17 people found this reply helpful
Was this reply helpful?
Sorry this didn’t help.
Great! Thanks for your feedback.
How satisfied are you with this reply?
Thanks for your feedback, it helps us improve the site.
How satisfied are you with this reply?
Thanks for your feedback.
Hello Azeez N and Thanks for your reply.
I had read that article , but I don’t think it is a minidump file ; if it is it is gigantic — 0.99Gb
in relation to the minidump files I have — all 51 are 93Kb and they are all in C\windows\MINIDUMP whereas the 0.99Gb DMP file was in C\windows. Anyway , I do not have a Windows installation CD , only a Recovery CD so no DUMPCHK access and I tried before to install the Debugging Tools and needed to install NET 4, huge and timeconsuming and I had peroblems when I tried and gave up.
Hi again Joselbarra and Thank you for your reply.
The reason the 0.99Gb DMP file is on my Desktop is because it was causing the ‘bugcheck’ on every boot when it was in C\windows and I did not want to delete it hoping to open it and see if it shed any light on my crashes.
I have my computer set to %SystemRoot%\Minidump and have another thread in this forum with some of the minidump files listed , but the crashes were all random driver crashes so the cause was not obtained ; your very kind self assisted,
and I did as you suggested and have accumulated more minidumps but the random nature has not enklightened me and most were Windows drivers.
That is why I wanted to open this Large DMP file .
Was this reply helpful?
Sorry this didn’t help.
Great! Thanks for your feedback.
How satisfied are you with this reply?
Thanks for your feedback, it helps us improve the site.
How satisfied are you with this reply?
Thanks for your feedback.
![]()
I don’t think opening the large dump file will help you. Even if XP thinks it is an Adobe file, obviously it ain’t. If it is that big, it sounds like some other kind of file. If it is annoying and you can’t figure out what to do with it, get rid of it or move it to some other folder for a while and delete it sometime in the future when you get tired of looking at it.
Like I said back in February, when your BSOD implicates XP files, I don’t think that is usually the cause — it is always something else.
And in your other post from February, it looked like you had some crashes from Norton and some from Intel drivers and it was suggested that you look for some help out in the Intel forums.
I would ditch Norton all together and replace it with Microsoft Security Essentials, but some folks really like their Norton stuff.
If you choose to uninstall Norton, be sure to use their Norton Removal Tool.
Was this reply helpful?
Sorry this didn’t help.
Great! Thanks for your feedback.
How satisfied are you with this reply?
Thanks for your feedback, it helps us improve the site.
How satisfied are you with this reply?
Thanks for your feedback.
If you can’t get into Windows, try going into Safe Mode (rapidly tapping the F8 key just before the Windows Splash Screen shows up.
Please provide the following information:
— Please zip up the contents of the C:\Windows\Minidump directory
— Upload it to the Public area of a SkyDrive account ( https://skydrive.live.com )
— Post a link here so we can download it.
— Go to Start and type in «msinfo32» and press Enter
— When the utility opens, save a copy of it as an .nfo file, and another copy as a .txt file
— Zip them up and upload them to the Public area of a SkyDrive account ( https://skydrive.live.com )
— Post a link here so we can download it.
Use SkyDrive to upload the collected files:
Instructions courtesy of http://www.carrona.org/
And http://sysnative.com
More reading at both.
1 person found this reply helpful
Was this reply helpful?
Sorry this didn’t help.
Great! Thanks for your feedback.
How satisfied are you with this reply?
Thanks for your feedback, it helps us improve the site.
How satisfied are you with this reply?
Thanks for your feedback.
Hi Joselbarra ,
Thanks for your continuing patience and help .
I keep the DMP file on my desktop specifically so that I see it every day and am motivated to do something about it and not popped away out of sight as many things are!! and your are probably right and I will get fed up and finally delete it — you can read me like a book!
I remember and value what you said in Feb., did post for advice on the Norton 360 forum and joined and posted on the Intel forum to no avail.
I remember what you said about Norton and I have no love of Norton , but unfortunately my wife uses this computer and prepaid 2 years subscription and there are still 368 days to run — Lame excuse I know but she is the boss.
L ive L ong , O C ommunity Star and prosper !
Чем открыть файл дампа памяти Windows MEMORY.DMP
Многие знакомы с «синим экраном смерти» или BlueScreen. Синий экран появляется когда в работе Windows возникает критическая ошибка, что приводит к остановке работы операционной системы. При этом операционная система создает дамп памяти, в который записывает отладочную информацию и добавляет запись в журнал событий.
В Windows существуют два типа дампа памяти — малый дамп (minidump) и полный дамп.
Minidump находится в директории C:\Windows\Minidump и его название имеет примерно такой вид Mini051819-01.dmp.
Полный дамп располагается в папке C:\Windows и называется MEMORY.DMP.
Просмотр и анализ файла минидампа.
Для просмотра и анализа файла минидампа можно воспользоваться достаточно простой и удобной утилитой BlueScreenView от Nirsoft, которую можно скачать с официального сайта https://www.nirsoft.net/utils/blue_screen_view.html .

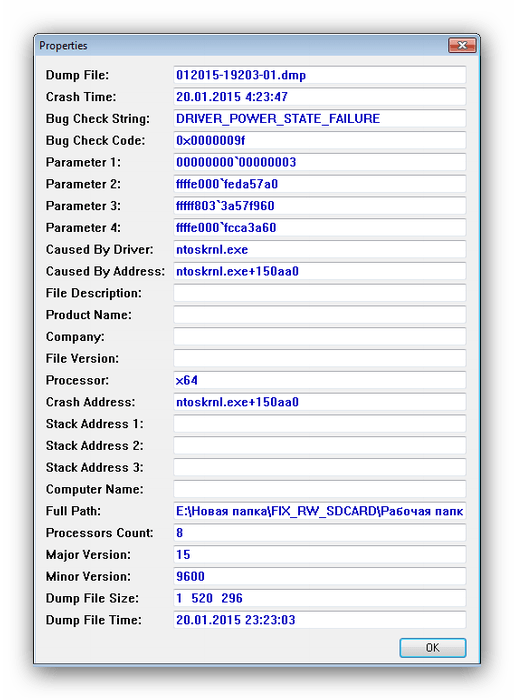
Для просмотра минидампа достаточно перетащить файл в окно программы и тут же загрузится отладочная информация. Красным будут подсвечены модули вызвавшие ошибку. В случае представленном на скриншоте выше это был драйвер tcpip.sys.
Щелкнув по имени файла минидампа можно запустить поиск решения в Google.
Но эта программа не способна обработать полный дамп памяти Windows — memory.dmp.
Просмотр полного дампа памяти MEMORY.DMP.
Чтобы посмотреть содержимое полного дампа памяти необходимо открыть файл MEMORY.DMP при помощи утилиты WinDBG, которая входит в пакет Microsoft Windows SDK. Скачать эту утилиту можно с официального сайта Майкрософт по этой ссылке https://developer.microsoft.com/ru-ru/windows/downloads/windows-10-sdk .
Установка и настройка WinDBG.
Запускаем установку пакета Windows Software Development KIT и на этапе выбора компонентов отмечаем «Debugging Tools for Windows».

При первом запуске WinDBG необходимо выполнить настройку сервера отладочных символов.
1. Переходим в меню File > Symbol File Path и вставляем строку:
где C:\symbol_cache — это директория куда будут загружаться символы.
2. Сохраняем настройку File > Save Workspace.
Просмотр и анализ файла MEMORY.DMP.
Открываем файл MEMORY.DMP: File > Open Crash Dump. Начинается процесс загрузки отладочных символов, в этот момент внизу будет видна надпись: Debugee not connected.

По окончанию загрузки появится подсказка: «для анализа этого файла запустите !analize-v».

Щелкаем по надписи !analize-v и запускается анализ дампа. В этот момент в строке состояние будет надпись *BUSY*.
По завершении обработки файла дампа памяти Windows нам необходимо найти среди полученной информации модуль, который вызвал сбой в работе. Найти сбойный модуль можно в строках MODULE_NAME и IMAGE_NAME.
В моем случае произошел сбой в работе драйвера srv.sys. В строке MODULE_NAME имя представлено в виде ссылке, щелкнув по которому можно получить информацию о модуле.

После выявления драйвера послужившего причиной сбоя в работе Windows и появления «Синего экрана смерти» необходимо попытаться обновить его.
Большинство проблем с драйверами решаются их обновлением.


