- Чем открыть файл дампа памяти Windows MEMORY.DMP
- Просмотр и анализ файла минидампа.
- Просмотр полного дампа памяти MEMORY.DMP.
- Установка и настройка WinDBG.
- Просмотр и анализ файла MEMORY.DMP.
- Symbol path for Windows debuggers
- Symbol path syntax
- Caching symbols locally
- Using a symbol server
- Combining cache* and srv*
- Using AgeStore to reduce the cache size
- Lazy symbol loading
- Azure DevOps Services Artifacts
- Controlling the symbol path
- How to read the small memory dump file that is created by Windows if a crash occurs
- Small memory dump files
- Configure the dump type
- Tools to read the small memory dump file
- Open the dump file
- Sample commands
- Examine the dump file
- Simplify the commands by using a batch file
Чем открыть файл дампа памяти Windows MEMORY.DMP
Многие знакомы с «синим экраном смерти» или BlueScreen. Синий экран появляется когда в работе Windows возникает критическая ошибка, что приводит к остановке работы операционной системы. При этом операционная система создает дамп памяти, в который записывает отладочную информацию и добавляет запись в журнал событий.
В Windows существуют два типа дампа памяти — малый дамп (minidump) и полный дамп.
Minidump находится в директории C:\Windows\Minidump и его название имеет примерно такой вид Mini051819-01.dmp.
Полный дамп располагается в папке C:\Windows и называется MEMORY.DMP.
Просмотр и анализ файла минидампа.
Для просмотра и анализа файла минидампа можно воспользоваться достаточно простой и удобной утилитой BlueScreenView от Nirsoft, которую можно скачать с официального сайта https://www.nirsoft.net/utils/blue_screen_view.html .

Для просмотра минидампа достаточно перетащить файл в окно программы и тут же загрузится отладочная информация. Красным будут подсвечены модули вызвавшие ошибку. В случае представленном на скриншоте выше это был драйвер tcpip.sys.
Щелкнув по имени файла минидампа можно запустить поиск решения в Google.
Но эта программа не способна обработать полный дамп памяти Windows — memory.dmp.
Просмотр полного дампа памяти MEMORY.DMP.
Чтобы посмотреть содержимое полного дампа памяти необходимо открыть файл MEMORY.DMP при помощи утилиты WinDBG, которая входит в пакет Microsoft Windows SDK. Скачать эту утилиту можно с официального сайта Майкрософт по этой ссылке https://developer.microsoft.com/ru-ru/windows/downloads/windows-10-sdk .
Установка и настройка WinDBG.
Запускаем установку пакета Windows Software Development KIT и на этапе выбора компонентов отмечаем «Debugging Tools for Windows».

При первом запуске WinDBG необходимо выполнить настройку сервера отладочных символов.
1. Переходим в меню File > Symbol File Path и вставляем строку:
где C:\symbol_cache — это директория куда будут загружаться символы.
2. Сохраняем настройку File > Save Workspace.
Просмотр и анализ файла MEMORY.DMP.
Открываем файл MEMORY.DMP: File > Open Crash Dump. Начинается процесс загрузки отладочных символов, в этот момент внизу будет видна надпись: Debugee not connected.

По окончанию загрузки появится подсказка: «для анализа этого файла запустите !analize-v».

Щелкаем по надписи !analize-v и запускается анализ дампа. В этот момент в строке состояние будет надпись *BUSY*.
По завершении обработки файла дампа памяти Windows нам необходимо найти среди полученной информации модуль, который вызвал сбой в работе. Найти сбойный модуль можно в строках MODULE_NAME и IMAGE_NAME.
В моем случае произошел сбой в работе драйвера srv.sys. В строке MODULE_NAME имя представлено в виде ссылке, щелкнув по которому можно получить информацию о модуле.

После выявления драйвера послужившего причиной сбоя в работе Windows и появления «Синего экрана смерти» необходимо попытаться обновить его.
Большинство проблем с драйверами решаются их обновлением.
Symbol path for Windows debuggers
The symbol path specifies locations where the Windows debuggers (WinDbg, KD, CDB, NTST) look for symbol files. For more information about symbols and symbol files, see Symbols.
Some compilers (such as Microsoft Visual Studio) put symbol files in the same directory as the binary files. The symbol files and the checked binary files contain path and file name information. This information frequently enables the debugger to find the symbol files automatically. If you are debugging a user-mode process on the computer where the executable was built, and if the symbol files are still in their original location, the debugger can locate the symbol files without you setting the symbol path.
In most other situations, you have to set the symbol path to point to your symbol file locations.
Symbol path syntax
The debugger’s symbol path is a string that consists of multiple directory paths, separated by semicolons.
Relative paths are supported. However, unless you always start the debugger from the same directory, you should add a drive letter or a network share before each path. Network shares are also supported.
For each directory in the symbol path, the debugger looks in three directories. For example, if the symbol path includes the c:\MyDir directory, and the debugger is looking for symbol information for a DLL, the debugger first looks in c:\MyDir\symbols\dll , then in c:\MyDir\dll , and finally in c:\MyDir . The debugger then repeats this process for each directory in the symbol path. Finally, the debugger looks in the current directory and then in the current directory with ..\dll appended to it. (The debugger appends ..\dll , ..\exe , or ..\sys , depending on which binaries it is debugging.)
Symbol files have date and time stamps. You do not have to worry that the debugger will use the wrong symbols that it may find first in this sequence. It always looks for the symbols that match the time stamp on the binary files that it is debugging. For more information about responses when symbols files are not available, see Compensating for Symbol-Matching Problems.
One way to set the symbol path is by entering the .sympath command. For other ways to set the symbol path, see Controlling the Symbol Path later in this topic.
Caching symbols locally
We strongly recommend that you always cache your symbols locally. One way to cache symbols locally is to include cache*; or cache*localsymbolcache;* in your symbol path.
If you include the string cache*; in your symbol path, symbols loaded from any element that appears to the right of this string are stored in the default symbol cache directory on the local computer. For example, the following command tells the debugger to get symbols from the network share \\someshare and cache the symbols in the default location on the local computer.
If you include the string cache*localsymbolcache; in your symbol path, symbols loaded from any element that appears to the right of this string are stored in the localsymbolcache directory.
For example, the following command tells the debugger to obtain symbols from the network share \\someshare and cache the symbols in the c:\MySymbols directory.
Using a symbol server
If you are connected to the Internet or a corporate network, the most efficient way to access symbols is to use a symbol server. You can use a symbol server by using the srv* , srv*symbolstore , or srv*localsymbolcache*symbolstore string in your symbol path.
If you include the string srv* in your symbol path, the debugger uses a symbol server to get symbols from the default symbol store. For example, the following command tells the debugger to use a symbol server to get symbols from the default symbol store. These symbols are not cached on the local computer.
If you include the string srv*symbolstore in your symbol path, the debugger uses a symbol server to get symbols from the symbolstore store. For example, the following command tells the debugger to use a symbol server to get symbols from the symbol store at https://msdl.microsoft.com/download/symbols. These symbols are not cached on the local computer.
If you include the string srv*localcache*symbolstore in your symbol path, the debugger uses a symbol server to get symbols from the symbolstore store and caches them in the localcache directory. For example, the following command tells the debugger to use a symbol server to get symbols from the symbol store at https://msdl.microsoft.com/download/symbols and cache the symbols in c:\MyServerSymbols .
If you have a directory on your computer where you manually place symbols, do not use that directory as the cache for symbols obtained from a symbol server. Instead, use two separate directories. For example, you can manually place symbols in c:\MyRegularSymbols and then designate c:\MyServerSymbols as a cache for symbols obtained from a server. The following example shows how to specify both directories in your symbol path.
For more information about symbol servers, see Symbol Stores and Symbol Servers.
Combining cache* and srv*
If you include the string cache*; in your symbol path, symbols loaded from any element that appears to the right of this string are stored in the default symbol cache directory on the local computer. For example, the following command tells the debugger to use a symbol server to get symbols from the store at https://msdl.microsoft.com/download/symbols and cache them in the default symbol cache directory.
If you include the string cache*localsymbolcache; in your symbol path, symbols loaded from any element that appears to the right of this string are stored in the localsymbolcache directory.
For example, the following command tells the debugger to use a symbol server to get symbols from the store at https://msdl.microsoft.com/download/symbols and cache the symbols in the c:\MySymbols directory.
Using AgeStore to reduce the cache size
You can use the AgeStore tool to delete cached files that are older than a specified date, or to delete enough old files that the resulting size of the cache is less than a specified amount. This can be useful if your downstream store is too large. For details, see AgeStore.
For more information about symbol servers and symbol stores, see Symbol Stores and Symbol Servers.
Lazy symbol loading
The debugger’s default behavior is to use lazy symbol loading (also known as deferred symbol loading). This kind of loading means that symbols are not loaded until they are required.
When the symbol path is changed, for example by using the .sympath command, all loaded modules with export symbols are lazily reloaded.
Symbols of modules with full PDB symbols will be lazily reloaded if the new path no longer includes the original path that was used to load the PDB symbols. If the new path still includes the original path to the PDB symbol file, those symbols will not be lazily reloaded.
For more information about lazy symbol loading, see Deferred Symbol Loading.
You can turn off lazy symbol loading in CDB and KD by using the -s command-line option. You can also force symbol loading by using the ld (Load Symbols) command or by using the .reload (Reload Module) command together with the /f option.
Azure DevOps Services Artifacts
A symbol server is available with Azure Artifacts in Azure DevOps Services. For information on working with Azure Artifacts in WinDbg, see Debug with symbols in WinDbg. For general information about Azure generated symbols, see Symbol files (PDBs).
Controlling the symbol path
To control the symbol path, you can do one of the following:
Use the .sympath command to display, set, change, or append to the path. The .symfix (Set Symbol Store Path) command is similar to .sympath but saves you some typing.
Before you start the debugger, use the _NT_SYMBOL_PATH and _NT_ALT_SYMBOL_PATH environment variables to set the path. The symbol path is created by appending _NT_SYMBOL_PATH after _NT_ALT_SYMBOL_PATH . (Typically, the path is set through the _NT_SYMBOL_PATH . However, you might want to use _NT_ALT_SYMBOL_PATH to override these settings in special cases, such as if you have private versions of shared symbol files.) If you try to add an invalid directory through these environment variables, the debugger ignores this directory.
When you start the debugger, use the -y command-line option to set the path.
(WinDbg only) Use the File | Symbol File Path command or press CTRL+S to display, set, change, or append to the path.
If you use the -sins command-line option, the debugger ignores the symbol path environment variable.
How to read the small memory dump file that is created by Windows if a crash occurs
This article describes how to examine a small memory dump file. A small memory dump file can help you determine why your computer crashed.
Original product version: В Windows 10 — all editions, Windows Server 2012 R2
Original KB number: В 315263
If you are looking for debug information for Windows 8 or later, please check Debugging Tools for Windows (WinDbg, KD, CDB, NTSD). For more information about small memory dump, please check Small Memory Dump.
Small memory dump files
If your computer crashes, how can you find out what happened, fix the issue and it prevent it from happening again? You may find the small memory dump file useful in this situation. The small memory dump file contains the smallest amount of useful information that could help you identify why your computer crashed. The memory dump file contains the following information:
- The Stop message, its parameters, and other data
- A list of loaded drivers
- The processor context (PRCB) for the processor that stopped
- The process information and kernel context (EPROCESS) for the process that stopped
- The process information and kernel context (ETHREAD) for the thread that stopped
- The Kernel-mode call stack for the thread that stopped
To create a memory dump file, Windows requires a paging file on the boot volume that is at least 2 megabytes (MB) in size. On computers that are running Microsoft Windows 2000, or a later version of Windows, a new memory dump file is created each time that a computer crash may occur. A history of these files is stored in a folder. If a second problem occurs and if Windows creates a second small memory dump file, Windows preserves the previous file. Windows gives each file a distinct, date-encoded file name. For example, Mini022900-01.dmp is the first memory dump file that was generated on February 29, 2000. Windows keeps a list of all the small memory dump files in the %SystemRoot%\Minidump folder.
The small memory dump file can be useful when hard disk space is limited. However, because of the limited information that is included, errors that were not directly caused by the thread that was running at the time of the problem may not be discovered by an analysis of this file.
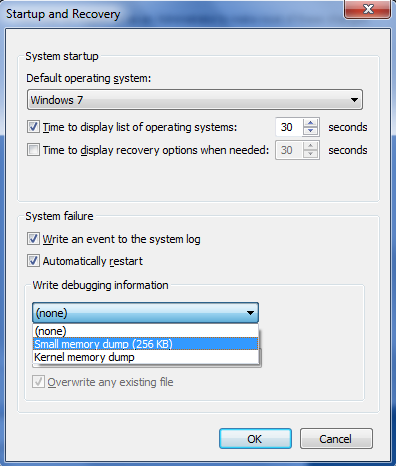
Configure the dump type
To configure startup and recovery options to use the small memory dump file, follow these steps.
Because there are several versions of Microsoft Windows, the following steps may be different on your computer. If they are, see your product documentation to complete these steps.
Click Start, and then click Control Panel.
Double-click System, and then click Advanced system settings.
Click the Advanced tab, and then click Settings under Startup and Recovery.
In the Write debugging information list, click Small memory dump (64k).
To change the folder location for the small memory dump files, type a new path in the Dump File box or in the Small dump directory box, depending on your version of Windows).
Tools to read the small memory dump file
Use the Dump Check Utility (Dumpchk.exe) to read a memory dump file or verify that the file has been created correctly.
The Dump Check Utility does not require access to debugging symbols. Symbol files hold a variety of data which are not actually needed when running the binaries, but which could be very useful in the debugging process.
For more information about how to use Dump Check Utility in Windows NT, Windows 2000, Windows Server 2003 or Windows Server 2008, see Microsoft Knowledge Base article 156280: How to Use Dumpchk.exe to check a memory dump file.
For more information about how to use Dump Check Utility in Windows XP, Windows Vista or Windows 7, see Microsoft Knowledge Base article 315271: How to use Dumpchk.exe to check a Memory Dump file.
Or, you can use the Windows Debugger (WinDbg.exe) tool or the Kernel Debugger (KD.exe) tool to read small memory dump files. WinDbg and KD.exe are included with the latest version of the Debugging Tools for Windows package.
To install the debugging tools, see the Download and Install Debugging Tools for Windows webpage. Select the Typical installation. By default, the installer installs the debugging tools in the following folder:
C:\Program Files\Debugging Tools for Windows
This Web page also provides access to the downloadable symbol packages for Windows. For more information about Windows symbols, see Debugging with Symbols, and the Download Windows Symbol Packages webpage.
For more information about dump file options in Windows, see Overview of memory dump file options for Windows.
Open the dump file
To open the dump file after the installation is complete, follow these steps:
Click Start, click Run, type cmd , and then click OK.
Change to the Debugging Tools for Windows folder. To do this, type the following at the command prompt, and then press ENTER:
To load the dump file into a debugger, type one of the following commands, and then press ENTER:
The following table explains the use of the placeholders that are used in these commands.
| Placeholder | Explanation |
|---|---|
| SymbolPath | Either the local path where the symbol files have been downloaded or the symbol server path, including a cache folder. Because a small memory dump file contains limited information, the actual binary files must be loaded together with the symbols for the dump file to be correctly read. |
| ImagePath | The path of these files. The files are contained in the I386 folder on the Windows XP CD-ROM. For example, the path may be C:\Windows\I386 . |
| DumpFilePath | The path and file name for the dump file that you are examining. |
Sample commands
You can use the following sample commands to open the dump file. These commands assume the following:
- The contents of the I386 folder on the Windows CD-ROM are copied to the C:\Windows\I386 folder.
- Your dump file is named C:\Windows\Minidump\Minidump.dmp .
Sample 2. If you prefer the graphical version of the debugger instead of the command-line version, type the following command instead:
Examine the dump file
There are several commands that you can use to gather information in the dump file, including the following commands:
- The !analyze -show command displays the Stop error code and its parameters. The Stop error code is also known as the bug check code.
- The !analyze -v command displays verbose output.
- The lm N T command lists the specified loaded modules. The output includes the status and the path of the module.
The !drivers extension command displays a list of all drivers that are loaded on the destination computer, together with summary information about their memory use. The !drivers extension is obsolete in Windows XP and later. To display information about loaded drivers and other modules, use the lm command. The lm N T command displays information in a format that is similar to the old !drivers extension.
For help with other commands and for complete command syntax, see the debugging tools Help documentation. The debugging tools Help documentation can be found in the following location:
C:\Program Files\Debugging Tools for Windows\Debugger.chm
If you have symbol-related issues, use the Symchk utility to verify that the correct symbols are loaded correctly. For more information about how to use Symchk, see Debugging with Symbols.
Simplify the commands by using a batch file
After you identify the command that you must have to load memory dumps, you can create a batch file to examine a dump file. For example, create a batch file and name it Dump.bat. Save it in the folder where the debugging tools are installed. Type the following text in the batch file:
When you want to examine a dump file, type the following command to pass the dump file path to the batch file:


