- Troubleshooting a Failover Cluster using Windows Error Reporting
- Enabling event channels
- Gathering Logs
- Gathering Windows Error Reporting reports
- Troubleshooting using Windows Error Reporting reports
- Physical disk failed to come online
- Physical disk timed out
- Служба Windows Error Reporting и очистка каталога WER\ReportQueue в Windows
- Служба Windows Error Reporting
- Очистка папки WER\ReportQueue в Windows
- Отключение Window Error Reporting в Windows Server 2012 R2 / 2008 R2
- Отключение функции сбора и отправки отчетов в Windows 10
- Отключение Windows Error Reporting через групповые политики
Troubleshooting a Failover Cluster using Windows Error Reporting
Applies to: Windows Server 2019, Windows Server 2016, Windows Server
Windows Error Reporting (WER) is a flexible event-based feedback infrastructure designed to help advanced administrators or Tier 3 support gather information about the hardware and software problems that Windows can detect, report the information to Microsoft, and provide users with any available solutions. This reference provides descriptions and syntax for all WindowsErrorReporting cmdlets.
The information on troubleshooting presented below will be helpful for troubleshooting advanced issues that have been escalated and that may require data to be sent to Microsoft for triaging.
Enabling event channels
When Windows Server is installed, many event channels are enabled by default. But sometimes when diagnosing an issue, we want to be able to enable some of these event channels since it will help in triaging and diagnosing system issues.
You could enable additional event channels on each server node in your cluster as needed; however, this approach presents two problems:
- You have to remember to enable the same event channels on every new server node that you add to your cluster.
- When diagnosing, it can be tedious to enable specific event channels, reproduce the error, and repeat this process until you root cause.
To avoid these issues, you can enable event channels on cluster startup. The list of enabled event channels on your cluster can be configured using the public property EnabledEventLogs. By default, the following event channels are enabled:
Here’s an example of the output:
The EnabledEventLogs property is a multistring, where each string is in the form: channel-name, log-level, keyword-mask. The keyword-mask can be a hexadecimal (prefix 0x), octal (prefix 0), or decimal number (no prefix) number. For instance, to add a new event channel to the list and to configure both log-level and keyword-mask you can run:
If you want to set the log-level but keep the keyword-mask at its default value, you can use either of the following commands:
If you want to keep the log-level at its default value, but set the keyword-mask you can run the following command:
If you want to keep both the log-level and the keyword-mask at their default values, you can run any of the following commands:
These event channels will be enabled on every cluster node when the cluster service starts or whenever the EnabledEventLogs property is changed.
Gathering Logs
After you have enabled event channels, you can use the DumpLogQuery to gather logs. The public resource type property DumpLogQuery is a mutistring value. Each string is an XPATH query as described here.
When troubleshooting, if you need to collect additional event channels, you can a modify the DumpLogQuery property by adding additional queries or modifying the list.
To do this, first test your XPATH query using the get-WinEvent PowerShell cmdlet:
Next, append your query to the DumpLogQuery property of the resource:
And if you want to get a list of queries to use, run:
Gathering Windows Error Reporting reports
Windows Error Reporting Reports are stored in %ProgramData%\Microsoft\Windows\WER
Inside the WER folder, the ReportsQueue folder contains reports that are waiting to be uploaded to Watson.
Here’s an example of the output:
Inside the WER folder, the ReportsArchive folder contains reports that have already been uploaded to Watson. Data in these reports is deleted, but the Report.wer file persists.
Here’s an example of the output:
Windows Error Reporting provides many settings to customize the problem reporting experience. For further information, please refer to the Windows Error Reporting documentation.
Troubleshooting using Windows Error Reporting reports
Physical disk failed to come online
To diagnose this issue, navigate to the WER report folder:
Here’s an example of the output:
Next, start triaging from the Report.wer file — this will tell you what failed.
Since the resource failed to come online, no dumps were collected, but the Windows Error Reporting report did collect logs. If you open all .evtx files using Microsoft Message Analyzer, you will see all of the information that was collected using the following queries through the system channel, application channel, failover cluster diagnostic channels, and a few other generic channels.
Here’s an example of the output:
Message Analyzer enables you to capture, display, and analyze protocol messaging traffic. It also lets you trace and assess system events and other messages from Windows components. You can download Microsoft Message Analyzer from here. When you load the logs into Message Analyzer, you will see the following providers and messages from the log channels.

You can also group by providers to get the following view:

To identify why the disk failed, navigate to the events under FailoverClustering/Diagnostic and FailoverClustering/DiagnosticVerbose. Then run the following query: EventLog.EventData[«LogString»] contains «Cluster Disk 10». This will give you give you the following output:

Physical disk timed out
To diagnose this issue, navigate to the WER report folder. The folder contains log files and dump files for RHS, clussvc.exe, and of the process that hosts the «smphost» service, as shown below:
Here’s an example of the output:
Next, start triaging from the Report.wer file — this will tell you what call or resource is hanging.
The list of services and processes that we collect in a dump is controlled by the following property: PS C:\Windows\system32> (Get-ClusterResourceType -Name «Physical Disk»).DumpServicesSmphost
Служба Windows Error Reporting и очистка каталога WER\ReportQueue в Windows
Служба WER (Windows Error Reporting) служит для сбора и отправки отладочной информации о падении системных и сторонних приложений в Windows на сервера Microsoft. По задумке Microsoft, эта информация должна анализироваться и при наличии решения, вариант исправления проблемы должен отправляется пользователю через Windows Error Reporting Response. Но по факту мало кто пользуется этим функционалом, хотя Microsoft настойчиво оставляет службу сбора ошибок WER включенной по умолчанию во всех последних версиях Windows. В большинстве случае о службе WER вспоминают, когда каталог C:\ProgramData\Microsoft\Windows\WER\ReportQueue\ начинает занимать на системном диске довольно много места (вплоть до нескольких десятков Гб).
Служба Windows Error Reporting
Служба Windows Error Reporting представляет собой отдельный сервис Windows, который можно легко отключить командой:
net stop WerSvc
Внутри каталога WER\ReportQueue\ содержится множество каталогов, с именами в формате:
- Critical_6.3.9600.18384_
_00000000_cab_3222bf78 - Critical_powershell.exe_
_cab_271e13c0 - Critical_sqlservr.exe__
_cab_b3a19651 - NonCritical_7.9.9600.18235__
_0bfcb07a - AppCrash_cmd.exe_
_bda769bf_37d3b403
Как вы видите, имя каталога содержит степень критичности события и имя конкретного exe файла, который завершился аварийно. Во всех каталогах обязательно имеется файл Report.wer, который содержит описание ошибок и несколько файлов с дополнительной информацией.
Очистка папки WER\ReportQueue в Windows
Как правило, размер каждой папки незначителен, но в некоторых случаях для проблемного процесса генерируется дамп памяти, который занимает довольно много места. На скриншоте ниже видно, что размер файла дампа memory.hdmp составляет около 610 Мб. Парочка таким дампов – и на диске исчезло несколько свободных гигибайт.
Чтобы очистить все эти ошибки и журналы штатными средствами, откройте панель управления и перейдите в раздел ControlPanel -> System and Security -> Action Center -> Maintenance -> View reliability history -> View all problem reports и нажмите на кнопку Clear all problem reports.
Для быстрого освобождения места на диске от файлов отладки, сгенерированных службой WER, содержимое следующих каталогов можно безболезненно удалить и руками.
Отключение Window Error Reporting в Windows Server 2012 R2 / 2008 R2
Отключить запись информации об ошибках Windows Error Reporting в серверных редакция Windows можно следующим образом:
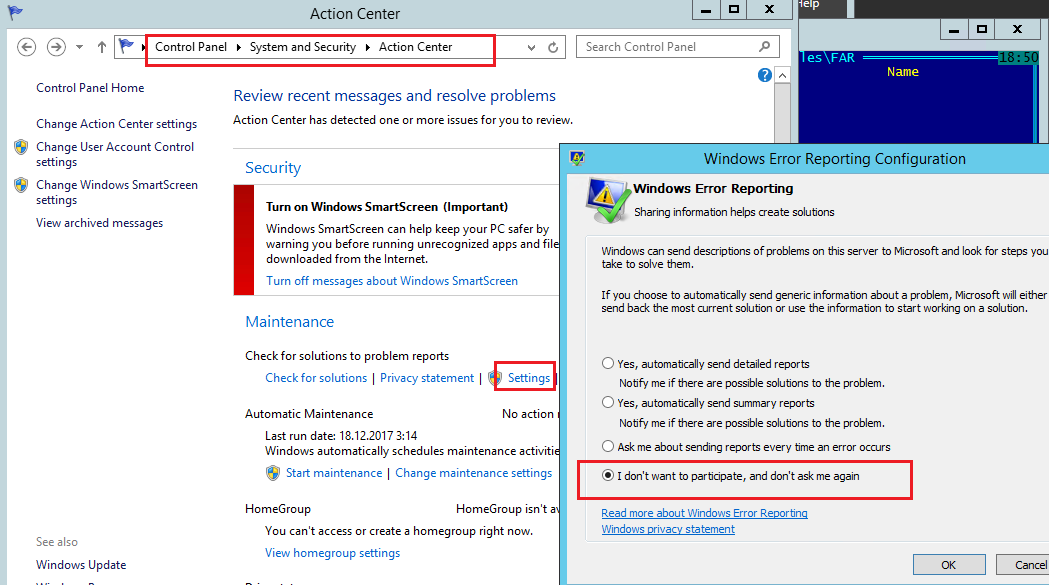
- Windows Server 2012 / R2 – Панель Управления -> System and Security -> Action Center -> раздел Maintenance -> Settings -> выберите опцию I don’t want to participate, and don’t ask me again

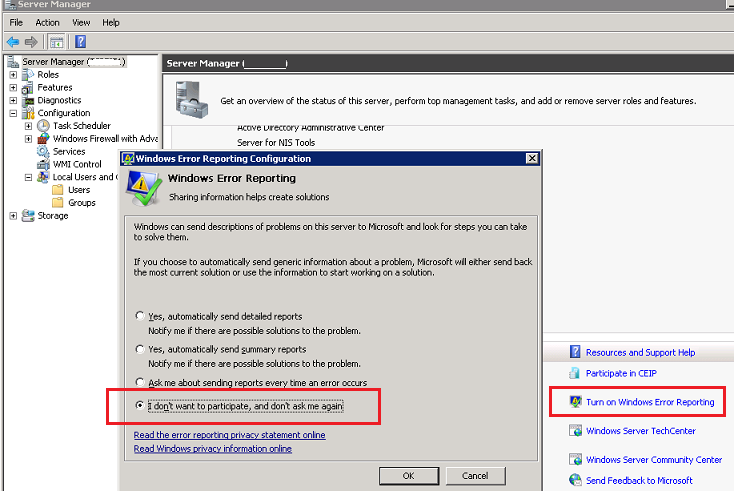
- Windows Server 2008 R2 – откройте консоль Server Manager и промотайте список, перейдя в раздел Resources and Support. Нажмите на Turn Off Windows Error Reporting и выберите пункт I don’t want to participate, and don’t ask me again.
Отключение функции сбора и отправки отчетов в Windows 10
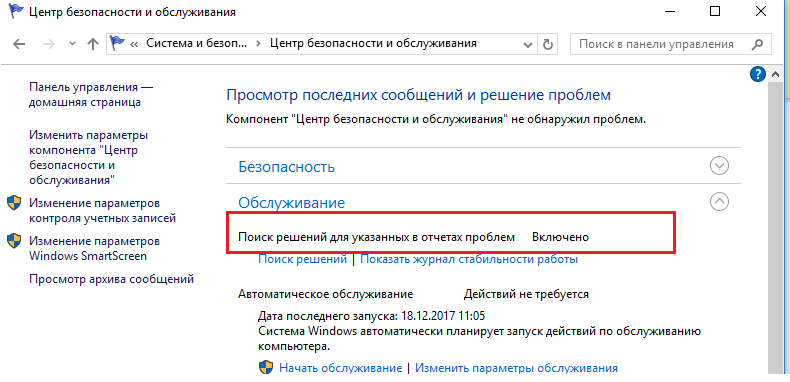
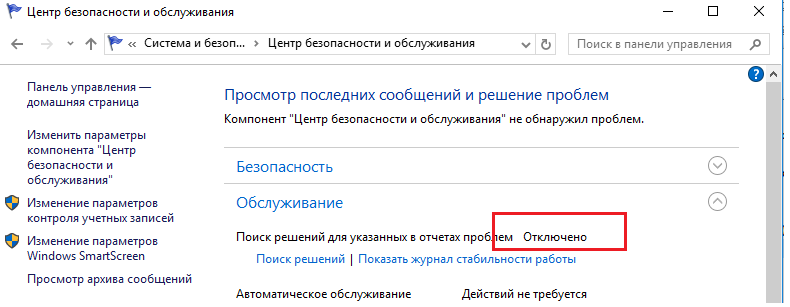
В Windows 10 возможность отключить Error Reporting через GUI отсутствует. Проверить статус компонента можно в панели управления Система и безопасность ->Центр безопасности и обслуживания -> секция Обслуживание. Как вы видите, по умолчанию параметр Поиск решения для указанных в отчетах проблем включен (Control Panel -> System and Security -> Security and Maintenance -> Maintenance -> Check for solutions to problem reports).
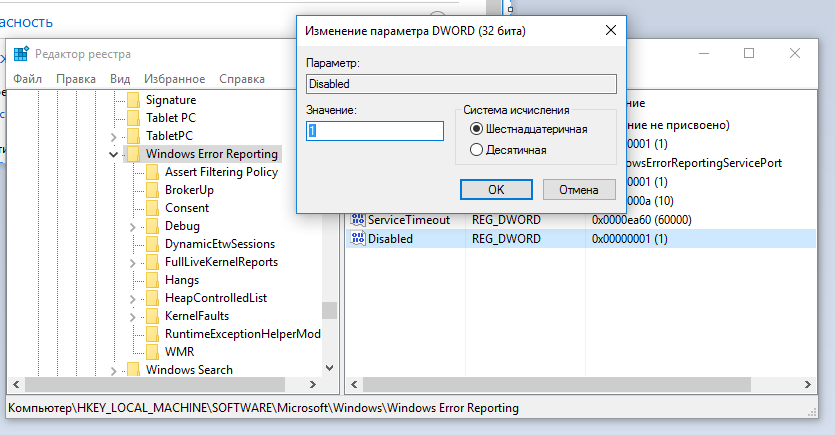
Отключить Windows Error Reporting в Windows 10 можно через реестр. Для этого в ветке HKLM\SOFTWARE\Microsoft\Windows\Windows Error Reporting нужно создать новый параметр типа DWORD (32 бита) с именем Disabled и значением 1.
Теперь еще раз проверим статус параметра Поиск решения для указанных в отчетах проблем в панели управления. Его статус должен изменится на Отключено.
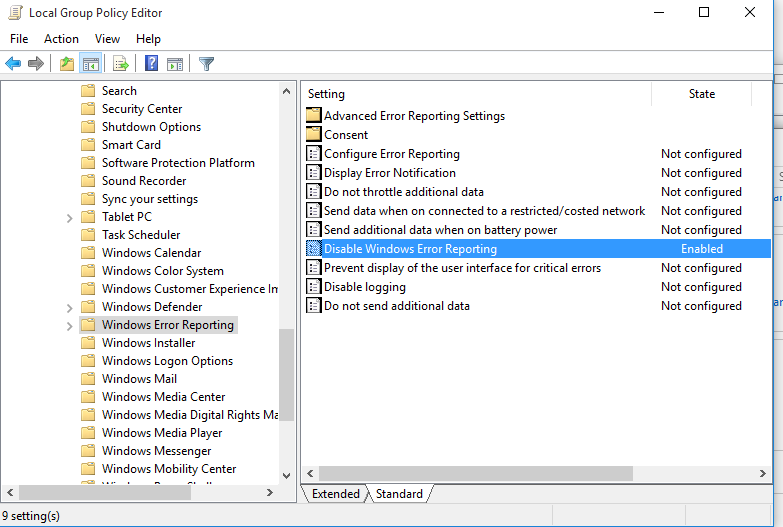
Отключение Windows Error Reporting через групповые политики
Ведение журналов службой Windows Error Reporting можно отключить и через групповую политику. Она находится в разделе Computer Configuration/Administrative Templates/Windows Components/Windows Error Reporting (Компоненты Windows -> Отчеты об ошибках Windows). Для отключения сбора и отправки данных включите политику Disable Windows Error Reporting (Отключить отчеты об ошибках Windows).
В результате сообщения об ошибках приложений в Windows перестанут формироваться и автоматически отправляться в Microsoft.


