- Windows Event Log Error Constants
- Event ID 10 is logged in the Application log after you install Service Pack 1 for Windows 7 or Windows Server 2008 R2
- Symptoms
- Cause
- Resolution
- More information
- Event Logging (Windows Installer)
- Windows Event Log Service not starting or is unavailable
- Windows Event Log Service Not Starting or Running
- Event Log service is unavailable. Verify that the service is running
- Windows could not start the Windows Event Log service on Local Computer
- System cannot find the file specified
- Вертим логи как хотим ― анализ журналов в системах Windows
- Журналы и командная строка
- Работаем с журналами посредством запросов SQL
Windows Event Log Error Constants
The following are the error codes that Windows Event Log defines.
ERROR_EVT_INVALID_CHANNEL_PATH
The specified channel path is not valid.
ERROR_EVT_INVALID_QUERY
The specified query is not valid.
ERROR_EVT_PUBLISHER_METADATA_NOT_FOUND
The provider metadata cannot be found in the resource.
ERROR_EVT_EVENT_TEMPLATE_NOT_FOUND
The template for an event definition cannot be found in the resource.
ERROR_EVT_INVALID_PUBLISHER_NAME
The specified provider name is not valid.
ERROR_EVT_INVALID_EVENT_DATA
The event data raised by the provider is not compatible with the event template definition in the provider’s manifest.
ERROR_EVT_CHANNEL_NOT_FOUND
The specified channel cannot be found. Check the channel configuration.
ERROR_EVT_MALFORMED_XML_TEXT
The specified XML text was not well-formed. For more information, call the EvtGetExtendedStatus function.
ERROR_EVT_SUBSCRIPTION_TO_DIRECT_CHANNEL
You cannot subscribe to an Analytic or Debug channel; the events for an Analytic or Debug channel go directly to a log file and cannot be subscribed to.
ERROR_EVT_CONFIGURATION_ERROR
A configuration error occurred.
ERROR_EVT_QUERY_RESULT_STALE
The query result is not valid. This may be due to the log being cleared or rolling over after the query result was created. Release the query result object and reissue the query.
ERROR_EVT_QUERY_RESULT_INVALID_POSITION
The cursor for the query result is not pointing to a valid position.
ERROR_EVT_NON_VALIDATING_MSXML
The registered MSXML parser does not support validation.
ERROR_EVT_FILTER_ALREADYSCOPED
An expression can be followed by a change of scope operation only if the expression evaluates to a node set and is not already part of some other change of scope operation.
ERROR_EVT_FILTER_NOTELTSET
Cannot perform a step operation from a term that does not represent an element set.
ERROR_EVT_FILTER_INVARG
The arguments on the left side of a binary operator must be either attributes, nodes, or variables, and the arguments on the right side must be constants.
ERROR_EVT_FILTER_INVTEST
A step operation must involve either a node test or, in the case of a predicate, an algebraic expression against which to test each node in the node set identified by the preceding node set can be evaluated.
ERROR_EVT_FILTER_INVTYPE
This data type not supported.
ERROR_EVT_FILTER_PARSEERR
A syntax error occurred at the specified position.
ERROR_EVT_FILTER_UNSUPPORTEDOP
This operator is unsupported by this implementation of the filter.
ERROR_EVT_FILTER_UNEXPECTEDTOKEN
The token encountered was unexpected.
ERROR_EVT_INVALID_OPERATION_OVER_ENABLED_DIRECT_CHANNEL
The requested operation cannot be performed over an enabled Analytic or Debug channel. You must disable the channel before performing the requested operation.
ERROR_EVT_INVALID_CHANNEL_PROPERTY_VALUE
The channel property contains a value that is not valid. The value’s type may not be valid, the value may be out of range, or the value cannot be updated or is not supported for this type of channel.
ERROR_EVT_INVALID_PUBLISHER_PROPERTY_VALUE
The provider property contains a value that is not valid. The value’s type may not be valid, the value may be out of range, or the value cannot be updated or is not supported for this type of provider.
ERROR_EVT_CHANNEL_CANNOT_ACTIVATE
The channel failed to activate.
ERROR_EVT_FILTER_TOO_COMPLEX
The XPath expression exceeded supported complexity. Simplify the expression or split it into two or more simple expressions.
ERROR_EVT_MESSAGE_NOT_FOUND
The message resource is present, but the message is not found in the string or message table.
ERROR_EVT_MESSAGE_ID_NOT_FOUND
The message identifier cannot be found.
ERROR_EVT_UNRESOLVED_VALUE_INSERT
The substitution string for the insert index cannot be found.
ERROR_EVT_UNRESOLVED_PARAMETER_INSERT
The description string for parameter reference (%1) cannot be found.
ERROR_EVT_MAX_INSERTS_REACHED
The maximum number of replacements has been reached.
ERROR_EVT_EVENT_DEFINITION_NOT_FOUND
The event definition cannot be found for the event identifier.
ERROR_EVT_MESSAGE_LOCALE_NOT_FOUND
The locale-specific resource for the desired message is not present.
ERROR_EVT_VERSION_TOO_OLD
The resource is too old to be compatible.
ERROR_EVT_VERSION_TOO_NEW
The resource is too new to be compatible.
ERROR_EVT_CANNOT_OPEN_CHANNEL_OF_QUERY
The channel at the specified index of the query cannot be opened.
ERROR_EVT_PUBLISHER_DISABLED
The provider has been disabled and its resources are not available. This can occur when the provider is uninstalled or upgraded.
ERROR_EVT_FILTER_OUT_OF_RANGE
Attempted to create a numeric type that is outside of its valid range.
Event ID 10 is logged in the Application log after you install Service Pack 1 for Windows 7 or Windows Server 2008 R2
This article provides a script to solve the event ID 10 that’s logged after you install Service Pack 1 for Windows 7 or Windows Server 2008 R2.
Original product version: В Windows 7 Service Pack 1, Windows Server 2008 R2 Service Pack 1
Original KB number: В 2545227
Symptoms
After you install Windows 7 Service Pack 1 (SP1) or Windows Server 2008 R2 SP1 using integrated media, the following WMI error is logged in the application log after every reboot:
Cause
This issue originated in the Windows 7 SP1 DVD/ISO creation process. There was an issue in the creation process that caused a WMI registration to remain in the DVD/ISO. Since the registration is designed to work only during the DVD/ISO creation process, it fails to run on a live system and causes these events. These events aren’t indicative of any issue in the system and can be safely ignored. If you want to prevent these events from getting generated and want to remove this specific WMI registration manually, run the workaround script.
Resolution
To resolve the issue, run a script to stop the Event ID 10 messages. To run the script, follow these steps:
In Notepad, create a new document named Workaround.txt.
Copy the following script into notepad:
Save the text as Workaround.vbs.
Open an elevated command prompt:
- Select Start.
- Select Programs.
- Right-click on Command Prompt.
- Choose run as administrator.
Change Directory to the one containing workaround.vbs, for example, CD c:\users\%username% .
Run the script workaround.vbs.
After running the script, the Event ID 10 errors related to this event should stop occurring. This script doesn’t remove any of the existing entries in the Event log, they would need to be manually cleared out of the application event log.
There can be other reasons for Event ID 10 error messages. This workaround only prevents the error message listed above from occurring.
More information
This particular Event ID 10 error message listed above can be safely ignored. It isn’t indicative of a problem with the Service Pack or with the operating system.
Event Logging (Windows Installer)
Windows Events provides a standard, centralized way for applications (and the operating system) to record important software and hardware events. The event-logging service stores events from various sources in a single collection called an event log. Prior to WindowsВ Vista, you would use either Event Tracing for Windows (ETW) or Event Logging to log events. WindowsВ Vista introduced a new eventing model that unifies both ETW and the Windows Event Log API.
The installer also writes entries into the event log. These record events such as following:
- Success or failure of the installation; removal or repair of a product.
- Errors that occur during product configuration.
- Detection of corrupted configuration data.
If a large amount of information is written, the Event Log file can become full and the installer displays the message, «The Application log file is full.»
The installer may write the following entries in the event log. All event log messages have a unique event ID. All general errors authored in the Error table that are returned for an installation that fails are logged in the Application Event Log with a message ID equal to the Error + 10,000. For example, the error number in the Error table for an installation completed successfully is 1707. The successful installation is logged in the Application Event Log with a message ID of 11707 (1707 + 10,000).
For information about how to enable verbose logging on a user’s computer when troubleshooting deployment, see Windows Installer Best Practices.
Windows Event Log Service not starting or is unavailable
Windows Event Log service maintains a set of event logs that the system, system components, and applications use to record events. The service exposes functions that allow programs to maintain and manage the event logs and perform operations on the logs, such as archiving and clearing. As such, administrators can maintain event logs and perform administrative tasks requiring administrator privileges.
Windows Event Log Service Not Starting or Running
For some unknown reason, if you find you are having difficulty starting the following, it is quite possible that one of the reasons could be that Windows Event Log Service is Not Running.
- Task Scheduler
- Windows Event Calendar
- Messenger Sharing Folders
In such a scenario, you may get error messages like:
Event Log service is unavailable. Verify that the service is running
Windows could not start the Windows Event Log service on Local Computer
First, reboot your system and see if it helps. Sometimes a simple restart helps reinitialize this service. If the Windows Event Log shows as being started, re-start it from Services Manager.
To check if the Windows Event Log service is started or stopped, Run services.msc and hit Enter to open the Services Manager. Here, again right-click on Windows Event Log Service, check up its Properties.
Ensure that the Startup type is set on Automatic and that the services is Started; and that it runs in the Local Service account.
Also ensure in the Recovery tab, all three drop-down boxes, show the option as ‘Restart the Service’, in case of Failure. Reboot if required.
At times the Windows Event Log Service still will not start, and you may instead get the following error message:
System cannot find the file specified
In this case, open the following folder:
This logs folder contains Event Logs in .evtx format and can only be read with the Event Viewer. Give this logs folder Read-Write access rights and see if it helps.
You might also want to do the following.
Open Registry Editor and navigate to the following key:
Double-click ObjectName and ensure that its value is set at NT AUTHORITY\LocalService. If it is not, then change it.
If it still does not help, run the System File Checker and go through its logs.
Вертим логи как хотим ― анализ журналов в системах Windows

Пора поговорить про удобную работу с логами, тем более что в Windows есть масса неочевидных инструментов для этого. Например, Log Parser, который порой просто незаменим.
В статье не будет про серьезные вещи вроде Splunk и ELK (Elasticsearch + Logstash + Kibana). Сфокусируемся на простом и бесплатном.
Журналы и командная строка
До появления PowerShell можно было использовать такие утилиты cmd как find и findstr. Они вполне подходят для простой автоматизации. Например, когда мне понадобилось отлавливать ошибки в обмене 1С 7.7 я использовал в скриптах обмена простую команду:
Она позволяла получить в файле fail.txt все ошибки обмена. Но если было нужно что-то большее, вроде получения информации о предшествующей ошибке, то приходилось создавать монструозные скрипты с циклами for или использовать сторонние утилиты. По счастью, с появлением PowerShell эти проблемы ушли в прошлое.
Основным инструментом для работы с текстовыми журналами является командлет Get-Content, предназначенный для отображения содержимого текстового файла. Например, для вывода журнала сервиса WSUS в консоль можно использовать команду:
Для вывода последних строк журнала существует параметр Tail, который в паре с параметром Wait позволит смотреть за журналом в режиме онлайн. Посмотрим, как идет обновление системы командой:
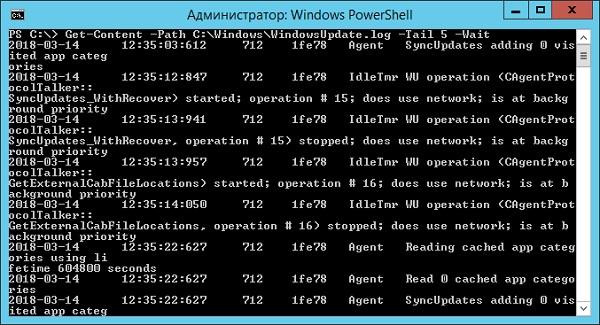
Смотрим за ходом обновления Windows.
Если же нам нужно отловить в журналах определенные события, то поможет командлет Select-String, который позволяет отобразить только строки, подходящие под маску поиска. Посмотрим на последние блокировки Windows Firewall:
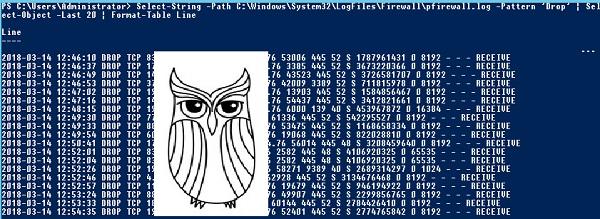
Смотрим, кто пытается пролезть на наш дедик.
При необходимости посмотреть в журнале строки перед и после нужной, можно использовать параметр Context. Например, для вывода трех строк после и трех строк перед ошибкой можно использовать команду:
Оба полезных командлета можно объединить. Например, для вывода строк с 45 по 75 из netlogon.log поможет команда:
Журналы системы ведутся в формате .evtx, и для работы с ними существуют отдельные командлеты. Для работы с классическими журналами («Приложение», «Система», и т.д.) используется Get-Eventlog. Этот командлет удобен, но не позволяет работать с остальными журналами приложений и служб. Для работы с любыми журналами, включая классические, существует более универсальный вариант ― Get-WinEvent. Остановимся на нем подробнее.
Для получения списка доступных системных журналов можно выполнить следующую команду:
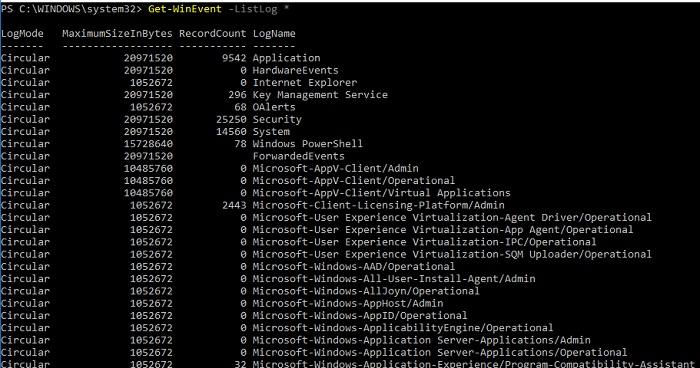
Вывод доступных журналов и информации о них.
Для просмотра какого-то конкретного журнала нужно лишь добавить его имя. Для примера получим последние 20 записей из журнала System командой:
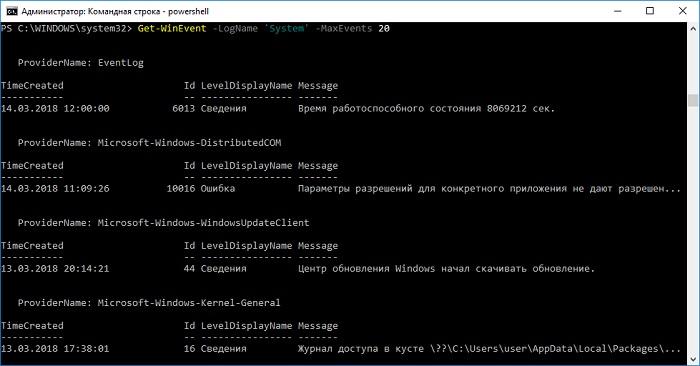
Последние записи в журнале System.
Для получения определенных событий удобнее всего использовать хэш-таблицы. Подробнее о работе с хэш-таблицами в PowerShell можно прочитать в материале Technet about_Hash_Tables.
Для примера получим все события из журнала System с кодом события 1 и 6013.
В случае если надо получить события определенного типа ― предупреждения или ошибки, ― нужно использовать фильтр по важности (Level). Возможны следующие значения:
- 0 ― всегда записывать;
- 1 ― критический;
- 2 ― ошибка;
- 3 ― предупреждение;
- 4 ― информация;
- 5 ― подробный (Verbose).
Собрать хэш-таблицу с несколькими значениями важности одной командой так просто не получится. Если мы хотим получить ошибки и предупреждения из системного журнала, можно воспользоваться дополнительной фильтрацией при помощи Where-Object:
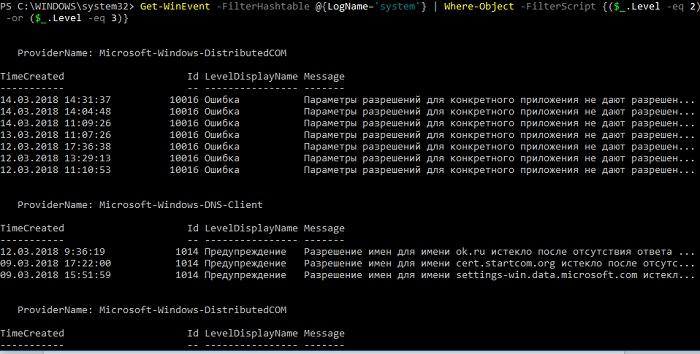
Ошибки и предупреждения журнала System.
Аналогичным образом можно собирать таблицу, фильтруя непосредственно по тексту события и по времени.
Подробнее почитать про работу обоих командлетов для работы с системными журналами можно в документации PowerShell:
PowerShell ― механизм удобный и гибкий, но требует знания синтаксиса и для сложных условий и обработки большого количества файлов потребует написания полноценных скриптов. Но есть вариант обойтись всего-лишь SQL-запросами при помощи замечательного Log Parser.
Работаем с журналами посредством запросов SQL
Утилита Log Parser появилась на свет в начале «нулевых» и с тех пор успела обзавестись официальной графической оболочкой. Тем не менее актуальности своей она не потеряла и до сих пор остается для меня одним из самых любимых инструментов для анализа логов. Загрузить утилиту можно в Центре Загрузок Microsoft, графический интерфейс к ней ― в галерее Technet. О графическом интерфейсе чуть позже, начнем с самой утилиты.
О возможностях Log Parser уже рассказывалось в материале «LogParser — привычный взгляд на непривычные вещи», поэтому я начну с конкретных примеров.
Для начала разберемся с текстовыми файлами ― например, получим список подключений по RDP, заблокированных нашим фаерволом. Для получения такой информации вполне подойдет следующий SQL-запрос:
Посмотрим на результат:

Смотрим журнал Windows Firewall.
Разумеется, с полученной таблицей можно делать все что угодно ― сортировать, группировать. Насколько хватит фантазии и знания SQL.
Log Parser также прекрасно работает с множеством других источников. Например, посмотрим откуда пользователи подключались к нашему серверу по RDP.
Работать будем с журналом TerminalServices-LocalSessionManager\Operational.
Не со всеми журналами Log Parser работает просто так ― к некоторым он не может получить доступ. В нашем случае просто скопируем журнал из %SystemRoot%\System32\Winevt\Logs\Microsoft-Windows-TerminalServices-LocalSessionManager%4Operational.evtx в %temp%\test.evtx.
Данные будем получать таким запросом:

Смотрим, кто и когда подключался к нашему серверу терминалов.
Особенно удобно использовать Log Parser для работы с большим количеством файлов журналов ― например, в IIS или Exchange. Благодаря возможностям SQL можно получать самую разную аналитическую информацию, вплоть до статистики версий IOS и Android, которые подключаются к вашему серверу.
В качестве примера посмотрим статистику количества писем по дням таким запросом:
Если в системе установлены Office Web Components, загрузить которые можно в Центре загрузки Microsoft, то на выходе можно получить красивую диаграмму.
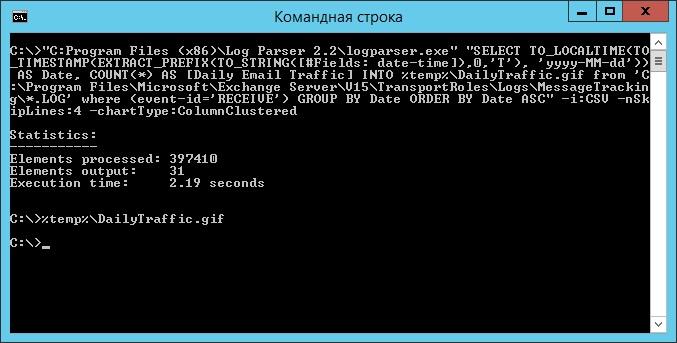
Выполняем запрос и открываем получившуюся картинку…

Любуемся результатом.
Следует отметить, что после установки Log Parser в системе регистрируется COM-компонент MSUtil.LogQuery. Он позволяет делать запросы к движку утилиты не только через вызов LogParser.exe, но и при помощи любого другого привычного языка. В качестве примера приведу простой скрипт PowerShell, который выведет 20 наиболее объемных файлов на диске С.
Ознакомиться с документацией о работе компонента можно в материале Log Parser COM API Overview на портале SystemManager.ru.
Благодаря этой возможности для облегчения работы существует несколько утилит, представляющих из себя графическую оболочку для Log Parser. Платные рассматривать не буду, а вот бесплатную Log Parser Studio покажу.

Интерфейс Log Parser Studio.
Основной особенностью здесь является библиотека, которая позволяет держать все запросы в одном месте, без россыпи по папкам. Также сходу представлено множество готовых примеров, которые помогут разобраться с запросами.
Вторая особенность ― возможность экспорта запроса в скрипт PowerShell.
В качестве примера посмотрим, как будет работать выборка ящиков, отправляющих больше всего писем:
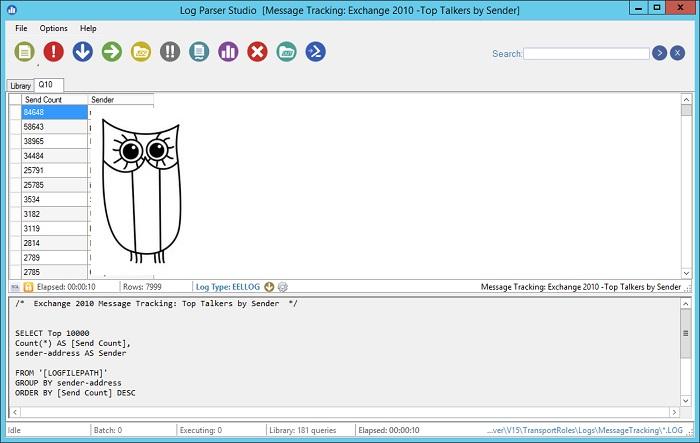
Выборка наиболее активных ящиков.
При этом можно выбрать куда больше типов журналов. Например, в «чистом» Log Parser существуют ограничения по типам входных данных, и отдельного типа для Exchange нет ― нужно самостоятельно вводить описания полей и пропуск заголовков. В Log Parser Studio нужные форматы уже готовы к использованию.
Помимо Log Parser, с логами можно работать и при помощи возможностей MS Excel, которые упоминались в материале «Excel вместо PowerShell». Но максимального удобства можно достичь, подготавливая первичный материал при помощи Log Parser с последующей обработкой его через Power Query в Excel.
Приходилось ли вам использовать какие-либо инструменты для перелопачивания логов? Поделитесь в комментариях.


