- File | Kernel Debug
- Dialog Box
- Installing Windows Symbol Files
- Getting Started with WinDbg (Kernel-Mode)
- Set up a kernel-mode debugging
- Virtual Machine — VMs
- Establish a kernel-mode debugging session
- Get started using WinDbg
- Accessing Symbols for Debugging
- Debug Windows Drivers — Step by Step Lab (Echo Kernel-Mode)
- Lab objectives
- Lab setup
- Section 1: Connect to a kernel mode WinDbg session
- Configure kernel–mode debugging using ethernet
- Section 4: Install the KMDF echo driver sample on the target system
- Section 5: Use WinDbg to display information about the driver
- Section 6: Displaying Plug and Play device tree information
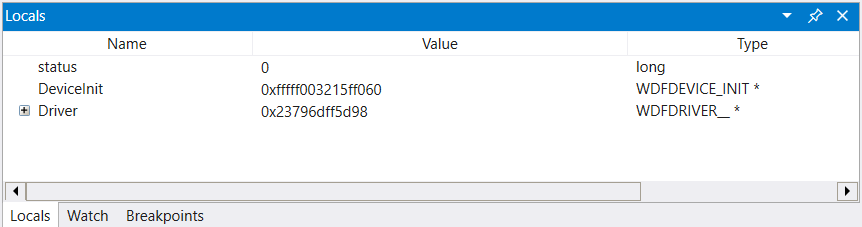
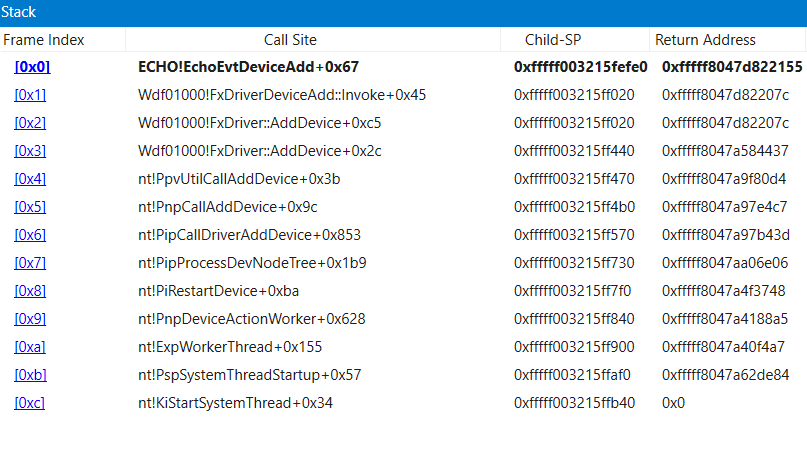
- Section 8: Viewing variables and call stacks
- Section 9: Displaying processes and threads
- Processes
- Viewing the saved IRQL
- Ending the WinDbg session
File | Kernel Debug
Click Kernel Debug on the File menu to debug a target computer in kernel mode.
This command is equivalent to pressing CTRL+K. You can use this command only when WinDbg is in dormant mode.
Dialog Box
When you click Kernel Debug, the Kernel Debugging dialog box appears with these tabs:
The COM tab indicates that the connection will use a COM port. In the Baud Rate box, enter the baud rate. In the Port box, enter the name of the COM port. For more information, see Setting Up a Serial Connection Manually.
You can also use the COM tab to connect to virtual machine through a named pipe. In the Port box, enter \\VMHost\pipe\PipeName. VMHost specifies the name of the physical computer on which the virtual machine is running. If the virtual machine is running on the same computer as the kernel debugger itself, use a single period (.) for VMHost. For more information, see Setting Up a Connection to a Virtual Machine.
The 1394 tab indicates that the connection will use 1394. In the Channel box, enter the 1394 channel number. 1394 debugging is supported only if both the host computer and target computer are running Windows XP or later versions of the Windows operating system. For more information, see Setting Up a 1394 Connection Manually.
The USB tab indicates that the connection will use USB 2.0 or USB 3.0. In the Target Name box, enter the target name that you created when you configured the target computer. For more information, see Setting Up a USB 2.0 Connection Manually and Setting Up a USB 3.0 Connection Manually.
The NET tab indicates that the connection will use Ethernet. In the Port Number box, enter the port number that you specified when you configured the target computer. In the Key box, enter the key that was generated for you (or that you created) when you configured the target computer. For more information, see Setting Up a Network Connection Manually.
The Local tab indicates that WinDbg will perform local kernel debugging. Local kernel debugging is supported only on Windows XP and later.
For more information and for other methods of beginning a kernel debugging session, see Live Kernel-Mode Debugging Using WinDbg.
Installing Windows Symbol Files
Before you debug the Windows kernel, a driver or app, you need access to the proper symbol files. The official way to get Windows symbols is to use the Microsoft Symbol Server. The symbol server makes symbols available to your debugging tools as needed. After a symbol file is downloaded from the symbol server it is cached on the local computer for quick access.
You can connect to the Microsoft Symbol Server with one simple use of the .symfix (Set Symbol Store Path) command. For full details, see Microsoft Public Symbols.
We are no longer publishing the offline symbol packages for Windows. The faster Windows update cadence means the Windows debugging symbols are quickly made out of date. We have made significant improvements to the online Microsoft Symbol Server where symbols for all Windows versions and updates are available. You can find more about this in this blog entry.
For information on how to retrieve symbols for a machine that is not connected to the Internet, see Using a Manifest File with SymChk.
If you are going to debug a user-mode app, you need to install the symbols for this app as well.
You can debug an app if you have its symbols but not Windows symbols. However, your results will be much more limited. You will still be able to step through the app code, but any debugger activity which requires analysis of the kernel (such as getting a stack trace) is likely to fail.
Getting Started with WinDbg (Kernel-Mode)
WinDbg is a kernel-mode and user-mode debugger that is included in Debugging Tools for Windows. Here we provide hands-on exercises that will help you get started using WinDbg as a kernel-mode debugger.
For information about how to get Debugging Tools for Windows, see Debugging Tools for Windows (WinDbg, KD, CDB, NTSD). After you have installed the debugging tools, locate the installation directories for 64-bit (x64) and 32-bit (x86) versions of the tools. For example:
- C:\Program Files (x86)\Windows Kits\10\Debuggers\x64
- C:\Program Files (x86)\Windows Kits\10\Debuggers\x86
Set up a kernel-mode debugging
A kernel-mode debugging environment typically has two computers: the host computer and the target computer. The debugger runs on the host computer, and the code being debugged runs on the target computer. The host and target are connected by a debug cable.
The Windows debuggers support these types of cables for debugging:
- Ethernet
- USB 2.0 / USB 3.0
- Serial (also called null modem)
For speed and reliablity, using Ethernet with a local network hub, is recommended. This diagram illustrates a host and target computer connected for debugging over Ethernet cable.

Another option for older versions of Windows is to use a direct cable such as USB or serial cable.

For details about how to set up the host and target computers, see Setting Up Kernel-Mode Debugging Manually.
Virtual Machine — VMs
For information on connecting a debugger to a Hyper-V virtual machine, see Setting Up Network Debugging of a Virtual Machine — KDNET.
Establish a kernel-mode debugging session
After you have set up your host and target computer and connected them with a debug cable, you can establish a kernel-mode debugging session by following the instructions in the same topic that you used for getting set up. For example, if you decided to set up your host and target computers for debugging over Ethernet, you can find instructions for establishing a kernel-mode debugging session is this topic:
Get started using WinDbg
On the host computer, open WinDbg and establish a kernel-mode debugging session with the target computer.
In WinDbg, choose Contents from the Help menu. This opens the debugger documentation CHM file. The debugger documentation is also available on line in Debugging Tools for Windows.
When you establish a kernel-mode debugging session, WinDbg might break in to the target computer automatically. If WinDbg has not already broken in, choose Break from the Debug menu.
Near the bottom of the WinDbg window, in the command line, enter this command:
The output is similar to this:
The symbol search path tells WinDbg where to look for symbol (PDB) files. The debugger needs symbol files to obtain information about code modules (function names, variable names, and the like).
Enter this command, which tells WinDbg to do its initial finding and loading of symbol files:
To see a list of loaded modules, enter this command:
The output is similar to this:
To start target computer running, enter this command:
To break in again, choose Break from the Debug menu.
Enter this command to examine the _FILE_OBJECT data type in the nt module:
The output is similar to this:
Enter this command to examine some of the symbols in the nt module:
The output is similar to this:
Enter this command to put a breakpoint at MmCreateProcessAddressSpace:
To verify that the breakpoint is set, enter this command:
The output is similar to this:
Enter g to let the target computer run.
If the target computer doesn’t break in to the debugger immediately, perform a few actions on the target computer (for example, open Notepad). The target computer will break in to the debugger when MmCreateProcessAddressSpace is called. To see the stack trace, enter these commands:
The output is similar to this:
On the View menu, choose Disassembly.
On the Debug menu, choose Step Over (or press F10). Enter step commands a few more times as you watch the Disassembly window.
Clear your breakpoint by entering this command:
Enter g to let the target computer run. Break in again by choosing Break from the Debug menu or pressing CTRL-Break.
To see a list of all processes, enter this command:
The output is similar to this:
Copy the address of one process, and enter this command:
For example: !process ffffe00000d5290 2
The output shows the threads in the process.
Copy the address of one thread, and enter this command:
For example: !thread ffffe00000e6d080
The output shows information about the individual thread.
To see all the device nodes in the Plug and Play device tree, enter this command:
To see the device nodes along with their hardware resources, enter this command:
To see a device node that has a service name of disk, enter this command:
The output of !devnode 0 1 displays the address of the physical device object (PDO) for the node. Copy the address of a physical device object (PDO), and enter this command:
For example: PdoAddress!devstack 0xffffe00001159610
To get information about the driver disk.sys, enter this command:
The output of !drvobj displays addresses of dispatch routines: for example, CLASSPNP!ClassGlobalDispatch. To set and verify a breakpoint at ClassGlobalDispatch, enter these commands:
Enter g to let the target computer run.
If the target computer doesn’t break in to the debugger immediately, perform a few actions on the target computer (for example, open Notepad and save a file). The target computer will break in to the debugger when ClassGlobalDispatch is called. To see the stack trace, enter these commands:
The output is similar to this:
To end your debugging session, enter this command:
Accessing Symbols for Debugging
Setting up symbols correctly for debugging can be a challenging task, particularly for kernel debugging. It often requires that you know the names and releases of all products on your computer. The debugger must be able to locate each of the symbol files corresponding to the product releases and service packs.
This can result in an extremely long symbol path consisting of a long list of directories.
To simplify these difficulties in coordinating symbol files, the symbol files can be gathered into a symbol store, which is then accessed by a symbol server.
A symbol store is a collection of symbol files, an index, and a tool that can be used by an administrator to add and delete files. The files are indexed according to unique parameters such as the time stamp and image size. A symbol store can also hold executable image files which can be extracted using a symbol server. Debugging Tools for Windows contains a symbol store creation tool called SymStore.
A symbol server enables the debuggers to automatically retrieve the correct symbol files from a symbol store without the user needing to know product names, releases, or build numbers. Debugging Tools for Windows contains a symbol server called SymSrv. The symbol server is activated by including a certain text string in the symbol path. Each time the debugger needs to load symbols for a newly loaded module, it calls the symbol server to locate the appropriate symbol files.
If you wish to use a different method for your symbol search than that provided by SymSrv, you can create your own symbol server DLL. For details on implementing such a symbol server, see Other Symbol Servers.
If you are performing user-mode debugging, you will need symbols for the target application. If you are performing kernel-mode debugging, you will need symbols for the driver you are debugging, as well as the Windows public symbols. Microsoft has created a symbol store with public symbols for Microsoft products; this symbol store is available on the internet. These symbols can be loaded using the .symfix (Set Symbol Store Path) command, as long as you have access to the internet while your debugger is running. For more information or to determine how to manually install these symbols, see Installing Windows Symbol Files.
Debug Windows Drivers — Step by Step Lab (Echo Kernel-Mode)
This lab introduces the WinDbg kernel debugger. WinDbg is used to debug the echo kernel mode sample driver code.
Lab objectives
This lab includes exercises that introduce the debugging tools, teach common debugging commands, illustrate the use of break points, and show the use of the debugging extensions.
In this lab, a live kernel debug connection is used to explore the following:
- Use the Windows debugger commands
- Use standard commands (Call stacks, variables, threads, IRQL)
- Use advanced driver debugging commands (!commands)
- Use symbols
- Set breakpoints in live debugging
- View call stacks
- Display the Plug and Play device tree
- Work with thread and process context
Note When working with the Windows debugger, there are two types of debugging that can be performed — user or kernel mode debugging.
User mode — Applications and subsystems run on the computer in user mode. Processes that run in user mode do so within their own virtual address spaces. They are restricted from gaining direct access to many parts of the system, including system hardware, memory that was not allocated for their use, and other portions of the system that might compromise system integrity. Because processes that run in user mode are effectively isolated from the system and other user mode processes, they cannot interfere with these resources.
Kernel mode — Kernel mode is the processor access mode in which the operating system and privileged programs run. Kernel mode code has permission to access any part of the system, and is not restricted like user mode code. It can gain access to any part of any other process running in either user mode or kernel mode. Much of the core OS functionality and many hardware device drivers run in kernel mode.
This lab will focus on kernel mode debugging, as that is the method used to debug many device drivers.
This exercise covers debug commands that are frequently used during both user-mode and kernel-mode debugging. The exercise also covers debug extensions (sometimes called «!commands») that are used for kernel-mode debugging.
Lab setup
You will need the following hardware to be able to complete the lab.
- A laptop or desktop computer (host) running Windows 10
- A laptop or desktop computer (target) running Windows 10
- A network hub/router and network cables to connect the two PCs
- Access to the internet to download symbol files
You will need the following software to be able to complete the lab.
- Visual Studio
- Windows Software Development Kit (SDK) for Windows 10
- Windows Driver Kit (WDK) for Windows 10
- The sample echo driver for Windows 10
The lab has the following eleven sections.
Section 1: Connect to a kernel mode WinDbg session
In Section 1, you will configure network debugging on the host and target system.
The PCs in this lab need to be configured to use an Ethernet network connection for kernel debugging.
This lab uses two PCs. Windows debugger runs on the host system and the KMDF Echo driver runs on the target system.
Use a network hub/router and network cables to connect the two PCs.

To work with kernel mode applications and use WinDbg, we recommend that you use the KDNET over Ethernet transport. For information about how to use the Ethernet transport protocol, see Getting Started with WinDbg (Kernel-Mode). For more information about setting up the target computer, see Preparing a Computer for Manual Driver Deployment and Setting Up KDNET Network Kernel Debugging Automatically.
Configure kernel–mode debugging using ethernet
To enable kernel mode debugging on the target system, perform the following steps.
On the target system
- Open a command prompt on the target system and use the ping command to confirm network connectivity between the two systems. Use the actual IP address of the host system you recorded instead of 169.182.1.1 that is shown in the sample output.
Enable kernel mode debugging on the target system by completing the following steps.
Before using BCDEdit to change boot information you may need to temporarily suspend Windows security features such as BitLocker and Secure Boot on the test PC. Re-enable these security features when testing is complete and appropriately manage the test PC, when the security features are disabled.
On the target computer, open a Command Prompt window as Administrator. Enter this command to enable debugging.
Type this command to enable test signing.
Type this command to set the IP address of the host system. Use the IP address of the host system that you recorded earlier, not the one shown.
Warning To increase the security of the connection and decrease the risk of the random client debugger connection requests, consider using an auto generated random key. For more information, see Setting Up KDNET Network Kernel Debugging Automatically.
Type this command to confirm that the dbgsettings they are set properly.
Note
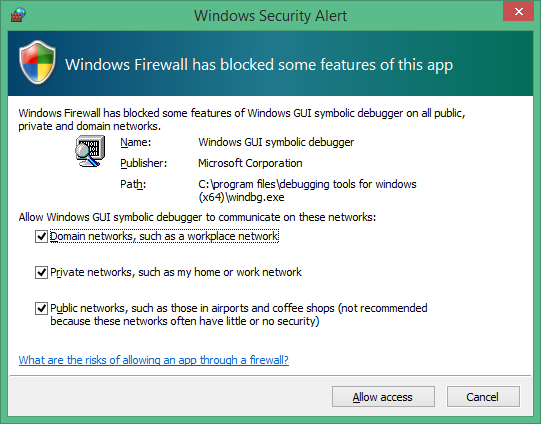
Firewalls and debuggers
If you receive a pop-up message from the firewall, and you wish to use the debugger, check all three of the boxes.
On the target system
Reboot the target system.
Section 2: Kernel mode debugging commands and techniques
In Section 2, you will use debug commands to display information about the target system.
Section 3: Download and build the KMDF echo driver
In Section 3, you will download and build the KMDF echo driver.
Typically, you would be working with your own driver code when you use WinDbg. To become familiar with WinDbg operation, the KMDF Template «Echo» sample driver is used. With the source code available, it will also be easier to understand the information that is displayed in WinDbg. In addition, this sample is used to illustrate how you can single step through native kernel mode code. This technique can be very valuable for debugging complex kernel mode code issues.
To download and build the Echo sample audio driver, perform the following steps.
Download and extract the KMDF Echo sample from GitHub
You can use a browser to view the echo sample in GitHub here:
You can read about the sample here:
You can browse all of the Windows driver samples here:
The KMDF Echo sample is located in the general folder.
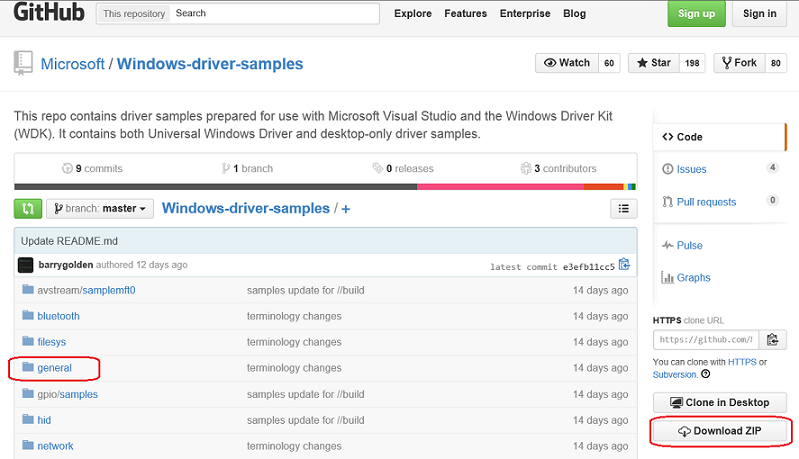
a. This lab, shows how to download the driver samples in one zip file.
b. Download the master.zip file to your local hard drive.
c. Select and hold (or right-click) Windows-driver-samples-master.zip, and choose Extract All. Specify a new folder, or browse to an existing one that will store the extracted files. For example, you could specify C:\DriverSamples\ as the new folder into which the files are extracted.
d. After the files are extracted, navigate to the following subfolder.
Open the driver solution in Visual Studio
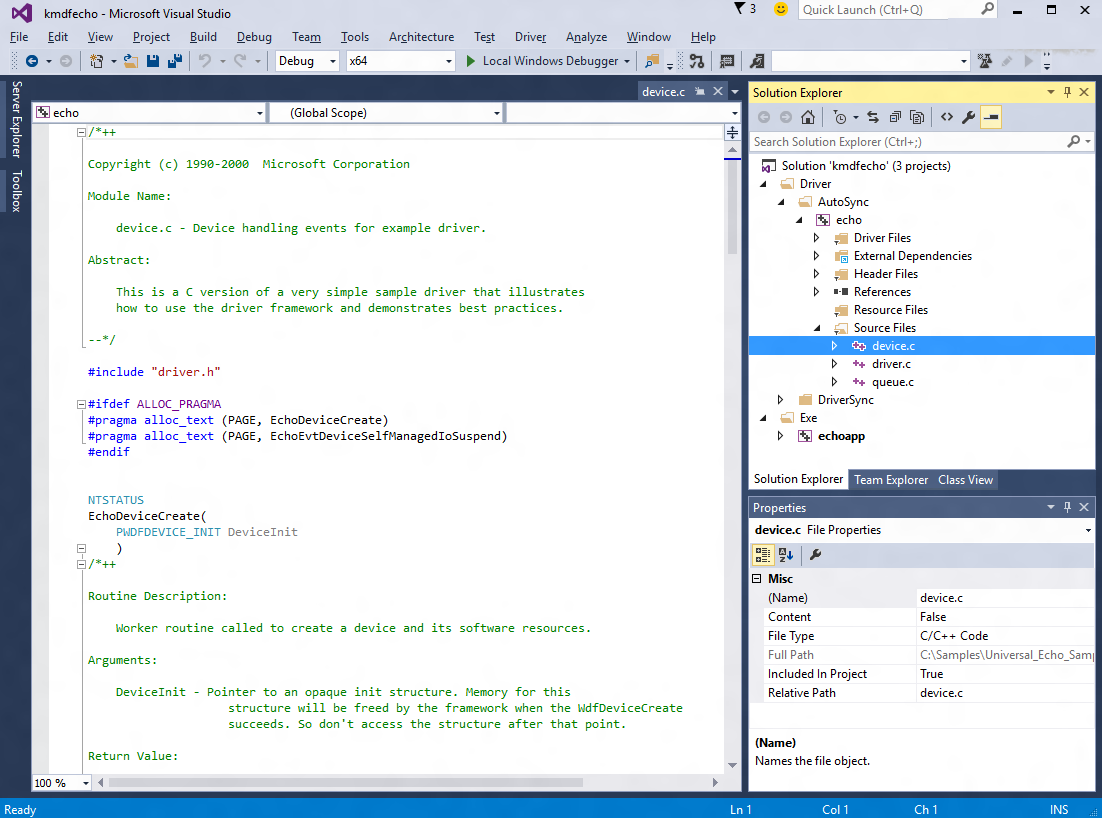
In Microsoft Visual Studio, select File > Open > Project/Solution. and navigate to the folder that contains the extracted files (for example, C:\DriverSamples\general\echo\kmdf). Double-click the kmdfecho solution file to open it.
In Visual Studio, locate the Solution Explorer. (If this is not already open, choose Solution Explorer from the View menu.) In Solution Explorer, you can see one solution that has three projects.
Set the sample’s configuration and platform
In Solution Explorer, select and hold (or right-click) Solution ‘kmdfecho’ (3 projects), and choose Configuration Manager. Make sure that the configuration and platform settings are the same for the three projects. By default, the configuration is set to «Win10 Debug», and the platform is set to «Win64» for all the projects. If you make any configuration and/or platform changes for one project, you must make the same changes for the remaining three projects.
Set the runtime library
Set the runtime library — Open the echo driver’s property page and locate C/C++ > Code Generation. Change Runtime Library from DLL version to non DLL version. Without this setting, you have to install the MSVC runtime to the target computer separately.

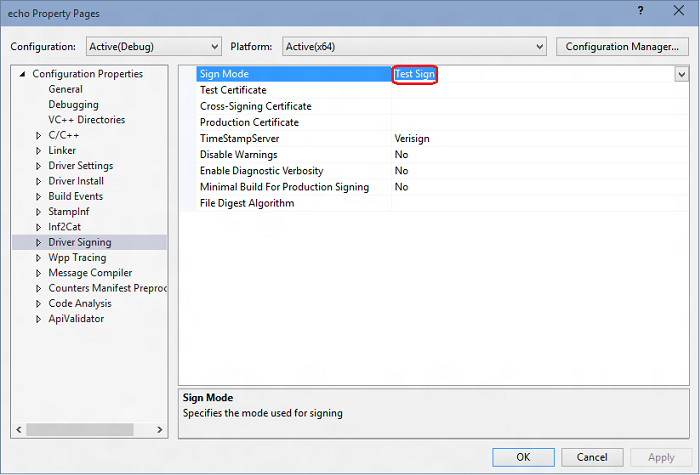
Check driver signing
Also on the driver’s properties make sure Driver Signing > Sign Mode is set to “Test Sign”. This is required because Windows requires that drivers are signed.
Build the sample using Visual Studio
In Visual Studio, select Build > Build Solution.
If all goes well, the build windows should display a message indicating that the build for all three projects succeeded.
Locate the built driver files
In File Explorer, navigate to the folder that contains the extracted files for the sample. For example, you would navigate to C:\DriverSamples\general\echo\kmdf, if that’s the folder you specified earlier. Within that folder, the location of the compiled driver files varies depending on the configuration and platform settings that you selected in the Configuration Manager. For example, if you left the default settings unchanged, then the compiled driver files will be saved to a folder named \x64\Debug for a 64 bit, debug build.
Navigate to the folder that contains the built files for the Autosync driver:
The folder should contain these files:
| File | Description |
|---|---|
| Echo.sys | The driver file. |
| Echo.inf | An information (INF) file that contains information needed to install the driver. |
In addition, the echoapp.exe file was built and it should be located here: C:\DriverSamples\general\echo\kmdf\exe\x64\Debug
| File | Description |
|---|---|
| EchoApp.exe | A command prompt executable test file that communicates with the echo.sys driver. |
Locate a USB thumb drive or set up a network share to copy the built driver files and the test EchoApp from the host to the target system.
In the next section, you will copy the code to the target system, and install and test the driver.
Section 4: Install the KMDF echo driver sample on the target system
In Section 4, you will use devcon to install the echo sample driver.
The computer where you install the driver is called the target computer or the test computer. Typically, this is a separate computer from the computer on which you develop and build the driver package. The computer where you develop and build the driver is called the host computer.
The process of moving the driver package to the target computer and installing the driver is called deploying the driver.
Before you deploy a test signed driver, you must prepare the target computer by enabling test signing. You also need to locate the DevCon tool in your WDK installation and copy that to the target system.
To install the driver on the target system, perform the following steps.
-> On the target system
Enable test signed drivers
Enable the ability to run test signed drivers:
a. Open Windows Settings.
b. In Update and Security, select Recovery.
c. Under Advanced startup, select Restart Now.
d. When the PC reboots, select Startup options. In Windows 10, select Troubleshoot > Advanced options > Startup Settings , then select Restart button.
e. Select Disable driver signature enforcement by pressing the F7 key.
f. Reboot the target computer.
On the target system
On the target computer, select and hold (or right-click) the certificate file, and select Install, then follow the prompts to install the test certificate.
If you need more detailed instructions for setting up the target computer, see Preparing a Computer for Manual Driver Deployment.
-> On the target system
Install the driver
The following instructions show you how to install and test the sample driver. Here’s the general syntax for the devcon tool that you will use to install the driver:
The INF file required for installing this driver is echo.inf. The inf file contains the hardware ID for installing the echo.sys. For the echo sample the hardware ID is root\ECHO.
On the target computer, open a Command Prompt window as Administrator. Navigate to your driver package folder, and enter the following command:
devcon install echo.inf root\ECHO If you get an error message about devcon not being recognized, try adding the path to the devcon tool. For example, if you copied it to a folder called C:\Tools, then try using the following command:
c:\tools\devcon install echo.inf root\ECHO A dialog box will appear indicating that the test driver is an unsigned driver. Select Install this driver anyway to proceed.

В If you have any issues with the installation, check the following file for more information. %windir%\inf\setupapi.dev.log
After successfully installing the sample driver, you’re now ready to test it.
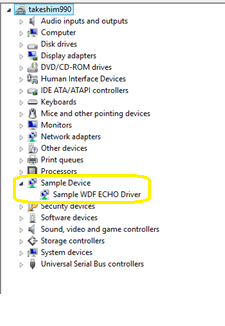
Examine the driver in Device Manager
On the target computer, in a Command Prompt window, enter devmgmt open Device Manager. In Device Manager, on the View menu, choose Devices by type. In the device tree, locate Sample WDF Echo Driver in the Sample Device node.
Test the driver
Type echoapp to start the test echo app to confirm that the driver is functional.
Section 5: Use WinDbg to display information about the driver
In Section 5, you will set the symbol path and use kernel debugger commands to display information about the KMDF echo sample driver.
View information about the driver by performing the following steps.
x ECHO!Echo* to display information about all of the symbols associated with echo driver that start with Echo.
The !lmi extension displays detailed information about a module. Type !lmi echo. Your output should be similar to the text shown below.
Use the !dh extension to display header information as shown below.
Setting the debug mask
Type the following to change the default debug bit mask so that all debug messages from the target system will be displayed in the debugger.
Some drivers will display additional information when the mask of 0xFFFFFFFF is used. Set the mask to 0x00000000 if you would like to reduce the amount of information that is displayed.
Use the dd command to display confirm the mask is set to display all of the debugger messages.
Section 6: Displaying Plug and Play device tree information
In Section 6, you will display information about the echo sample device driver and where it lives in the Plug and Play device tree.
Information about the device driver in the Plug and Play device tree can be useful for troubleshooting. For example, if a device driver is not resident in the device tree, there may an issue with the installation of the device driver.
For more information about the device node debug extension, see !devnode.
Section 7: Working with breakpoints and source code
In Section 7, you will set breakpoints and single step through kernel mode source code.
Note
Setting breakpoints using commands
To be able to step through code and check the values of variables in real time, we need to enable breakpoints and set a path to the source code.
Breakpoints are used to stop code execution at a particular line of code. You can then step forward in the code from that point, to debug that specific section of code.
To set a breakpoint using a debug command, use one of the following b commands.
Sets a breakpoint that will be active until the module it is in is unloaded.
Sets a breakpoint that is unresolved when the module is unloaded and re-enables when the module reloads.
Sets a breakpoint for a symbol. This command will use bu or bp appropriately and allows wildcards * to be used to set breakpoints on every symbols that matches (like all methods in a class).
For more information, see Source Code Debugging in WinDbg in the debugging reference documentation.
Source Mode is enabled in the current WinDbg session.
Add your local code location to the source path by typing the following command.
Add your local symbol location to the symbol path by typing the following command.
We will use the x command to examine the symbols associated with the echo driver to determine the function name to use for the breakpoint. We can use a wild card or Ctrl+F to locate the DeviceAdd function name.
The output above shows that DeviceAdd method for our echo driver is ECHO!EchoEvtDeviceAdd.
Alternatively, we could review the source code to locate the desired function name for our breakpoint.
Set the breakpoint with the bm command using the name of the driver, followed by the function name (for example AddDevice) where you want to set the breakpoint, separated by an exclamation mark. We will use AddDevice to watch the driver being loaded.
Note
You can use different syntax in conjunction with setting variables like ! , :: ,†:
’, or skip a number of times . For more information, see Conditional breakpoints in WinDbg and other Windows debuggers.
List the current breakpoints to confirm that the breakpoint was set by typing the bl command.
The «e» in the output shown above indicates that the breakpoint number 1 is enabled to fire.
Restart code execution on the target system by typing the go command g.
-> On the target system
In Windows, open Device Manager using the icon or by entering mmc devmgmt.msc. In Device Manager, expand the Samples node.
Select and hold (or right-click) the KMDF Echo driver entry and select Disable from the menu.
Select and hold (or right-click) the KMDF Echo driver entry again and select Enable from the menu.
Clears a breakpoint from the list. Use bc * to clear all breakpoints.
Disables a breakpoint. Use bd * to disable all breakpoints.
Enables a breakpoint. Use be * to enable all breakpoints.
Alternatively, you can also modify breakpoints by selecting edit > breakpoints in WinDbg. Note that the breakpoint dialog box only works with existing breakpoints. New breakpoints must be set from the command line.
Note
Setting memory access breakpoints
You can also set breakpoints that fire when a memory location is accessed. Use the ba (break on access) command, with the following syntax.
| Option | Description |
|---|---|