- Supported Ethernet NICs for Network Kernel Debugging in Windows 8.1
- System Requirements
- Finding the vendor ID and device ID
- Vendor ID 8086, Intel Corporation
- Vendor ID 10EC, Realtek Semiconductor Corp.
- Vendor ID 14E4, Broadcom
- Vendor ID 1969, Atheros Communications
- Vendor ID 19A2, ServerEngines (Emulex)
- Vendor ID 10DF, Emulex Corporation
- Vendor ID 15B3, Mellanox Technology
- Setting Up Kernel-Mode Debugging over a Serial Cable Manually
- Setting Up the Target Computer
- Starting the Debugging Session
- Using WinDbg
- Using KD
- Using Environment Variables
- Troubleshooting Tips for Debugging over a Serial Cable
- Specify correct COM port on both host and target
- Baud rate must be the same on host and target
- Null Modem Cable Wiring
- 9-pin connector
- 25-pin connector
- Signal Abbreviations
- Additional Information
- Setting Up KDNET Network Kernel Debugging Automatically
- Determining the IP Address of the Host Computer
- Setting Up the Host and Target Computers
- Connecting WinDbg to the target for kernel debugging
- Restarting the Target PC
- Troubleshooting Tips
- Enable additional debugging types
- Example usage
- Summary of debugging type options
- Specify bus parameters
Supported Ethernet NICs for Network Kernel Debugging in Windows 8.1
You can do kernel debugging over an Ethernet network cable when the target computer is running Windows 8.1. The target computer must have a supported network interface card (NIC) or network adapter.
During kernel debugging, the computer that runs the debugger is called the host computer, and the computer being debugged is called the target computer. For more information, see Setting Up KDNET Network Kernel Debugging Automatically.
To do kernel debugging over a network cable, the target computer must have a supported network adapter. When the target computer is running Windows 8.1, the network adapters listed here are supported for kernel debugging.
NoteВ В Support for kernel debugging over selected 10 gigabit network adapters is a new feature in WindowsВ 8.1. Debugging over 10 gigabit network adapters is not supported in WindowsВ 8. For a list of network adapters supported by WindowsВ 8 for kernel debugging, see Supported Ethernet NICs for Network Kernel Debugging in WindowsВ 8.
System Requirements
Kernel debugging through Ethernet NICs requires certain low-level platform support. Windows requires that these NICs be attached via PCI/PCIe for this debugging solution. In most cases, simply plugging in one of these supported NICs will allow a robust kernel debugging experience. However, there may be cases where BIOS configuration details hinder the Windows debug path. The following platform requirement should be considered:
- System firmware should discover and configure the NIC device such that its resources do not conflict with any other devices that have been BIOS-configured.
Finding the vendor ID and device ID
First find the vendor ID and device ID of the network adapter on your target computer.
- On the target computer, open Device Manager (enter devmgmt in a Command Prompt window).
- In Device Manager, locate the network adapter that you want to use for debugging.
- Select and hold (or right-click) the network adapter node, and choose Properties.
- In the Details tab, under Property, select Hardware Ids.
The vendor and device IDs are shown as VEN_VendorID and DEV_DeviceID. For example, if you see PCI\VEN_8086&DEV_104B, the vendor ID is 8086, and the device ID is 104B.
Vendor ID 8086, Intel Corporation
For vendor ID 8086, these device IDs are supported:
0438 043A 043C 0440 1000 1001 1004 1008 1009 100C 100D 100E 100F 1010 1011 1012 1013 1014 1015 1016 1017 1018 1019 101A 101D 101E 1026 1027 1028 1049 104A 104B 104C 104D 105E 105F 1060 1075 1076 1077 1078 1079 107A 107B 107C 107D 107E 107F 108A 108B 108C 1096 1098 1099 109A 10A4 10A5 10A7 10A9 10B5 10B9 10BA 10BB 10BC 10BD 10BF 10C0 10C2 10C3 10C4 10C5 10C6 10C7 10C8 10C9 10CB 10CC 10CD 10CE 10D3 10D5 10D6 10D9 10DA 10DB 10DD 10DE 10DF 10E1 10E5 10E6 10E7 10E8 10EA 10EB 10EC 10EF 10F0 10F1 10F4 10F5 10F6 10F7 10F8 10F9 10FA 10FB 10FC 1501 1502 1503 1507 150A 150B 150C 150D 150E 150F 1510 1511 1514 1516 1517 1518 151C 1521 1522 1523 1524 1525 1526 1527 1528 1529 152A 1533 1534 1535 1536 1537 1538 1539 153A 153B 1546 154A 154D 1557 1558 1559 155A 1560 157B 157C 1F40 1F41 1F45 294C
Vendor ID 10EC, Realtek Semiconductor Corp.
For vendor ID 10EC, these device IDs are supported:
8136 8137 8167 8168 8169
Vendor ID 14E4, Broadcom
For vendor ID 14E4, these device IDs are supported:
1600 1601 1639 163A 163B 163C 1644 1645 1646 1647 1648 164A 164C 164D 1653 1654 1655 1656 1657 1658 1659 165A 165B 165C 165D 165E 165F 1668 1669 166A 166B 166D 166E 1672 1673 1674 1676 1677 1678 1679 167A 167B 167C 167D 167F 1680 1681 1684 1688 1690 1691 1692 1693 1694 1696 1698 1699 169A 169B 169D 16A0 16A6 16A7 16A8 16AA 16AC 16B0 16B1 16B2 16B4 16B5 16B6 16C6 16C7 16DD 16F7 16FD 16FE 16FF 170D 170E 170F
Vendor ID 1969, Atheros Communications
For vendor ID 1969, these device IDs are supported:
1062 1063 1073 1083 1090 1091 10A0 10A1 10B0 10B1 10C0 10C1 10D0 10D1 10E0 10E1 10F0 10F1 2060 2062 E091 E0A1 E0B1 E0C1 E0D1 E0E1 E0F1
Vendor ID 19A2, ServerEngines (Emulex)
For vendor ID 19A2, these device IDs are supported:
0211 0215 0221 0700 0710
Vendor ID 10DF, Emulex Corporation
For vendor ID 10DF, these device IDs are supported:
Vendor ID 15B3, Mellanox Technology
For vendor ID 15B3, these device IDs are supported:
1000 1001 1002 1003 1004 1005 1006 1007 1008 1009 100A 100B 100C 100D 100E 100F 1010 6340 6341 634A 634B 6354 6368 6369 6372 6732 6733 673C 673D 6746 6750 6751 675A 6764 6765 676E 6778
Setting Up Kernel-Mode Debugging over a Serial Cable Manually
Debugging Tools for Windows supports kernel debugging over a null-modem cable. Null-modem cables are serial cables that have been configured to send data between two serial ports. Do not confuse null-modem cables with standard serial cables. Standard serial cables do not connect serial ports to each other. For information about how null-modem cables are wired, see Null-Modem Cable Wiring.
The computer that runs the debugger is called the host computer, and the computer being debugged is called the target computer.
Setting Up the Target Computer
Before using bcdedit to change boot information you may need to temporarily suspend Windows security features such as BitLocker and Secure Boot on the test PC. You can re-enable Secure Boot once you’re done debugging and you’ve disabled kernel debugging.
On the target computer, open a Command Prompt window as Administrator, and enter the following commands, where n is the number of the COM port used for debugging on the target computer, and rate is the baud rate used for debugging:
bcdedit /debug on
bcdedit /dbgsettings serial debugport:n baudrate:rate
Note The baud rate must be the same on the host computer and target computer. The recommended rate is 115200.
Reboot the target computer.
Starting the Debugging Session
Connect the null-modem cable to the COM ports that you have chosen for debugging on the host and target computers.
Using WinDbg
On the host computer, open WinDbg. On the File menu, choose Kernel Debug. In the Kernel Debugging dialog box, open the COM tab. In the Baud rate box, enter the rate you have chosen for debugging. In the Port box, enter COMn where n is the COM port number you have chosen for debugging on the host computer. Select OK.
You can also start a session with WinDbg by entering the following command in a Command Prompt window; n is the number of the COM port used for debugging on the host computer, and rate is the baud rate used for debugging:
windbg -k com:port=COMn,baud=rate
Using KD
On the host computer, open a Command Prompt window, and enter the following command, where n is the number of the COM port used for debugging on the host computer, and rate is the baud rate used for debugging:
kd -k com:port=COMn,baud=rate
Using Environment Variables
On the host computer, you can use environment variables to specify the COM port and the baud rate. Then you do not have to specify the port and baud rate each time you start a debugging session. To use environment variables to specify the COM port and baud rate, open a Command Prompt window and enter the following commands, where n is the number of the COM port used for debugging on the host computer, and rate is the baud rate used for debugging:
- set _NT_DEBUG_PORT=COMn
- set _NT_DEBUG_BAUD_RATE=rate
To start a debugging session, open a Command Prompt window, and enter one of the following commands:
- kd
- windbg
Troubleshooting Tips for Debugging over a Serial Cable
Specify correct COM port on both host and target
Determine the numbers of the COM ports you are using for debugging on the host and target computers. For example, suppose you have your null-modem cable connected to COM1 on the host computer and COM2 on the target computer.
On the target computer, open a Command Prompt window as Administrator, and enter bcdedit /dbgsettings. If you are using COM2 on the target computer, the output of bcdedit should show debugport 2 .
On the host computer, specify the correct COM port when you start the debugger or when you set environment variables. If you are using COM1 on the host computer, use one of the following methods to specify the COM port.
- In WinDbg, in the Kernel Debugging dialog box, enter COM1 in the Port box.
- windbg -k com:port=COM1, .
- kd -k com:port=COM1, .
- set _NT_DEBUG_PORT=COM1
Baud rate must be the same on host and target
The baud rate used for debugging over a serial cable must be set to the same value on the host and target computers. For example, suppose you have chosen a baud rate of 115200.
On the target computer, open a Command Prompt window as Administrator, and enter bcdedit /dbgsettings. The output of bcdedit should show baudrate 115200 .
On the host computer, specify the correct baud rate when you start the debugger or when you set environment variables. Use one of the following methods to specify a baud rate of 115200.
- In WinDbg, in the Kernel Debugging dialog box, enter 115200 in the Baud rate box.
- windbg -k . baud=115200
- kd -k . baud=115200
- set _NT_DEBUG_BAUD_RATE=115200
Null Modem Cable Wiring
The following tables show how null-modem cables are wired.
9-pin connector
| Connector 1 | Connector 2 | Signals |
|---|---|---|
| 2 | 3 | Tx — Rx |
| 3 | 2 | Rx — Tx |
| 7 | 8 | RTS — CTS |
| 8 | 7 | CTS — RTS |
| 4 | 1+6 | DTR — (CD+DSR) |
| 1+6 | 4 | (CD+DSR) — DTR |
| 5 | 5 | Signal ground |
25-pin connector
| Connector 1 | Connector 2 | Signals |
|---|---|---|
| 2 | 3 | Tx — Rx |
| 3 | 2 | Rx — Tx |
| 4 | 5 | RTS — CTS |
| 5 | 4 | CTS — RTS |
| 6 | 20 | DSR — DTR |
| 20 | 6 | DTR — DSR |
| 7 | 7 | Signal ground |
Signal Abbreviations
| Abbreviation | Signal |
|---|---|
| Tx | Transmit data |
| Rx | Receive data |
| RTS | Request to send |
| CTS | Clear to send |
| DTR | Data terminal ready |
| DSR | Data set ready |
| CD | Carrier detect |
Additional Information
For complete documentation of the bcdedit command, see BCDEdit Options Reference.
Setting Up KDNET Network Kernel Debugging Automatically
Debugging Tools for Windows supports kernel debugging over a network. This topic describes how to set up network debugging automatically using the kdnet.exe setup tool.
The computer that runs the debugger is called the host computer, and the computer being debugged is called the target computer. The host computer must be running Windows 7 or later, and the target computer must be running WindowsВ 8 or later.
Determining the IP Address of the Host Computer
Confirm that the target and host PCs are connected to a network hub or switch using an appropriate network cable.
On the host computer, open a Command Prompt window and enter IPConfig to display the IP configuration.
In the command output, locate the IPv4 address of the Ethernet adapter.
4.Make a note of the IPv4 address of the network adapter that you intend to use for debugging.
Setting Up the Host and Target Computers
Use the kdnet.exe utility to automatically configure the debugger settings on the target PC, by following these steps.
Confirm that the Windows Debugging Tools are installed on the host system. For information on downloading and installing the debugger tools, see Download Debugging Tools for Windows.
Locate the kdnet.exe and VerifiedNICList.xml files. By default, they are located here.
These directions assumes that both PCs are running a 64 bit version of Windows on both the target and host. If that is not the case, the best approach is to run the same «bitness» of tools on the host that the target is running. For example, if the target is running 32-bit Windows, run a 32 version of the debugger on the host. For more information, see Choosing the 32-Bit or 64-Bit Debugging Tools.
On the host computer, copy the two files to a network share or thumb drive, so that they will be available on the target computer.
On the target computer, create a C:\KDNET directory and copy the kdnet.exe and VerifiedNICList.xml files to that directory.
Before using kdnet.exe to change boot information you may need to temporarily suspend Windows security features such as BitLocker and Secure Boot on the test PC. Re-enable these security features when testing is complete and appropriately manage the test PC, when the security features are disabled.
On the target computer, open a Command Prompt window as Administrator. Enter this command to verify that the target computer has a supported network adapter.
As the output from kdnet.exe indicates that network adapter on the target is supported, we can proceed.
Type this command to set the IP address of the host system and generated a unique connection key. Use the IP address or the name of the host system. Pick a unique port address for each target/host pair that you work with, within the recommended range of 50000-50039.
Copy the returned key into a notepad .txt file.
Connecting WinDbg to the target for kernel debugging
On the host computer, open WinDbg. On the File menu, choose Kernel Debug. In the Kernel Debugging dialog box, open the Net tab. Paste in your port number and key that you saved to in the notepad .txt file earlier. Select OK.
You can also start a WinDbg session by opening a Command Prompt window and entering the following command, where is the port you selected above, and is the key that was returned by kdnet.exe above. Paste in the key in that you saved to in the notepad .txt file earlier.
The optional -d parameter shown in the example, enables early break in. For more information, see WinDbg Command-Line Options.
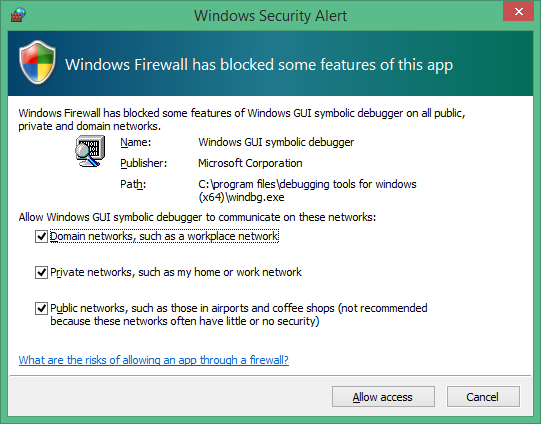
If you are prompted about allowing WinDbg to access the port through the firewall, allow WinDbg to access the port for all three of the different network types.
At this point the debugger will be waiting for the target to reconnect and text similar to the following will be displayed in the debugger command window.
Restarting the Target PC
Once the debugger is at the «Waiting to reconnect. » stage, reboot the target computer. One way to do restart the PC, is to use this command from an administrator’s command prompt.
After the target PC restarts, the debugger should connect automatically.
Troubleshooting Tips
Debugging application must be allowed through firewall
The debugger must have access through the firewall. Use Control Panel to allow access through the firewall.
Open Control Panel > System and Security and select Allow an app through Windows Firewall.
In the list of applications, locate Windows GUI Symbolic Debugger and Windows Kernel Debugger.
Use the check boxes to allow those two applications all three of the different network types through the firewall.
Scroll down and select OK, to save the firewall changes. Restart the debugger.

Use Ping to test connectivity
If the debugger times out and does not connect, use the ping command on the target PC to verify connectivity.
Choosing a Port for Network Debugging
If the debugger times out and does not connect, it could be because the default port number of 50000 is already in use or it is blocked.
You can choose any port number from 49152 through 65535. The recommended range is between 50000 and 50039. The port that you choose will be opened for exclusive access by the debugger running on the host computer.
NoteВ В The range of port numbers that can be used for network debugging might be limited by your company’s network policy. To determine whether your company’s policy limits the range of ports that can be used for network debugging, check with your network administrators.
Supported Network Adapters
If «Network debugging is not supported on any of the NICs in this machine» is displayed when you run kdnet.exe, it means that the network adapter is not supported.
The host computer can use any network adapter, but the target computer must use a network adapter that is supported by Debugging Tools for Windows. For a list of supported network adapters, see Supported Ethernet NICs for Network Kernel Debugging in WindowsВ 10 and Supported Ethernet NICs for Network Kernel Debugging in WindowsВ 8.1.
Enable additional debugging types
Begining with Windows 10 October 2020 Update (20H2), the following options are supported to enable four types of debugging.
b — enables bootmgr debugging. For more information see BCDEdit /bootdebug.
w — enables winload debugging. For more information see BCDEdit /bootdebug.
h — enables hypervisor debugging. For more information see BCDEdit /hypervisorsettings.
k — enables kernel debugging. For more information see Getting Started with WinDbg (Kernel-Mode).
Any combination of debug types may be specified.
If no debug types are specified then kernel debugging will be enabled.
If both hypervisor and kernel debug are enabled the hypervisor port will be set to the value port+1.
Example usage
Use the — bkw option to enable bootmgr, kernel and winload debugging.
Summary of debugging type options
| KNDET Option | Description | Equivalent set command |
|---|---|---|
| b | enables bootmgr debugging | bcdedit /bootdebug |
| h | enables hypervisor debugging | bcdedit /set hypervisordebug on |
| k | enables kernel debugging | bcdedit /debug on |
| w | enables winload debugging | bcdedit /bootdebug on |
Specify bus parameters
If kdnet is not able to automatically determine the bus parameters for your transport, specify them on the command line with /busparams option using this syntax.
kdnet.exe /busparams [b.d.f] [host] [port] [-[b][h][k][w]]
[b.d.f] specifies the bus parameters of the device to configure.
Use Device Manager on the target computer to determine the PCI bus, device, and function numbers for the adapter you want to use for debugging. For bus parameters, enter b.d.f where b, d, and f are the bus number, device number, and function number of the adapter. These values are displayed in Device Manager under Location on the General tab.


