- Монитор стабильности системы в Windows 10 ? Как использовать ?
- Монитор стабильности системы Windows 10
- Что такое монитор стабильности системы
- Как проверить компьютер через монитор стабильности системы
- Как создать отчет по стабильности системы Windows
- Troubleshooting Windows 10 with Reliability Monitor
- Built into Windows 10, this old-school tool is great at diagnosing crashes, hangs and other issues.
- Launching Reliability Monitor
- How to view reliability history on Windows 10
- How to use reliability history to fix problems on Windows 10?
- How to – Check reliability history on Windows 10
- Run a System Scan to discover potential errors
Монитор стабильности системы в Windows 10 ? Как использовать ?
Монитор стабильности системы позволяет оценивать бесперебойность и корректность работы Windows, просматривать отчеты о событиях и проблемах. Опытные пользователи смогут определить конкретные дефекты в работе устройства, сравнивать их периодичность возникновения.
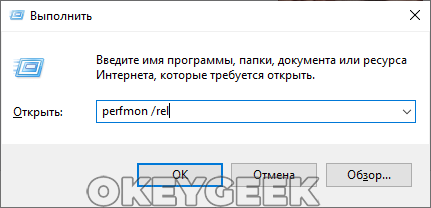
Монитор стабильности системы можно открыть через настройки по пути: Панель управления\Система и безопасность\Центр безопасности и обслуживания\Монитор стабильности системы. Но многие предпочитают создать ярлык для быстрого доступа: на рабочем столе кликнуть правой кнопкой мыши и в контекстном меню выбрать «Создать ярлык». В месте расположения нужно указать Perfmon /rel и нажать Далее, а имя ярлыку можете дать любое удобное вам. По завершению процедуры вы получите ярлык с доступом сразу к диалоговому окну монитора.
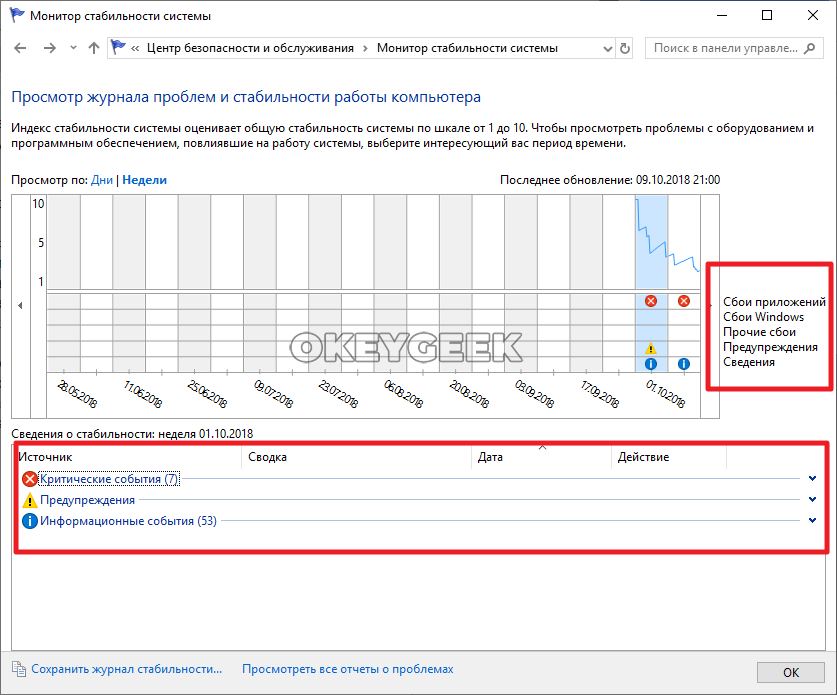
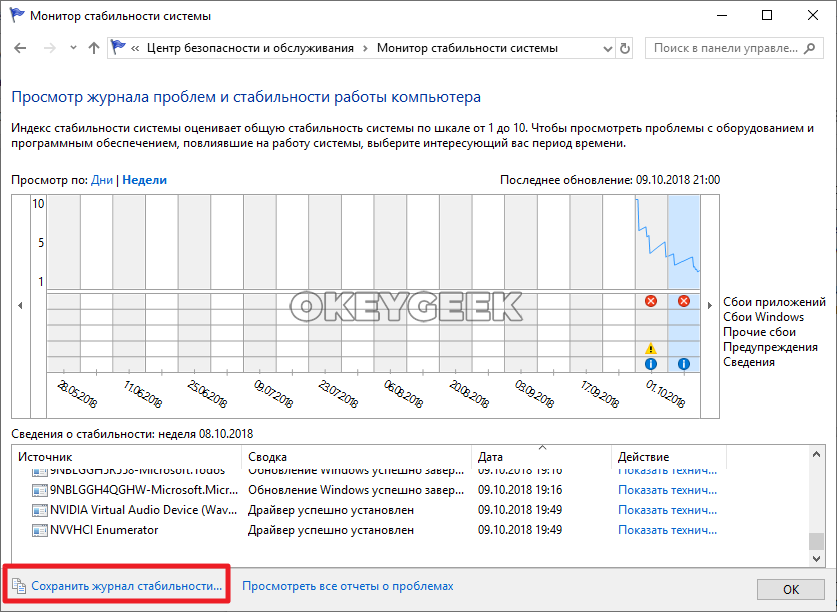
В открытом окне сразу же можно увидеть график стабильности, построенной из оценки работы системы от 1 до 10, где 1 – критическое состояние системы, а 10 – всё работает на отлично. В этом графике будут отметки с ошибками или действиями, которые повлияли на стабильность работы, а значит и на снижение оценки. Если нажать на эти отметки, появится краткий отчёт об источнике ошибки и описание проблемы. Далее можно будет запросить технические подробности или сохранить журнал за указанный период времени.
Монитор стабильности системы Windows 10

Своевременная диагностика компонентов компьютера — залог их продолжительной работы. Опытный пользователь компьютера знает признаки, по которым можно определить скорый выход из строя жесткого диска, оперативной памяти и других элементов системного блока. Но перед тем как приступать к замене того или иного “железного” компонента в компьютере, нужно убедиться, что проблема именно в нем. В Windows 10 имеется специальный инструмент — “Монитор стабильности системы”, который позволяет проверить компьютер на наличие проблем.
Что такое монитор стабильности системы
В Windows много системных утилит, которые скрыты от большинства пользователей, поскольку находятся достаточно далеко в настройках. Но некоторые из таких программ могут оказаться полезны, как и утилита для монитора стабильности системы.
Данное приложение позволяет пользователю посмотреть, какие конкретно дефекты имеются в работе компьютера, а также, с какой периодичностью возникают сбои и ошибки. Монитор стабильности системы ведет статистику работы компьютера, тем самым позволяя пользователю наглядно увидеть, какие действия предшествовали возникновению ошибки.
Как проверить компьютер через монитор стабильности системы
Чтобы приступить к проверке компьютера через монитор стабильности системы, нужно сначала открыть эту утилиту. Это можно сделать двумя способами:
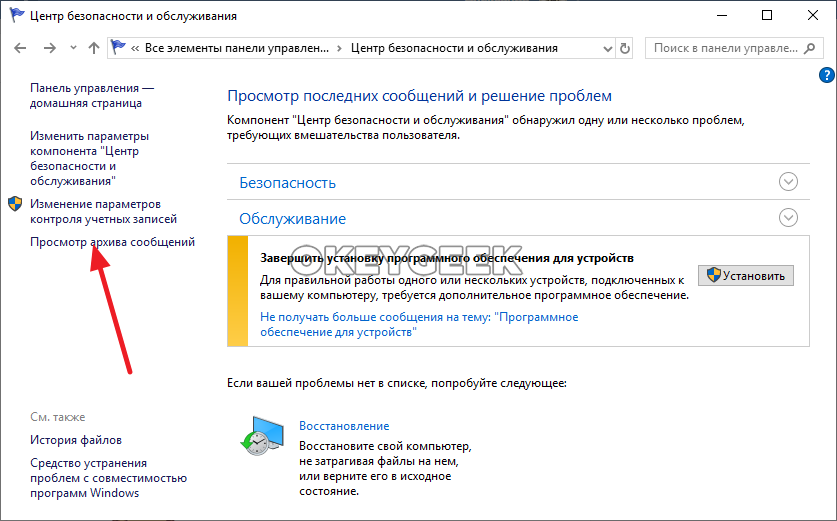
- Запустить “Панель управления”, после чего перейти в раздел “Центр безопасности и обслуживания”. Далее в левой части открывшегося окна выберите “Просмотр архива сообщений”, и вы окажетесь в утилите для проверки стабильности системы;
Открыв монитор стабильности системы, остается изучить данные, которые он дает, чтобы понять потенциальную причину проблемы. В нижней части окна отображаются источники событий, которые выведены на графике. Монитор разделяет их на 5 видов событий: сбои приложений, сбои Windows, прочие сбои, предупреждения и сведения. В зависимости от того, какие виды событий происходили, части из них может не быть в нижней части окна утилиты.
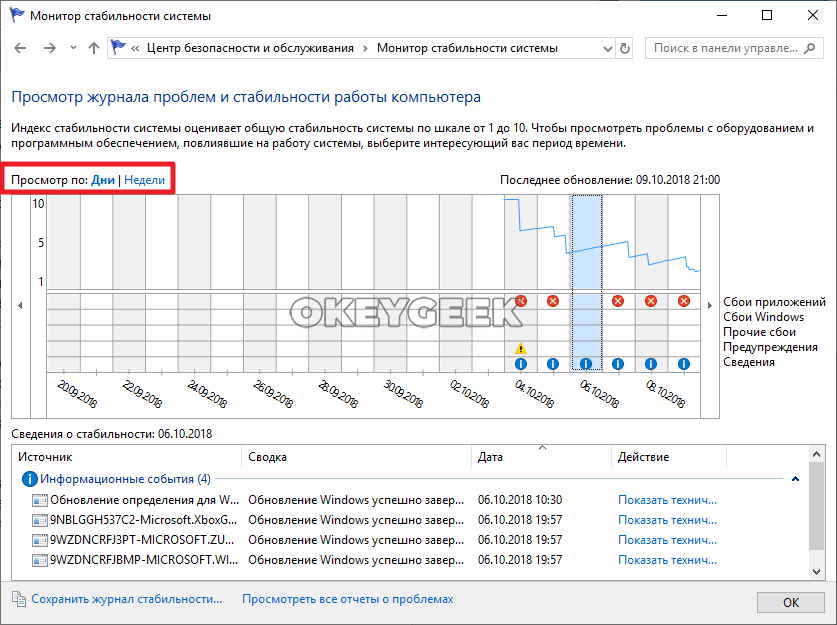
В верхней части приложения можно выбрать способ отображения информации за период — день или неделя. Выбирая временной промежуток и нажимая на него, можно в нижней части окна наблюдать за событиями, которые произошли именно в этот промежуток времени.
На таймлайне монитора стабильности сверху отображается синяя полоса. Она указывает, насколько стабильно работает Windows и приложения на компьютере. В зависимости от количества произошедших негативных событий, каждый день записи в мониторе стабильности полоса занимает положение по шкале от 1 до 10. Чем менее стабильно работает система по мнению утилиты, тем меньше бал она выставляет компьютеру в тот или иной отчетный период.

Чтобы определить причину ошибки, отображенной в журнале стабильности в тот или иной день, можно посмотреть, что именно с компьютером происходило, как в этот день, так и в дни ранее. Например, на таймлайне может быть отображено, что в один из дней пользователь установил драйвера для определенного устройства, после чего появились ошибки в работе связанного с ним приложения. Это указывает на необходимость обновить драйвер или откатить его к прошлой версии. Подобным образом можно диагностировать, кроме прочего, стабильность работы ключевых компонентов системы, например, видеокарты, драйвера которой зачастую обновляются в фоновом режиме, и пользователь может не подозревать, что из-за новой версии ПО устройство стало нестабильно работать.
Как создать отчет по стабильности системы Windows
Если у пользователя имеются проблемы с компьютером, зачастую он обращается на форумы, где знающие люди могут подсказать о наличии тех или иных проблем. Часто специалисты просят предоставить отчет стабильности системы, который можно сделать при помощи рассматриваемой в рамках данной статьи утилиты.
Чтобы сохранить отчет, достаточно в нижней части окна монитора стабильности системы нажать на “Сохранить журнал стабильности”, после чего выбрать папку для сохранения файла.
Журнал стабильности представляет собой .xml файл, который можно просмотреть через различные текстовые редакторы (например, блокнот) или через Excel. В журнале стабильности хранится информация обо всех ошибках за отчетный период, а также о рейтинге работы операционной системы по шкале Microsoft.
Troubleshooting Windows 10 with Reliability Monitor
Built into Windows 10, this old-school tool is great at diagnosing crashes, hangs and other issues.


The built-in Windows 10 Reliability Monitor is an often-overlooked troubleshooting gem. It’s actually a specialized subset of Windows’ longstanding general-purpose Performance Monitor tool (perfmon.exe). But because Reliability Monitor zeros in and tracks a limited set of errors and changes on Windows desktops, it offers immediate value and diagnostic information to administrators and power users trying to puzzle their way through crashes, failures, hiccups and more.
Launching Reliability Monitor
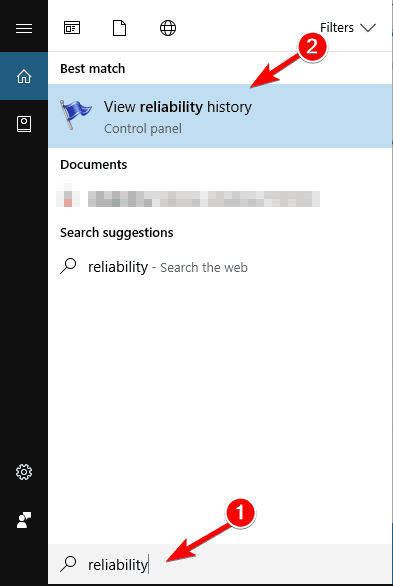
There are many ways to get to Reliability Monitor in Windows 10. At the search box, if you type reli you’ll usually see an entry that reads “View reliability history” pop up in response. Clicking that will open up the Reliability Monitor window. You can also click the Start button and then the Settings icon and search for reli to get the same menu option, as shown in Figure 1.
Figure 1: Type “reli” into the Start Menu, and you’ll see “View reliability history” straightaway. (Click any image in this story to enlarge it.)
If you want to navigate to where this item resides in the Control Panel hierarchy, here’s the sequence of selections involved: Start > Control Panel > Security and Maintenance > View reliability history (under the Maintenance heading).
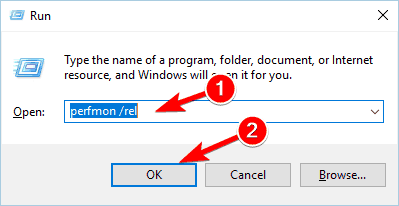
My personal favorite way to launch Reliability Monitor, after occasional struggles with Windows Search, is to type perfmon /rel into the search box or the command line.
To continue reading this article register now
How to view reliability history on Windows 10

- Download Restoro PC Repair Tool that comes with Patented Technologies (patent available here).
- Click Start Scan to find Windows issues that could be causing PC problems.
- Click Repair All to fix issues affecting your computer’s security and performance
- Restoro has been downloaded by 0 readers this month.
Computer issues will occur sooner or later on your PC. Fixing those problems isn’t always a simple task, but there’s one Windows tool that can help you.
If you want to check reliability history on Windows 10, today we’re going to show you how to use Reliability Monitor.
How to use reliability history to fix problems on Windows 10?
How to – Check reliability history on Windows 10
Windows 10 has a useful feature called Reliability Monitor. In fact, Reliability Monitor was part of Windows since Windows Vista, so it’s not an exclusive Windows 10 feature.
The application uses a simple interface, so you can easily find a specific error. Since Reliability Monitor allows you to view reliability history, the tool is perfect for troubleshooting any issue.
Windows 10 keeps track of errors and system failures, and thanks to this feature, you can easily learn more about specific errors that occurred in the past.
Reliability Monitor is similar to Event Viewer, but unlike Event Viewer, it offers a friendly interface and it allows you to find specific errors easier. Since this tool is simple to use, today we’re going to show you how to use it to troubleshoot problems on Windows 10.
Checking reliability history on Windows 10 is rather simple, and in order to do it, you need to follow these steps:
- Press Windows Key + S and enter reliability.
- Select View reliability history from the menu.
 You can also start Reliability Monitor by using Run dialog. To do that, follow these steps:
 You can also start Reliability Monitor by using Run dialog. To do that, follow these steps:
- Press Windows Key + R to open the Run dialog.
- When the Run dialog opens, enter perfmon /rel and press Enter or click OK.
- READ ALSO: Fix: “Diagnostics troubleshooting wizard has stopped working” on Windows 10
Lastly, you can start Reliability Monitor simply by navigating to the Control Panel. To do that, do the following:
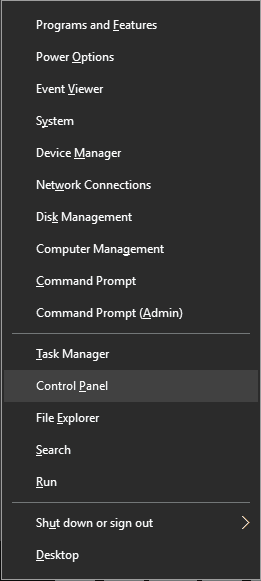
- Press Windows Key + X to open Win + X menu. Choose Control Panel from the list of options.
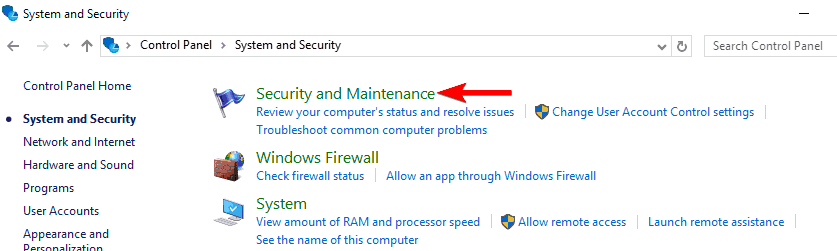
- When the Control Panel opens, navigate to the System and Security section.
- Now navigate to the Security and Maintenance.
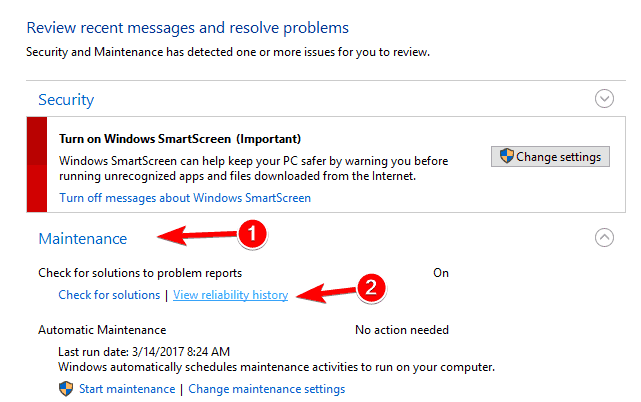
- When the Security and Maintenance window opens, expand the Maintenance section. Now click on View reliability history.

Reliability Monitor has a simple interface, so even the basic users should be able to use it. The main window will show you a graph that represents your system’s stability.
Stability is represented by a number ranging from 1 to 10. If you don’t experience any errors or crashes in a few days, your stability graph will gradually increase.
Even if your stability index is somewhat low, it doesn’t mean that you have any major problem with your PC. Stability index will change whenever you encounter an error or even if a certain application crashes.
Bellow the graph you can see a number of icons that represent certain events. The red X icon appears if you encounter a critical event. The critical event usually means that certain application crashed or stopped responding.
There are also warnings represented by a yellow triangle. These warnings appear due to unsuccessful application removal or installation.
Run a System Scan to discover potential errors


Lastly, there are information icons available. These icons appear if you install an update, application or a driver successfully.
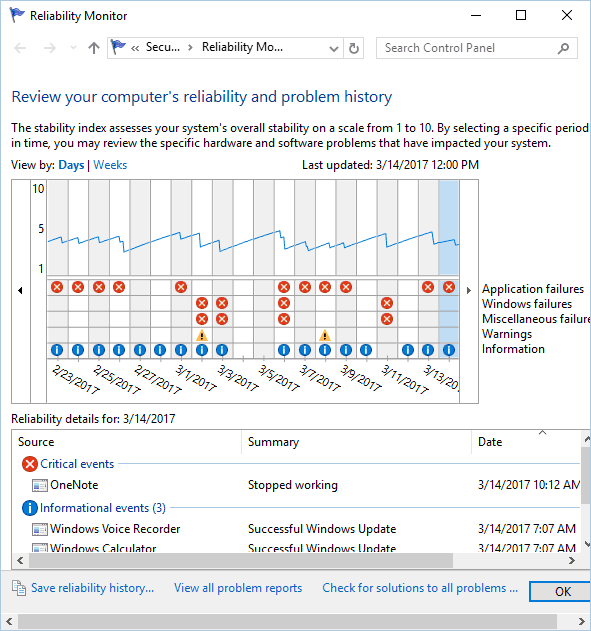 Reliability Monitor also offers detailed information for each day. Simply select a specific day on the chart and you’ll see a detailed report at the bottom.
From there you can see which application caused a warning or a critical event to appear. In addition, you can also see the type of critical event or warning.
Lastly, you’ll see the exact time and date when a specific issue occurred, which makes it easier for you to troubleshoot a problem.
Of course, you can click each warning or critical event to see extra information about it. You can see the exact location of the application, as well as the error code for certain problems.
This can be rather useful if you want to troubleshoot and solve the issue on your own. The application also allows you to see all reports in a single list. By using this feature, all your errors will be sorted by application.
This lets you see easily how many errors or crashes a specific application had. In addition, this also allows you to easily find the most unstable and problematic applications on your PC.
We also have to mention that Reliability Monitor allows you to save reliability history in XML format. Although XML report lacks advanced information, it’s quite useful if you want to quickly view a summary of your reliability history.
The application also has an option that allows you to check for solutions to all problems. This might help with some problems, but if you’re having issues with third-party applications, you’ll have to fix them manually.
You can also right-click any warning and choose Check for a solution option. However, it most cases the issue won’t be fixed automatically.
Many advanced users are probably familiar with the Event Viewer. This is a powerful tool that can detect every event, warning or error. Reliability Monitor uses the information from the Event Viewer, but it displays it in a user-friendly manner.
If you’re having any issues with your PC, we advise you to check your reliability history by using this tool.


