- Tracking and Analyzing Remote Desktop Activity Logs in Windows
- How to enable logging in WDS in Windows
- Introduction
- Overview
- General WDS server health
- WDS server component
- Obtain trace logs for Windows Server
- WDS management components
- Enable tracing
- For the management component
- For the MMC component
- WDS legacy components
- WDS client components
- Setup logs from the client computer
Tracking and Analyzing Remote Desktop Activity Logs in Windows
In this article we’ll consider the features of auditing and analyzing RDP connection logs in Windows. As a rule, the described methods may be useful when investigating RDP-related activity on RDS (terminal) Windows servers in forensics tasks, when a system administrator must provide the information about what users logged on to the RDS server, when a specific RDP user authenticated and ended up the session, which device (a name or IP address) an user connected from. I think this information will be useful both for the administrators of corporate RDS farms and for owners of a separate RDP servers what are published in the Internet (Windows VPS are still quite popular).
You can check the RDP connection logs using Windows Event Viewer ( eventvwr.msc ). Windows logs contain a lot of data, and it is quite difficult to find the event you need. When a user remotely connects to the remote desktop of RDS (RDP), a whole number of events appears in the Windows Event Viewer. There are several different logs where you can find the information about Remote Desktop connections. We’ll look at the logs and events on the main stages of an RDP connection that may be of interest to the administrator:
- Network Connection;
- Authentication;
- Logon;
- Session Disconnect/Reconnect;
- Logoff.
Network Connection is the establishment of a network connection to a server from a user RDP client. It is the event with the EventID 1149 ( Remote Desktop Services: User authentication succeeded ). If this event is found, it doesn’t mean that user authentication has been successful. This log is located in “Applications and Services Logs -> Microsoft -> Windows -> Terminal-Services-RemoteConnectionManager > Operational”. Enable the log filter for this event (right-click the log -> Filter Current Log -> EventId 1149).
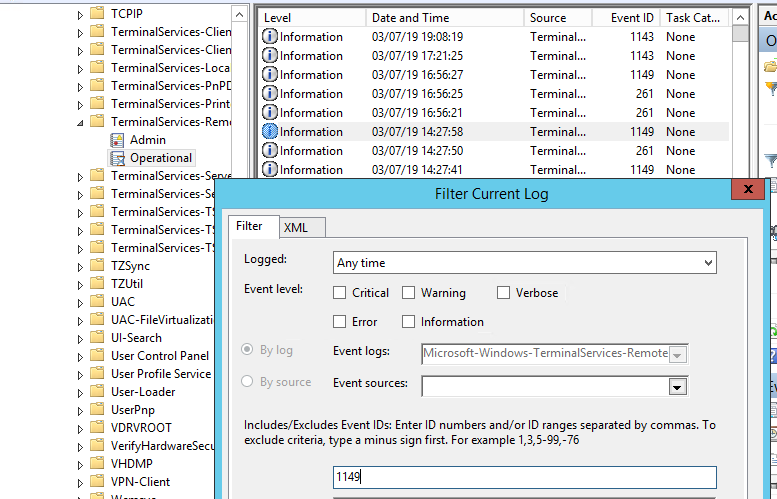
Then you will get an event list with the history of all RDP connections to this server. As you can see, the logs provide a username, a domain (in this case the Network Level Authentication is used; if NLA is disabled, the event text looks differently) and the IP address of the computer, from which the RDP connection has been initiated.

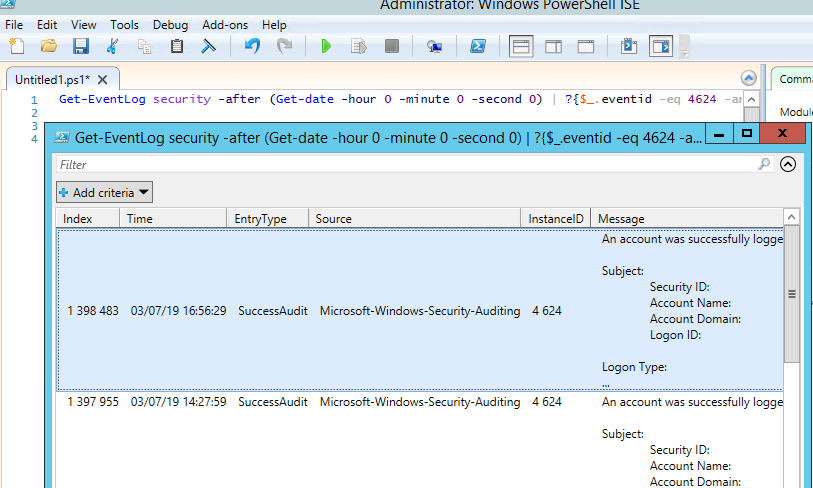
Authentication shows whether an RDP user has been successfully authenticated on the server or not. The log is located in “Windows -> Security”. So you may be interested in the events with the EventID 4624 ( An account was successfully logged on ) or 4625 ( An account failed to log on ). Please, pay attention to the LogonType value in the event description. If the Remote Desktop service has been use to create new session during log on, LogonType = 10. If the LogonType = 7, it means that a user has reconnected to the existing RDP session.
At the same time, you can find a user name in the event description in the Account Name field, a computer name – in Workstation Name, and an IP address – in Source Network Address.
You can get the list of events related to successful RDP authentication (EventID 4624) using this PowerShell command:
Get-EventLog security -after (Get-date -hour 0 -minute 0 -second 0) | ? <$_.eventid -eq 4624 -and $_.Message -match 'logon type:\s+(10)\s'>| Out-GridView
Logon refers to an RDP logon to the system, an event that appears after a user has been successfully authenticated. It is an event with the EventID 21 ( Remote Desktop Services: Session logon succeeded ). This events are located in the “Applications and Services Logs -> Microsoft -> Windows -> TerminalServices-LocalSessionManager -> Operational”. As you can see, here you can find the ID of a user RDP session — Session ID.
The event with the EventID – 21 ( Remote Desktop Services: Shell start notification received ) means that the Explorer shell has been successfully started (the desktop appears in the user’s RDP session).
Session Disconnect/Reconnect – session disconnection / reconnection events have different IDs depending on what caused user disconnection (disconnection to inactivity, Disconnect option has been selected by the user in the session, RDP session ended by another user or an administrator, etc.). You can find these events in the logs located in “Applications and Services Logs -> Microsoft -> Windows -> TerminalServices-LocalSessionManager -> Operational”. Let’s consider the most interesting RDP events:
The event with the EventID 4778 in Windows -> Security log (A session was reconnected to a Window Station). A user has reconnected to an RDP session (a user is assigned a new LogonID).
The event with the EventID 4799 in “Windows -> Security” log ( A session was disconnected from a Window Station ). A user has been disconnected from an RDP session.
Logoff refers to the user logoff from the system. It is logged as the event with the EventID 23 ( Remote Desktop Services: Session logoff succeeded ) in “Applications and Services Logs -> Microsoft -> Windows -> TerminalServices-LocalSessionManager -> Operational”.
At the same time the event with the EventID 4634 ( An account was logged off ) appears in the Security log.
The event with the EventID 9009 ( The Desktop Window Manager has exited with code ) in the System log means that a user has initiated logoff from the RDP session with both the window and the graphic shell of the user have been terminated.
Here is a short PowerShell script that lists the history of all RDP connections for the current day from the terminal RDS server logs. The resulting table shows the connection time, the client’s IP address and the remote user name (if necessary, you can include other LogonTypes to the report).
Sometimes it can be more convenient to view and investigate RDP logs in the Excel table, so you can export any Windows events into a text file and import it in Excel. You can export the log from the Event Viewer GUI (only if the event logs are not cleared), from the command prompt:
WEVTUtil query-events Security > c:\ps\rdp_security_log.txt
get-winevent -logname «Microsoft-Windows-TerminalServices-LocalSessionManager/Operational» | Export-Csv c:\ps\rdp_connection_log.txt -Encoding UTF8
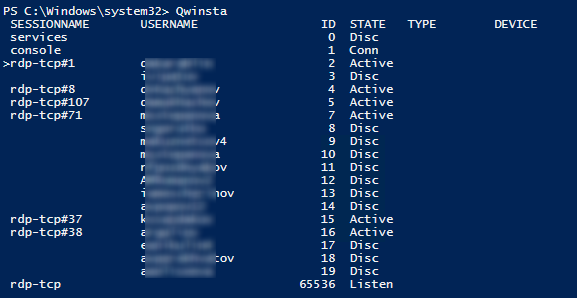
You can display the list of current remote sessions on your RDS server using this command:
The command returns the session ID (ID), the name of user (USERNAME) and the session state (Active/Disconnect). It is convenient to use this command when you need to get the ID of the user RDP session in case shadow connection is used.
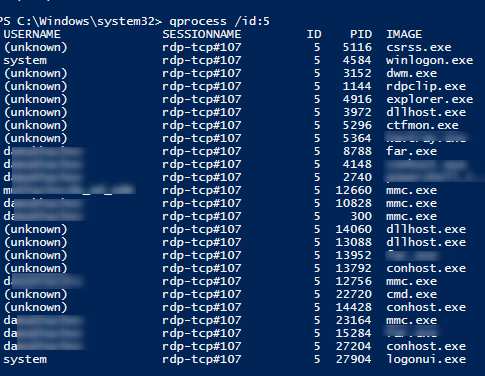
You can display the list of the running processes in the specific RDP session (the session ID is specified):
Logs on an RDP client side are not quite informative, but you can check the history of RDP connections in the user’s registry.
How to enable logging in WDS in Windows
This article describes how to enable logging in Windows Deployment Services (WDS) in Windows Server.
Original product version: В Windows Server 2012 R2
Original KB number: В 936625
This article contains information about how to modify the registry. Make sure that you back up the registry before you modify it. Make sure that you know how to restore the registry if a problem occurs. For more information about how to back up, restore, and modify the registry, see Windows registry information for advanced users.
Introduction
This article discusses how to enable logging in WDS in Windows Server. Additionally, this article describes how to gather data in WDS.
You can use this information to help troubleshoot issues that you may experience in WDS.
Overview
Serious problems might occur if you modify the registry incorrectly by using Registry Editor or by using another method. These problems might require that you reinstall the operating system. Microsoft cannot guarantee that these problems can be solved. Modify the registry at your own risk.
Each WDS component has a mechanism that you can enable for logging and for tracing. You can then analyze the results for troubleshooting. Use the information in the following sections to enable logging and tracing for WDS components.
General WDS server health
Type the following command to generate general server health information:
This command causes general server health information to be logged in the Application log and in the System log.
WDS server component
Type the following command to generate health information about the WDS server component:
This command causes WDS information to be logged in the Application log and in the System log.
Obtain trace logs for Windows Server
To obtain trace information for Windows Server, do the following:
- Open Event Viewer (eventvwr).
- Browse to Windows Logs\Applications and Services Logs\Microsoft\Windows\Deployment-Services-Diagnostics.
- Right-click the channel and choose Enable Log.
Then, configure the components that you want to be logged by setting one or more of the following registry keys to a 0 value.
WDS servers also support the following additional tracing:
You can set these registry keys to the following values to control what is included:
- 7F0000: This value includes packet tracing and protocol tracing.
- 3F0000: This value excludes packet tracing.
- 3E0000: This value excludes packet tracing and protocol tracing. By default, this value is used.
A tracing process may affect performance. Therefore, we recommend that you disable the tracing functionality when you do not have to generate a log.
After you set this registry entry, trace information for the WDS server component is logged in the following file:%windir%\Tracing\wdsserver.log
WDS management components
Type the following command to generate management component health information:
This command causes WDS component health information to be logged in the Application log and in the System log.
Enable tracing
To obtain trace information, you must enable tracing in the WDS management component and in the WDS Microsoft Management Console (MMC) component. To do this, set the following registry entries:
For the management component
- Path: HKEY_LOCAL_MACHINE\SOFTWARE\Microsoft\Tracing\WDSMGMT
- Name: EnableFileTracing
- Value type: REG_DWORD
- Value data: 1
For the MMC component
- Path: HKEY_LOCAL_MACHINE\SOFTWARE\Microsoft\Tracing\WDSMMC
- Name: EnableFileTracing
- Value type: REG_DWORD
- Value data: 1
After you set these registry entries, trace information for the WDS management component is logged in the %windir%\Tracing\wdsmgmt.log file.
Additionally, trace information for the WDS MMC component is logged in the %windir%\Tracing\wdsmmc.log file.
Although the WDS MMC component and the WDSUTIL component share the same API layer, MMC sometimes adds processing and functionality. If an error occurs, it is frequently worthwhile to use WDSUTIL to try to reproduce the failure. WDSUTIL may help you determine whether the error is local to MMC or whether the error is a general management API failure. Frequently, the WDSUTIL component provides more detailed error output when tracing is not enabled. Where applicable, use the following options to obtain extra information:
WDS legacy components
If you perform legacy management functions, set the following registry entry to enable tracing in the RISetup component:
- Path: HKEY_LOCAL_MACHINE\SOFTWARE\Microsoft\Tracing\RISetup
- Name: EnableFileTracing
- Value type: REG_DWORD
- Value data: 1
To obtain the trace log in the WDSCapture operation, follow these steps:
Start the Capture Windows PE boot image.
When the Capture Wizard starts, press SHIFT+F10 to open a command prompt.
Enable tracing in the WDSCapture component. To do this, follow these steps:
- Start Registry Editor.
- Set the following registry entry to enable tracing in the WDSCapture component:
- Path: HKEY_LOCAL_MACHINE\SOFTWARE\Microsoft\Tracing\WDSCapture
- Name: EnableFileTracing
- Value type: REG_DWORD
- Value data: 1
Start a second instance of the WDSCapture component. Then, reproduce the problem by using the second instance of WDSCapture.
Don’t close the original instance of WDSCapture. If you close the original instance of WDSCapture, Windows PE restarts. Instead, press ALT+TAB to switch between the instances of WDSCapture.The following trace log file is generated: X:\Windows\Tracing\WDSCapture.log.
WDS client components
To turn on the client logging functionality, run the following command on the WDS server:
Then, run the following command on the WDS server to change which events are logged:
Each category includes all the events from the previous categories.
The following are the definitions of the logging levels:
- The NONE logging level disables the logging functionality. By default, this logging level is used.
- The ERRORS logging level logs only errors.
- The WARNINGS logging level logs warnings and errors.
- The INFO logging level logs errors, warnings, and informational events. This logging level is the highest logging level.
To view the event logs, follow these steps:
- Open Server Manager, and then click Diagnostics.
- Click Event Viewer.
- Click Applications and Services Logs.
- Click Microsoft, click Windows, and then click Deployment-Services-Diagnostics.
In the tree structure of event logs, the Admin log contains all the errors, and the Operational log contains the information messages. The following are the definitions of the architectures that are listed for some errors in these logs:
- The Architecture 0 is the x86 processor architecture.
- The Architecture 6 is the IA-64 processor architecture.
- The Architecture 9 is the x64 processor architecture.
Setup logs from the client computer
The location of the setup logs depends on when the failure occurs.
If the failure occurs in Windows PE before the disk configuration page of the WDS client is completed, you can find the logs at the X:\Windows\Panther folder. Use Shift+F10 to open a command prompt, and then change the directory to the location.
If the failure occurs in Windows PE after the disk configuration page of the WDS client is completed, you can find the logs on the local disk volume at the $Windows.
BT\Sources\Panther folder. The local disk volume is usually the drive C. Use Shift+F10 to open a command prompt, and then change the directory to the location.
If the failure occurs on the first boot after the image is applied, you can find the logs in the \Windows\Panther folder of the local disk volume. The local disk volume is usually the drive C.


