- Мониторинг текущей нагрузки сервера удаленного доступа. Monitor the existing load on the Remote Access server
- Использование панели мониторинга для наблюдения за нагрузкой сервера удаленного доступа To use the monitoring dashboard to monitor the Remote Access server load
- Использование средства «системный монитор» для мониторинга счетчиков производительности на сервере удаленного доступа To use the Performance Monitor tool to monitor performance counters on the Remote Access server
- Мониторинг активности и статуса подключенных удаленных клиентов. Monitor connected remote clients for activity and status
- Мониторинг активности и состояния удаленных клиентов To monitor remote client activity and status
- Microsoft Monitoring Agent Setup
- Download and install the Microsoft Monitoring Agent (MMA) setup file from Azure Log Analytics
- Microsoft Monitoring Agent Upgrade
Мониторинг текущей нагрузки сервера удаленного доступа. Monitor the existing load on the Remote Access server
Область применения. Windows Server (Semi-Annual Channel), Windows Server 2016 Applies To: Windows Server (Semi-Annual Channel), Windows Server 2016
Примечание. Windows Server 2012 объединяет DirectAccess и службы маршрутизации и удаленного доступа (RRAS) в единую роль удаленного доступа. Note: Windows Server 2012 combines DirectAccess and Routing and Remote Access Service (RRAS) into a single Remote Access role.
Термин нагрузка означает статистику, связанную с числом подключений на сервере удаленного доступа. The term Load refers to the statistics that relate to the number of connections on the Remote Access server. Ниже приведены шаги, необходимые для наблюдения за нагрузкой на сервере удаленного доступа. Following are the steps required to track the load on the Remote Access server.
Для просмотра статистики нагрузки для сервера можно использовать панель мониторинга мониторинга, доступную в консоли управления на сервере удаленного доступа, или счетчики системного монитора для отслеживания статистики. You can use the monitoring dashboard that is available in the management console on the Remote Access server to view the load statistics for the server, or you can use Performance Monitor counters to track the statistics.
Для выполнения задач, описанных в этом разделе, необходимо войти в систему как член группы «Администраторы домена» или член группы «Администраторы» на каждом компьютере. You must be signed in as a member of the Domain Admins group or a member of the Administrators group on each computer to complete the tasks described in this topic. Если вы не можете выполнить задачу, войдя в учетную запись, которая является членом группы «Администраторы», попробуйте выполнить задачу, войдя в учетную запись, которая является членом группы «Администраторы домена». If you cannot complete a task while you are signed in with an account that is a member of the Administrators group, try performing the task while you are signed in with an account that is a member of the Domain Admins group.
Использование панели мониторинга для наблюдения за нагрузкой сервера удаленного доступа To use the monitoring dashboard to monitor the Remote Access server load
В диспетчере серверов щелкните Средства и выберите пункт Управление удаленным доступом. In Server Manager, click Tools, and then click Remote Access Management.
Щелкните ПАНЕЛЬ МОНИТОРИНГА, чтобы открыть Панель удаленного доступа в Консоли управления удаленным доступом. Click DASHBOARD to navigate to Remote Access Dashboard in the Remote Access Management Console.
На панели мониторинга мониторинга Обратите внимание на плитку состояния удаленного клиента на плитке состояния сервера . On the monitoring dashboard, notice the Remote Client Status tile within the Server Status tile. На этой плитке перечислены статистические данные, такие как общее число подключенных удаленных клиентов, общее количество подключенных клиентов DirectAccess и максимальное число пользователей, подключившихся за последние 24 часа. This tile lists statistics such as the total number of remote clients that are connected, the total number of DirectAccess clients that are connected, and the maximum number of users who connected in last 24 hours.
Вы можете нажать кнопку Обновить в разделе задачи на правой панели, чтобы перезагрузить состояние работоспособности. You can click Refresh under Tasks in the right pane to reload the health status. Чтобы изменить интервал обновления по умолчанию, щелкните настроить интервал обновления в разделе задачи. To change the default refresh interval, click Configure Refresh Interval under Tasks.
Использование средства «системный монитор» для мониторинга счетчиков производительности на сервере удаленного доступа To use the Performance Monitor tool to monitor performance counters on the Remote Access server
Нажмите кнопку Пуск, выберите пункт Администрирование, а затем дважды щелкните системный монитор. Click Start, click Administrative Tools, and then double-click Performance Monitor.
В разделе производительность выберите системный монитор. Under Performance, click Performance Monitor.
Нажмите кнопку Добавить (обозначенную зеленым крестом значка) на панели инструментов монитора производительности . Click the Add button (denoted by a green cross icon) in the Performance Monitor toolbar.
В списке доступных счетчиков выберите все счетчики в категории RAS и рамгмтсвк , а затем нажмите кнопку Добавить>>. From the list of Available Counters, select all the counters in the RAS and RAmgmtsvc categories, and then click Add>>.
В списке доступных счетчиков выберите все счетчики в категории подключения IPSec и нажмите кнопку Добавить>>. Again, from the list of Available Counters, select all the counters in the IPsec Connections category, and then click Add>>.
Нажмите кнопку ОК , чтобы добавить выбранные счетчики в консоли системного монитора для отслеживания. Click OK to add the selected counters in the Performance Monitor console for tracking.
Теперь системный монитор будет отображать выбранную статистику нагрузки на сервер. Performance Monitor will now graphically show the selected server load statistics.
Эквивалентные команды в Windows PowerShell Windows PowerShell Windows PowerShell equivalent commands
Следующие командлеты Windows PowerShell выполняют ту же функцию, что и предыдущая процедура. The following Windows PowerShell cmdlet or cmdlets perform the same function as the preceding procedure. Вводите каждый командлет в одной строке, несмотря на то, что здесь они могут отображаться разбитыми на несколько строк из-за ограничений форматирования. Enter each cmdlet on a single line, even though they may appear word-wrapped across several lines here because of formatting constraints.
Мониторинг активности и статуса подключенных удаленных клиентов. Monitor connected remote clients for activity and status
Область применения. Windows Server (Semi-Annual Channel), Windows Server 2016 Applies To: Windows Server (Semi-Annual Channel), Windows Server 2016
Примечание. Windows Server 2012 объединяет службу DirectAccess и службы удаленного доступа (RAS) в одну роль удаленного доступа. Note: Windows Server 2012 combines DirectAccess and Remote Access Service (RAS) into a single Remote Access role.
Консоль управления на сервере удаленного доступа можно использовать для наблюдения за активностью и состоянием удаленных клиентов. You can use the management console on the Remote Access server to monitor remote client activity and status.
Для выполнения задач, описанных в этом разделе, необходимо войти в систему как член группы «Администраторы домена» или член группы «Администраторы» на каждом компьютере. You must be signed in as a member of the Domain Admins group or a member of the Administrators group on each computer to complete the tasks described in this topic. Если вы не можете выполнить задачу, войдя в учетную запись, которая является членом группы «Администраторы», попробуйте выполнить задачу, войдя в учетную запись, которая является членом группы «Администраторы домена». If you cannot complete a task while you are signed in with an account that is a member of the Administrators group, try performing the task while you are signed in with an account that is a member of the Domain Admins group.
Мониторинг активности и состояния удаленных клиентов To monitor remote client activity and status
В диспетчере серверов щелкните Средства и выберите пункт Управление удаленным доступом. In Server Manager, click Tools, and then click Remote Access Management.
Щелкните отчеты , чтобы перейти к отчетам удаленного доступа в консоли управления удаленным доступом. Click REPORTING to navigate to Remote Access Reporting in the Remote Access Management Console.
Щелкните состояние удаленного клиента , чтобы перейти к пользовательскому интерфейсу активности и состояния удаленных клиентов в консоли управления удаленным доступом. Click Remote Client Status to navigate to the remote client activity and status user interface in the Remote Access Management Console.
Вы увидите список пользователей, подключенных к серверу удаленного доступа, и подробную статистику по ним. You will see the list of users who are connected to the Remote Access server and detailed statistics about them. Щелкните первую строку в списке, соответствующую клиенту. Click the first row in the list that corresponds to a client. При выборе строки на панели предварительного просмотра отображается активность удаленных пользователей. When you select a row, the remote user activity is shown in the preview pane.
Эквивалентные команды в Windows PowerShell Windows PowerShell Windows PowerShell equivalent commands
Следующие командлеты Windows PowerShell выполняют ту же функцию, что и предыдущая процедура. The following Windows PowerShell cmdlet or cmdlets perform the same function as the preceding procedure. Вводите каждый командлет в одной строке, несмотря на то, что здесь они могут отображаться разбитыми на несколько строк из-за ограничений форматирования. Enter each cmdlet on a single line, even though they may appear word-wrapped across several lines here because of formatting constraints.
Статистику пользователя можно фильтровать на основе выбора критериев, используя поля в следующей таблице. The user statistics can be filtered, based on criteria selections, by using the fields in the following table.
Microsoft Monitoring Agent Setup
The Microsoft Monitoring Agent must be installed and configured on the data collection machine. It must also be installed on the Log Analytics Gateway if deploying that scenario.
For detailed information about the Microsoft Monitoring Agent including system requirements, network firewall configuration requirements, TLS 1.2 requirements, download, and installation instructions, see the Agent Windows article.
The information below list the proxy and firewall configuration information required for the Linux and Windows agent to communicate with Log Analytics within the Azure commercial cloud. For complete and up to date information on the networking requirements for the MMA as well as networking requirements for Azure Government or other sovereign Azure Log Analytics services, see the article HERE.
| Agent Resource | Ports | Direction | Bypass HTTPS inspection |
|---|---|---|---|
| * .ods.opinsights.azure.com | Port 443 | Outbound | Yes |
| * .oms.opinsights.azure.com | Port 443 | Outbound | Yes |
| * .blob.core.windows.net | Port 443 | Outbound | Yes |
| * .azure-automation.net | Port 443 | Outbound | Yes |
Download and install the Microsoft Monitoring Agent (MMA) setup file from Azure Log Analytics
On the designated data collection machine and Log Analytics Gateway (if using) complete the following steps. If Log Analytics Gateway scenario is being deployed, then install and configure the MMA on the gateway first.
If the collection machine does not have an Internet connection, perform the first 3 steps from an Internet Connected machine.
- In the Azure portal, go to Log Analytics, select your workspace and click the Advanced Settings Icon.
- Click Connected Sources, and then select Windows Servers.
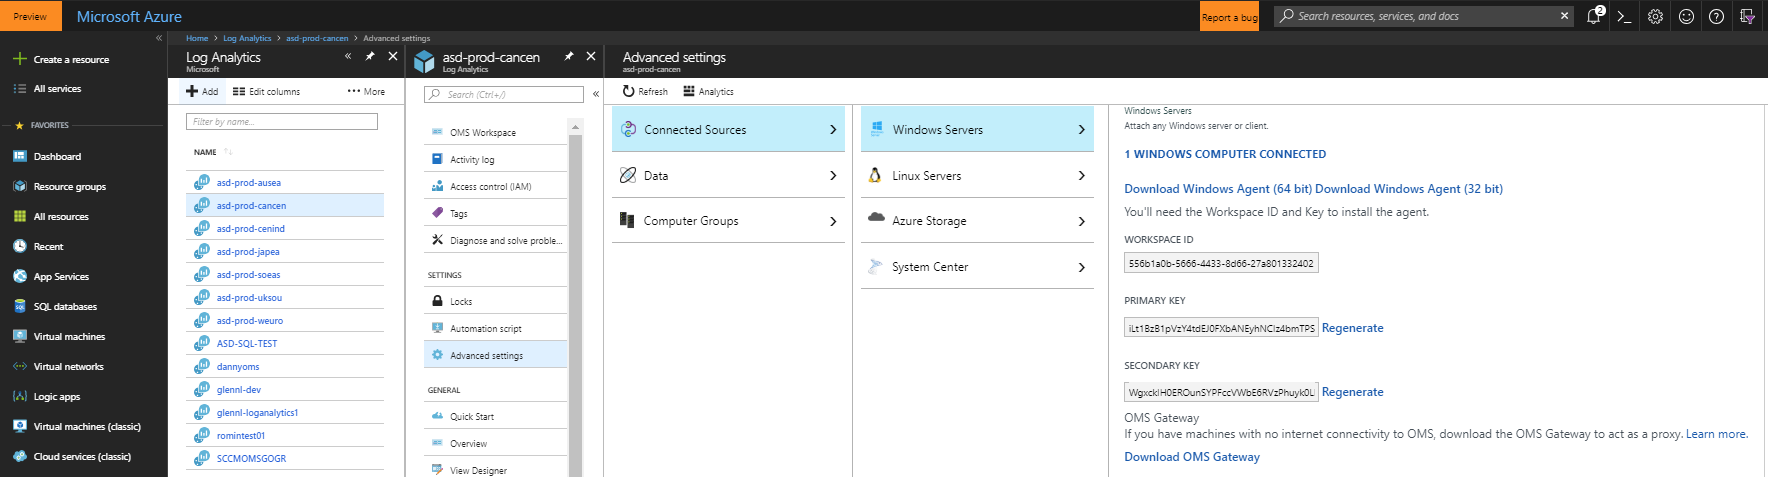
- Click the Download Windows Agent link that is applicable to your computer processor type to download the setup file. If the agent is downloaded on another machine, copy the Setup file over to the data collection machine or Log Analytics Gateway server.

If a monitoring client was installed for System Center Operations Manager (SCOM), the setup only offers to Upgrade the agent, preserving existing settings. The upgrade for SCOM agent does not include any of the configuration steps below.*
The next steps apply to installations where no monitoring client was installed for SCOM. Refer to the Microsoft Monitoring Agent Upgrade section in this document when you are performing an upgrade of the Monitoring Agent for SCOM.
- Run Setup to install the agent.
- On the Welcome page, click Next.
- On the License Terms page, read the license and then click I Agree.
- On the Destination Folder page, change or keep the default installation folder and then click Next.
- On the Agent Setup Options page, choose the Connect the agent to Azure Log Analytics (OMS) option. Click Next.

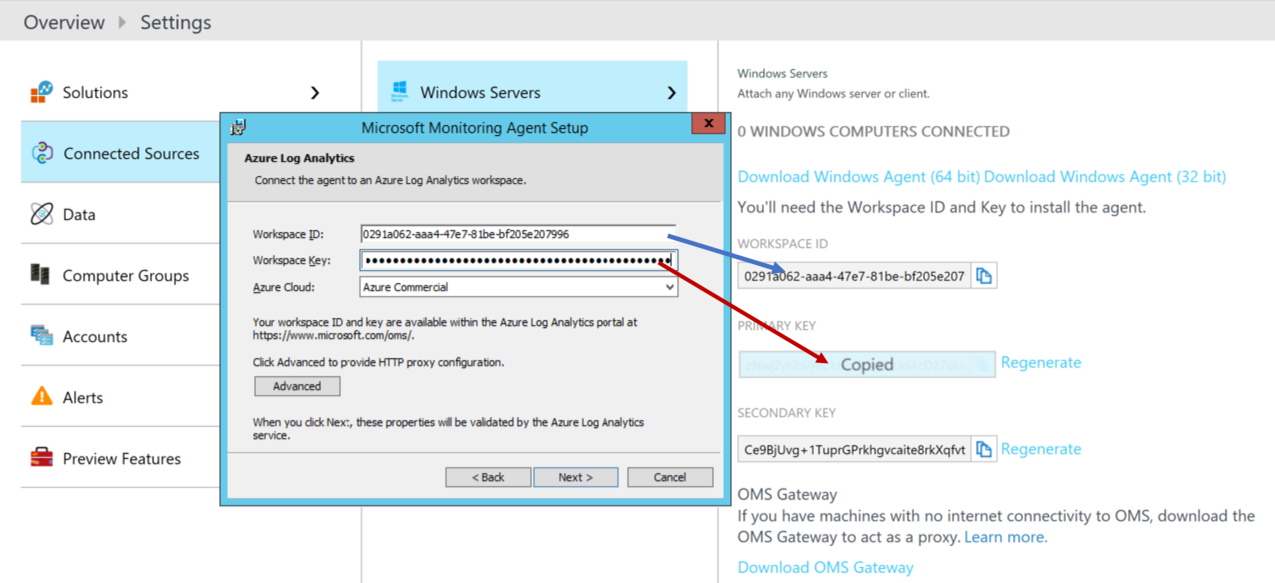
1. On the **Overview, Settings Dashboard** page, click **Connected Sources**, and then copy and paste the **Workspace ID** and **Workspace Key (Primary Key)** from the log analytics portal. (Hint: Click the copy button then paste in the corresponding **Agent Setup** field). Select **Azure Commercial** or if you are using an Azure US Government cloud select **Azure US Government** from the **Azure Cloud** drop down menu and click **OK**. 1. If you are currently installing the agent on the data collection machine and using an Log Analytics Gateway deployment scenario, or if your company requires access through a proxy server, click the **Advanced** button to provide **HTTP proxy** configuration. If you do not use any of the above, click **Next** and go to **step 12**.
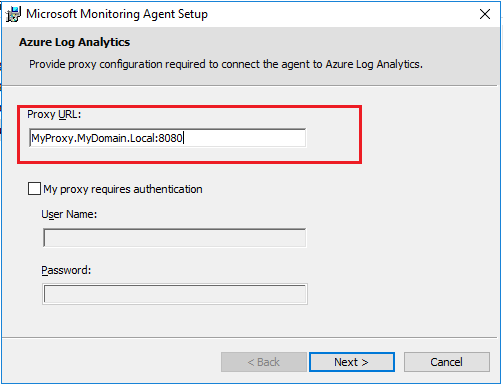
1. Specify the fully qualified domain name (FQDN) or the IP address and port of the Log Analytics Gateway. If you use a proxy server instead of an Log Analytics Gateway, add the information for your proxy server and if required, authentication credentials (not required for the Log Analytics Gateway), then click **Next** twice.
1. On the **Microsoft Update** page, optionally select **Use Microsoft Update when I check for updates (recommended)**, then click **Next**. 1. On the **Ready to Install** page, review your choices, and then click **Install**. 1. On the **Microsoft Monitoring Agent** configuration completed successfully page, click **Finish**.

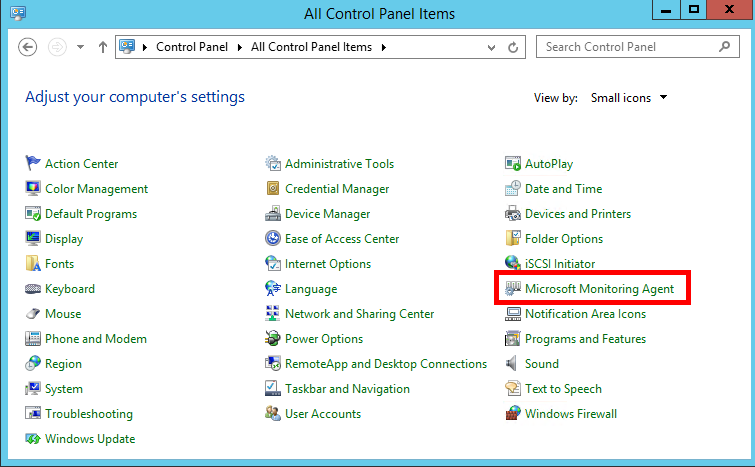
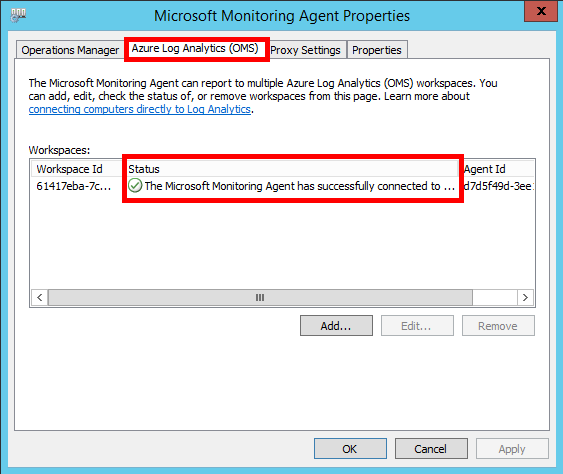
1. When complete, the **Microsoft Monitoring Agent** appears in **Control Panel**. You can review your configuration there and verify that the agent is connected to Azure Log Analytics. When connected to Log Analytics, the agent displays a message stating: **The Microsoft Monitoring Agent has successfully connected to the log analytics service**.
If you have been installing the Microsoft Monitoring Agent on the Log Analytics Gateway, you need to repeat the installation steps above on the data collection machine.
After setting up the data collection machine, continue getting started with On-demand Assessments by selecting the Configure Microsoft On-demand Assessments article in the Table of Contents.
Microsoft Monitoring Agent Upgrade
If a monitoring agent is already installed, the Microsoft Monitoring Agent setup will only display the upgrade option. The upgrade will keep the existing configuration and adds a new option to configure a Log Analytics workspace.
Follow the steps below to perform an upgrade and configure the agent for the log analytics Workspace.
- Run Setup to install the agent
- On the Welcome page, click Next
- On the License Terms page, read the license and then click I Agree
- On the begin Upgrade page, click Upgrade
- On the Completion page, click Finish
- Once the agent installation completed, go to the Control Panel

1. Click Microsoft Monitoring Agent 1. If the Log Analytics Gateway scenario is chosen or a Proxy server is in place go to the Proxy Settings tab. When this scenario is not used go to step 9
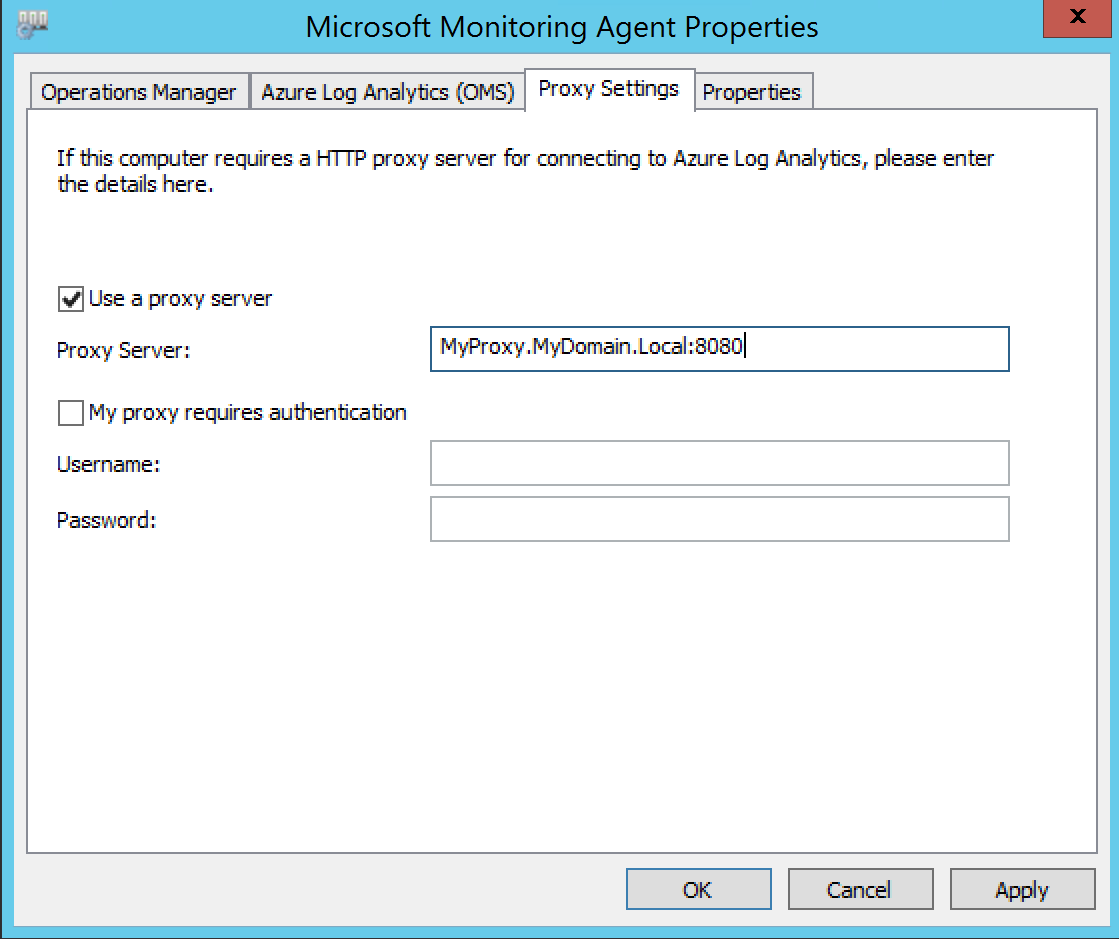
Select Use a proxy server and specify the fully qualified domain name (FQDN) or the IP address and port of the Log Analytics Gateway. If you use a proxy server instead of an Log Analytics Gateway, add the information for your proxy server and if required, authentication credentials (not required for the Log Analytics Gateway), then Select Apply 1. Select the Azure Log Analytics (OMS) tab and click Add.
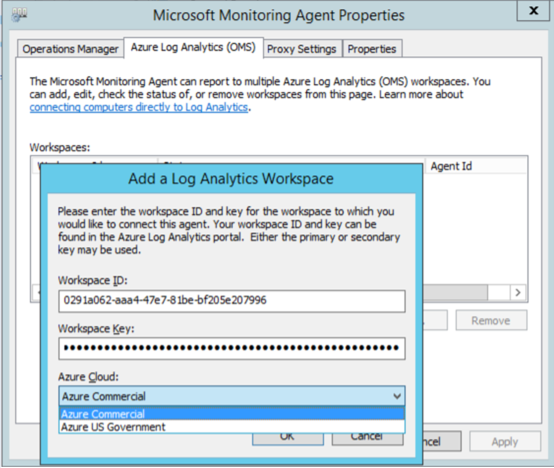
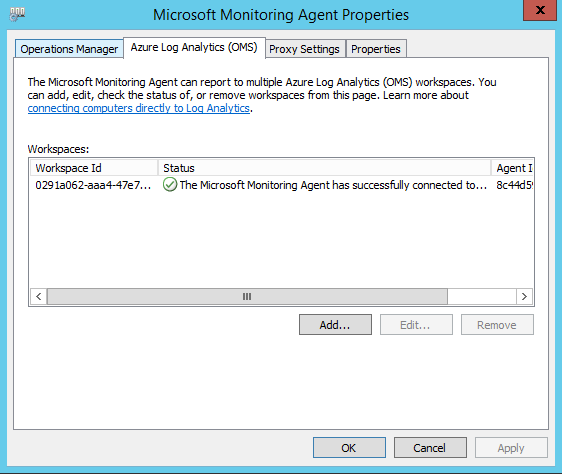
1. Copy and paste the Workspace ID and Workspace Key (Primary Key) from the log analytics portal. (Hint: Click the copy button then paste in the corresponding Agent Setup field). Select Azure Commercial or, if you are using an Azure US Government cloud select Azure US Government from the Azure Cloud drop down menu and click OK. 1. An exclamation mark will be visible in the Workspaces pane. Click Apply. This will stop and start the agent, and the Workspaces pane should look like the following example after a few seconds.
1. Click OK to finish the Microsoft Monitoring Agent upgrade for log analytics.
After setting up the data collection machine, continue getting started with On-demand Assessments by selecting the Configure Microsoft On-demand Assessments article in the Table of Contents.
For general feedback on the Resource Center or content, please submit your response to UserVoice. For specific requests and content updates regarding the Services Hub, contact our Support Team to submit a case.


