- User mode and kernel mode
- Isolated User Mode (IUM) Processes
- Trustlets
- Isolated User Mode (IUM) Implications
- Remarks
- Debugging a User-Mode Process Using WinDbg
- Attaching to a Running Process
- WinDbg Menu
- Command Prompt
- Debugger Command Window
- Attaching to a Running Process Noninvasively
- WinDbg Menu
- Command Prompt
- Debugger Command Window
- Spawning a New Process
- WinDbg Menu
- Command Prompt
- Debugger Command Window
- Reattaching to a Process
- Пользовательский режим (user mode) и режим ядра (kernel mode)
User mode and kernel mode
A processor in a computer running Windows has two different modes: user mode and kernel mode. The processor switches between the two modes depending on what type of code is running on the processor. Applications run in user mode, and core operating system components run in kernel mode. While many drivers run in kernel mode, some drivers may run in user mode.
When you start a user-mode application, Windows creates a process for the application. The process provides the application with a private virtual address space and a private handle table. Because an application’s virtual address space is private, one application cannot alter data that belongs to another application. Each application runs in isolation, and if an application crashes, the crash is limited to that one application. Other applications and the operating system are not affected by the crash.
In addition to being private, the virtual address space of a user-mode application is limited. A processor running in user mode cannot access virtual addresses that are reserved for the operating system. Limiting the virtual address space of a user-mode application prevents the application from altering, and possibly damaging, critical operating system data.
All code that runs in kernel mode shares a single virtual address space. This means that a kernel-mode driver is not isolated from other drivers and the operating system itself. If a kernel-mode driver accidentally writes to the wrong virtual address, data that belongs to the operating system or another driver could be compromised. If a kernel-mode driver crashes, the entire operating system crashes.
This diagram illustrates communication between user-mode and kernel-mode components.
Isolated User Mode (IUM) Processes
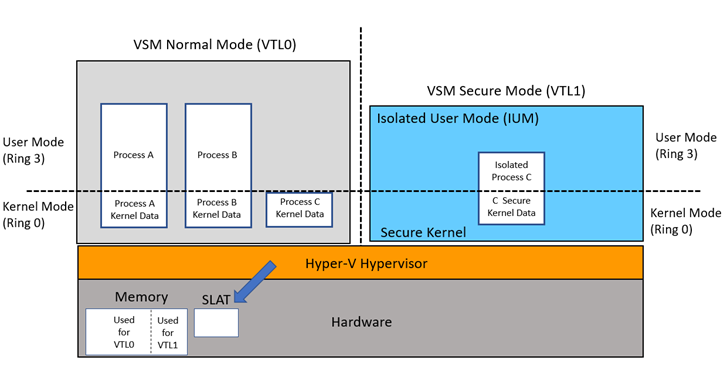
WindowsВ 10 introduced a new security feature named Virtual Secure Mode (VSM). VSM leverages the Hyper-V Hypervisor and Second Level Address Translation (SLAT) to create a set of modes called Virtual Trust Levels (VTLs). This new software architecture creates a security boundary to prevent processes running in one VTL from accessing the memory of another VTL. The benefit of this isolation includes additional mitigation from kernel exploits while protecting assets such as password hashes and Kerberos keys.
Diagram 1 depicts the traditional model of Kernel mode and User mode code running in CPU ring 0 and ring 3, respectively. In this new model, the code running in the traditional model executes in VTL0 and it cannot access the higher privileged VTL1, where the Secure Kernel and Isolated User Mode (IUM) execute code. The VTLs are hierarchal meaning any code running in VTL1 is more privileged than code running in VTL0.
The VTL isolation is created by the Hyper-V Hypervisor which assigns memory at boot time using Second Level Address Translation (SLAT). It continues this dynamically as the system runs, protecting memory the Secure Kernel specifies needing protection from VTL0 because it will be used to contain secrets. As separate blocks of memory are allocated for the two VTLs, a secure runtime environment is created for VTL1 by assigning exclusive memory blocks to VTL1 and VTL0 with the appropriate access permissions.
Diagram 1 — IUM Architecture
Trustlets
Trustlets (also known as trusted processes, secure processes, or IUM processes) are programs running as IUM processes in VSM. They complete system calls by marshalling them over to the Windows kernel running in VTL0 ring 0. VSM creates a small execution environment that includes the small Secure Kernel executing in VTL1 (isolated from the kernel and drivers running in VTL0). The clear security benefit is isolation of trustlet user mode pages in VTL1 from drivers running in the VTL0 kernel. Even if kernel mode of VTL0 is compromised by malware, it will not have access to the IUM process pages.
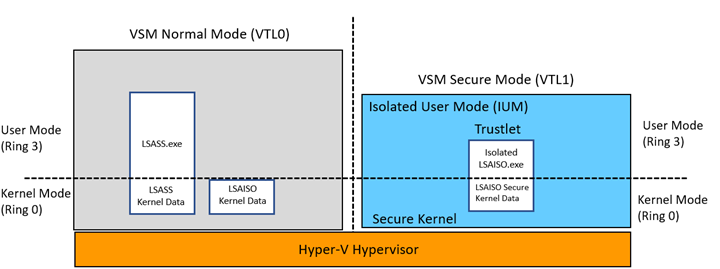
With VSM enabled, the Local Security Authority (LSASS) environment runs as a trustlet. LSASS manages the local system policy, user authentication, and auditing while handling sensitive security data such as password hashes and Kerberos keys. To leverage the security benefits of VSM, a trustlet named LSAISO.exe (LSA Isolated) runs in VTL1 and communicates with LSASS.exe running in VTL0 through an RPC channel. The LSAISO secrets are encrypted before sending them over to LSASS running in VSM Normal Mode and the pages of LSAISO are protected from malicious code running in VTL0.
Diagram 2 – LSASS Trustlet Design
Isolated User Mode (IUM) Implications
It is not possible to attach to an IUM process, inhibiting the ability to debug VTL1 code. This includes post mortem debugging of memory dumps and attaching the Debugging Tools for live debugging. It also includes attempts by privileged accounts or kernel drivers to load a DLL into an IUM process, to inject a thread, or deliver a user-mode APC. Such attempts may result in destabilization of the entire system. Windows APIs that would compromise the security of a Trustlet may fail in unexpected ways. For example, loading a DLL into a Trustlet will make it available in VTL0 but not VTL1. QueueUserApc may silently fail if the target thread is in a Trustlet. Other APIs, such as CreateRemoteThread, VirtualAllocEx, and Read/WriteProcessMemory will also not work as expected when used against Trustlets.
Use the sample code below to prevent calling any functions which attempt to attach or inject code into an IUM process. This includes kernel drivers that queue APCs for execution of code in a trustlet.
Remarks
If the return status of IsSecureProcess is success, examine the SecureProcess _Out_ parameter to determine if the process is an IUM process. IUM processes are marked by the system to be “Secure Processes”. A Boolean result of TRUE means the target process is of type IUM.
The WDK for WindowsВ 10, “Windows Driver Kit — Windows 10.0.15063.0”, contains the required definition of the PROCESS_EXTENDED_BASIC_INFORMATION structure. The updated version of the structure is defined in ntddk.h with the new IsSecureProcess field.
Debugging a User-Mode Process Using WinDbg
You can use WinDbg to attach to a running process or to spawn and attach to a new process.
Attaching to a Running Process
There are several ways you can use WinDbg to attach to a running process. Regardless of the method you choose, you will need the process ID or the process name. The process ID is a number assigned by the operating system. For more information about how to determine the process ID and the process name, see Finding the Process ID.
WinDbg Menu
When WinDbg is in dormant mode, you can attach to a running process by choosing Attach to a Process from the File menu or by pressing F6.
In the Attach to Process dialog box, select the process you want to debug, and select OK.
Command Prompt
In a Command Prompt window, you can attach to a running process when you launch WinDbg. Use one of the following commands:
- windbg -pProcessID
- windbg -pnProcessName
where ProcessID is the Process ID of a running process or ProcessName is the name of a running process.
For more information about the command-line syntax, see WinDbg Command-Line Options.
Debugger Command Window
If WinDbg is already debugging one or more processes, you can attach to a running process by using the .attach (Attach to Process) command in the Debugger Command window.
The debugger always starts multiple target processes simultaneously, unless some of their threads are frozen or suspended.
If the .attach command is successful, the debugger attaches to the specified process the next time the debugger issues an execution command. If you use this command several times in a row, execution has to be requested by the debugger as many times as you use this command.
Attaching to a Running Process Noninvasively
If you want to debug a running process and interfere only minimally in its execution, you should debug the process noninvasively.
WinDbg Menu
When WinDbg is in dormant mode, you can noninvasively debug a running process by choosing Attach to a Process from the File menu or by pressing F6.
When the Attach to Process dialog box appears, select the Noninvasive check box. Then, select the line that contains the process ID and name that you want. (You can also enter the process ID in the Process ID box.) Finally, select OK.
Command Prompt
In a Command Prompt window, you can attach to a running process noninvasively when you launch WinDbg. Use one of the following commands:
windbg -pv -p ProcessID windbg -pv -pn ProcessName There are several other useful command-line options. For more information about the command-line syntax, see WinDbg Command-Line Options.
Debugger Command Window
If the debugger is already active, you can noninvasively debug a running process by using the .attach -v (Attach to Process) command in the Debugger Command window.
You can use the .attach command if the debugger is already debugging one or more processes invasively. You cannot use this command if WinDbg is dormant.
If the .attach -v command is successful, the debugger debugs the specified process the next time that the debugger issues an execution command. Because execution is not permitted during noninvasive debugging, the debugger cannot noninvasively debug more than one process at a time. This restriction also means that using the .attach -v command might make an existing invasive debugging session less useful.
Spawning a New Process
WinDbg can start a user-mode application and then debug the application. The application is specified by name. The debugger can also automatically attach to child processes (additional processes that the original target process started).
Processes that the debugger creates (also known as spawned processes) behave slightly differently than processes that the debugger does not create.
Instead of using the standard heap API, processes that the debugger creates use a special debug heap. You can force a spawned process to use the standard heap instead of the debug heap by using the _NO_DEBUG_HEAP environment variable or the -hd command-line option.
Also, because the target application is a child process of the debugger, it inherits the debugger’s permissions. This permission might enable the target application to perform certain actions that it could not perform otherwise. For example, the target application might be able to affect protected processes.
WinDbg Menu
When WinDbg is in dormant mode, you can spawn a new process by choosing Open Executable from the File menu or by pressing CTRL+E.
When the Open Executable dialog box appears, enter the full path of the executable file in the File name box, or use the Look in list to select the path and file name that you want.
If you want to use any command-line parameters with the user-mode application, enter them in the Arguments box. If you want to change the starting directory from the default directory, enter the directory path in the Start directory box. If you want WinDbg to attach to child processes, select the Debug child processes also check box.
After you make your selections, select Open.
Command Prompt
In a Command Prompt window, you can spawn a new process when you launch WinDbg. Use the following command:
windbg [-o] ProgramName [Arguments]
The -o option causes the debugger to attach to child processes. There are several other useful command-line options. For more information about the command-line syntax, see WinDbg Command-Line Options.
Debugger Command Window
If WinDbg is already debugging one or more processes, you can create a new process by using the .create (Create Process) command in the Debugger Command window.
The debugger will always start multiple target processes simultaneously, unless some of their threads are frozen or suspended.
If the .create command is successful, the debugger creates the specified process the next time that the debugger issues an execution command. If you use this command several times in a row, execution has to be requested by the debugger as many times as you use this command.
You can control the application’s starting directory by using the .createdir (Set Created Process Directory) command before .create. You can use the .createdir -I command or the -noinh command-line option to control whether the target application inherits the debugger’s handles.
You can activate or deactivate the debugging of child processes by using the .childdbg (Debug Child Processes) command.
Reattaching to a Process
If the debugger stops responding or freezes, you can attach a new debugger to the target process. For more information about how to attach a debugger in this situation, see Reattaching to the Target Application.
Пользовательский режим (user mode) и режим ядра (kernel mode)
Понятие «пользовательский режим» и «режим ядра» относятся к операционной системе. С этими понятиями тесно связано понятие уровней привилегий процессоров, но это не одно и то же. ОС Windows в процессорах архитектуры x86 использует два уровня 0 и 3:
Операционная система Windows отвечает за переключение между пользовательским режимом и режимом ядра. Таким образом, когда выполняется код ОС или драйвера, он выполняется на 0 уровне процессора x86, который не имеет каких-либо ограничений. Если же выполняется код в пользовательском режиме — то это происходит на 3 уровне.
В принципе нам достаточно знать, что разработчики процессоров предусмотрели специальный механизм уровней привилегий, пойдя навстречу разработчикам операционных систем. Это сделано для того, чтобы сделать систему в целом более стабильной и менее подверженной сбоям из-за некачественно написанного программного обеспечения.
Для этого механизма также распространено название – rings (кольца защиты).
Хотя на рисунке видно, что драйвера Windows используют 1,2 уровень для Windows это не так, как уже было сказано (рисунок описывает возможность процессоров архитектуры x86). Возможно, в какой-либо другой операционной системе используются и эти уровни.
Итак, если программа, которая выполняется в пользовательском режиме, обратится по адресу памяти, который не существует, то мы получим только крах этой программы, закроем ее и запустим заново. Если же это произойдет в режиме ядра, то мы получим синий экран смерти (BSOD).
Большинство синих экранов смерти, порядка 70% (согласно статистики Microsoft) происходит из-за ошибок в драйверах сторонних разработчиков.
Выгода от такого подхода с привилегиями в том, что обычным программам, таким как браузеры, игры, текстовые редакторы и т.д., работать в режиме ядра не нужно, соответственно в случае их краха стабильность системы в целом не пострадает. Код, который написан для режима ядра, обычно более тщательно оттестирован, а его количество значительно меньше. Кроме того, чтобы установить драйвер, который работает в режиме ядра, нужны права Администратора. Таким образом, можно ограничить количество людей, имеющих возможность установить код, который может повлиять на работу системы в целом, что обычно и делается во многих организациях.
Однако в Windows драйвера могут частично работать и в пользовательском режиме, примером тому могут быть WDDM драйвера видео в Windows Vista.
Если вы работаете с правами обыкновенного пользователя, что я настоятельно рекомендую всегда делать, вы достигаете большего уровня защищенности и стабильности системы. Даже если вы запустите исполняемый файл с вирусом, вирус не сможет внедрится в систему на уровне ядра и например попытаться скрыть свое присутствие от антивируса или перехватывать данные вводимые вами с клавиатуры через свой драйвер.
Вы можете легко увидеть в своей системе, сколько процессорного времени отдается на исполнение кода в режиме ядра, а сколько пользовательскому режиму. Для этого выберите Пуск / Выполнить, введите perfmon и нажмите enter для того, чтобы запустить оснастку Системный монитор («Производительность» для Windows XP).
В панели инструментов выбираем «Добавить», далее выбираем счетчик процессор и, удерживая Ctrl, выбираем:
Нажимаем «Добавить» и «ОК».
Также наблюдать за загрузкой ЦП в режиме ядра можно с помощью диспетчера задач. Для этого вначале запускаем его (самый просто способ – Ctrl + Shift + Esc), далее выбираем “Вид / вывод времени ядра”.
Красная часть на графике относится к загрузке во время выполнения кода ядра. Как видим, часть процессорного времени тратится на исполнение кода в режиме ядра, а часть в пользовательском режиме.
Если мы работаем в системе с правами обыкновенного пользователя, а не администратора то вероятность получить вирус, из-за которого могут возникать синие экраны смерти, равна нулю.
Причиной BSOD может быть только код, который работает в режиме ядра. Поэтому если у вас было все хорошо, а после установки антивируса, начали возникать синие экраны смерти, причина, скорее всего в нем. Достаточно удалить антивирус и проследить за тем, происходит ли крах системы или нет.


