- Мониторинг доступности службы linux с помощью Zabbix
- Введение
- Описание работы простых проверок (simple check)
- Мониторинг доступности сервиса по сети
- Мониторинг локальной службы в linux
- Заключение
- Zabbix Documentation 5.4
- Sidebar
- Table of Contents
- 8. Service monitoring
- Overview
- Configuration
- Zabbix Documentation 5.4
- Sidebar
- Table of Contents
- 2 Agent
- Overview
- Supported platforms
- Agent on UNIX-like systems
- Agent on Windows systems
- Other agent options
- Agent process types
- Process user
- Configuration file
- Locale
- Exit code
Мониторинг доступности службы linux с помощью Zabbix
Ранее я рассматривал различные конфигурации для мониторинга параметров и программ в windows и linux. Сейчас я хочу рассказать, как мониторить с помощью Zabbix произвольный сервис (службу), который работает либо локально на сервере, либо на внешнем tcp порту. Это может быть что угодно — ssh, ldap, smtp, ftp, http, pop, nntp, imap, tcp, https, telnet или любой другой сервис.
Введение
Если у вас еще нет своего сервера для мониторинга, то рекомендую материалы на эту тему. Для тех, кто предпочитает систему CentOS:
То же самое на Debian 10, если предпочитаете его:
В заббикс существуют различные способы получать данные для мониторинга. Наиболее распространенные источники информации:
- Zabbix агент. Устанавливается на наблюдаемую машину и отправляет данные на сервер мониторинга.
- SNMP агент. Чаще всего присутствует на устройстве, либо может быть установлен на сервер.
- Простые проверки — simple check. Выполняются непосредственно на сервере zabbix с помощью встроенных инструментов, не требуют дополнительных действий со стороны хоста.
- Внешние проверки — external checks. Как и простые проверки выполняются на сервере мониторинга, но не встроенными средствами, а внешними скриптами.
Есть и другие способы получения данных. Не буду их все перечислять, ознакомиться с ними можно в соответствующем разделе официальной документации. В нашем случае мы воспользуемся первыми двумя способами для мониторинга служб и сервисов в linux.
Тут можно пойти разными путями. Меня интересует мониторинг различных линукс служб, работающих как локально (samsdaemon, postgrey) в пределах конкретного сервера, так и для публичного доступа по сети, в частности squid, smtp, imap, http. Первое, что пришло в голову, это использовать итем с ключом service_state[]. Но как оказалось, этот тип данных снимает значения только с системных служб windows. Я не сразу это понял и некоторое время повозился в консоли, не понимая, почему при тестировании значения получаю сообщение, что данный item не поддерживается:
Дальше придумал через UserParameter запускать какой-нибудь скрипт, который будет проверять запущен ли сервис в системе или нет. Например с помощью ps ax | grep squid. В принципе, рабочий вариант, но мне казалось, что такую простую задачу можно решить проще и быстрее, без создания на каждом хосте скрипта и изменения файла конфигурации. И я не ошибся. Есть 2 различных способа мониторинга служб (сервисов) в linux с помощью zabbix. Рассмотрим первый из них.
Описание работы простых проверок (simple check)
Стал искать материал на эту тему и прочитал про simple check (простые проверки) в zabbix. Оказалось, это то, что нужно. Их можно использовать для безагентских проверок удаленных сервисов. При этом требуется минимум настроек и только на сервере. Можно создать шаблон и распространить на любое количество хостов.
Принцип работы простых проверок следующий. Вы создаете item, в нем указываете тип simple check, в качестве ключа выбираете net.tcp.service[сервис, , ], указываете соответствующие параметры в скобках и все. Сервер сам начинает опрашивать указанный сервис и возвращать в зависимости от его доступности 0 или 1. Устанавливать агент на хост не нужно. Мониторить можно любую сетевую службу, к которой есть доступ по tcp.
| 0 | сервис недоступен |
| 1 | сервис работает |
Всего в простых проверках доступны 5 ключей. Подробнее о них читайте в документации. В данном случае меня будет интересовать только ключ net.tcp.service. В нем предопределены алгоритмы проверок следующих служб: ssh, ntp, ldap, smtp, ftp, http, pop, nntp, imap, https, telnet. Детали реализации проверки каждой службы описаны тут. Если вы мониторите службу, которая не входит в указанный выше список, то происходит просто проверка возможности подключения, без отправки и получения каких-то данных.
Мониторинг доступности сервиса по сети
В качестве примера настроим мониторинг доступности прокси сервера squid. Он запущен на linux сервере и этот хост уже добавлен на сервер мониторинга. Данные поступают с помощью агента, но мы не будет его использовать. Просто создадим одиночный item для проверки доступности squid и trigger для отправки уведомления, если сервис не работает. В данном примере я рассмотрю настройку на примере конкретного хоста. Если у вас несколько серверов с squid, которые вы хотите мониторить, то все элементы лучше создать не отдельно на каждом хосте, а сразу сделать template и назначить его нужным хостам.
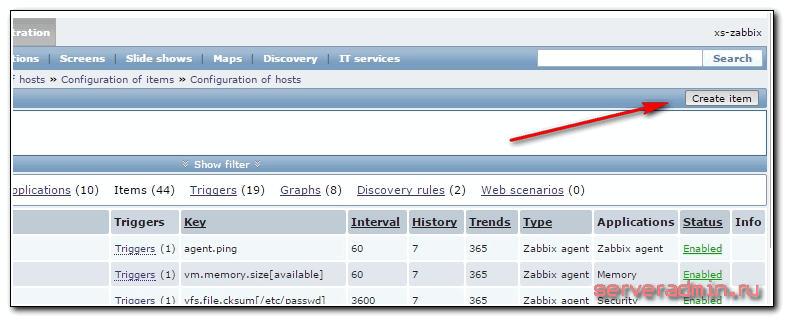
Итак, идем в Configuration -> Hosts и выбираем там хост, на котором установлен squid. Переходим в раздел Items и нажимаем Create item.
Заполняем необходимые параметры элемента.
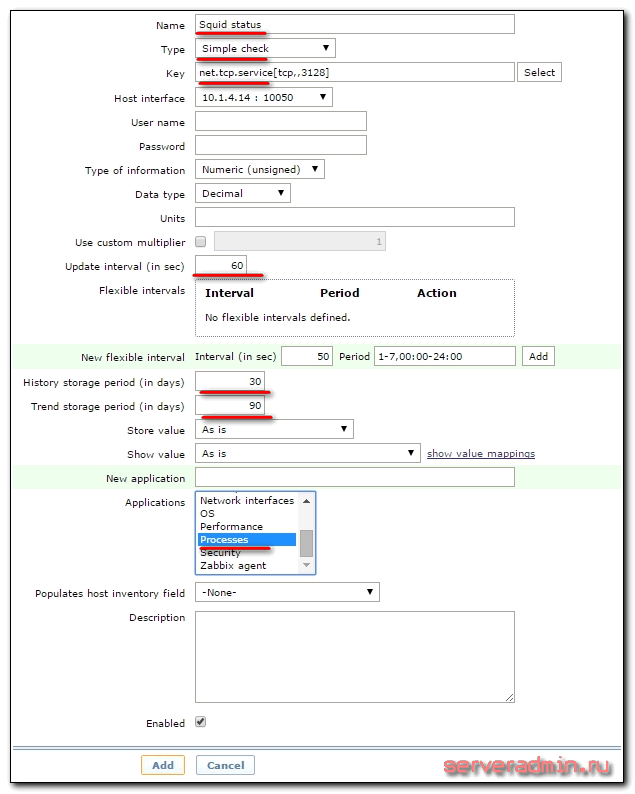
Обязательно заполнить первые 3, остальные на ваше усмотрение. Я считаю, что проверять каждые 30 секунд и хранить 90 дней информацию излишне, поэтому изменяю эти параметры в сторону увеличения.
| Squid status | Имя итема. |
| Simple check | Тип итема. |
| net.tcp.service[tcp,,3128] | Проверять tcp порт 3128 на указанном хосте. Если вы проверяете статус службы, расположенной не на том же хосте, к которому прикрепляете item, то после первой запятой можно указать необходимый адрес. |
Сразу создадим триггер, который в случае возврата в последних двух проверках значения итемом 0, будет отправлять уведомление о том, что служба недоступна. Для этого идем в раздел triggers и жмем Create trigger. Заполняем параметры элемента.
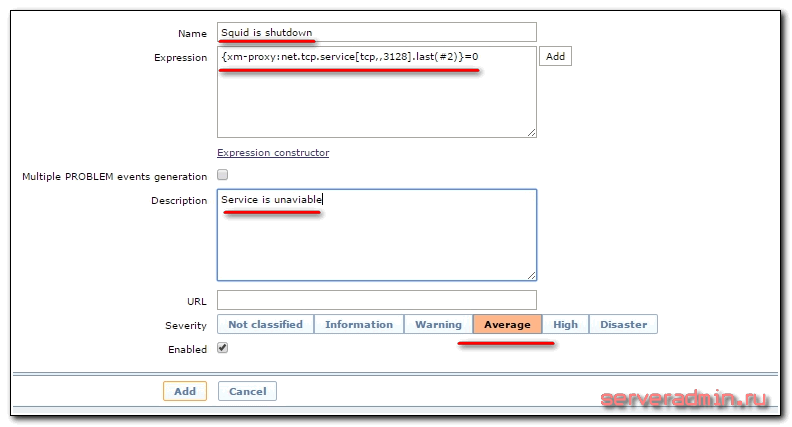
Выражение
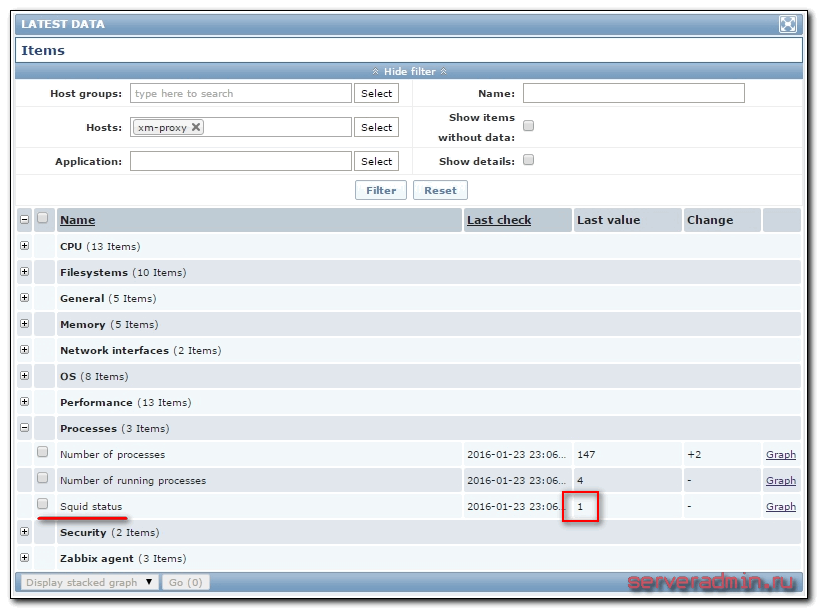
Ждем пару минут и идем в Latest data проверять поступаемые значения.
Чтобы проверить работу триггера, достаточно зайти на сервер и остановить squid. Если вы все сделали правильно, то после второй проверки, которая определит, что squid не отвечает по заданному адресу, вы получите уведомление на почту об этом. Если у вас не настроены или не работают уведомления на почту в zabbix, то читайте мою статью на эту тему.
Мониторинг локальной службы в linux
С мониторингом удаленного tcp сервиса разобрались, а что делать, если служба работает локально и к ней невозможно подключиться из вне. Тут уже не обойтись без установки zabbix агента. Если он установлен на хосте, то можно воспользоваться итемом с ключом proc.num. Этот ключ возвращает в качестве значения количество запущенных процессов. И если таких процессов больше одного, можно считать, что служба запущена.
Рассмотрим на примере мониторинга службы postgrey, реализующей greylist для борьбы со спамом. Она работает локально на почтовом сервере linux и является критическим сервисом, так как без него почтовый сервер postfix не будет принимать почту, выдавая временную ошибку почтовой системы. Проверим работу ключа proc.num:
Все в порядке, zabbix агент возвращает значение 1 при запущенном сервисе. Идем на сервер мониторинга, выбираем хост или шаблон и создаем новый item.
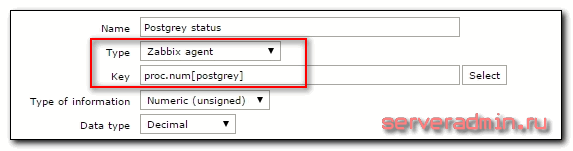
Показываю только основные параметры, остальные устанавливайте на свой вкус. Я лишь рекомендую не делать слишком частые проверки. В большинстве случаев в этом нет необходимости, а нагрузка на сервер постоянно растет при добавлении новых итемов.
Создаем триггер с оповещением о недоступности сервиса. При последних двух значениях равных 0 срабатываем.
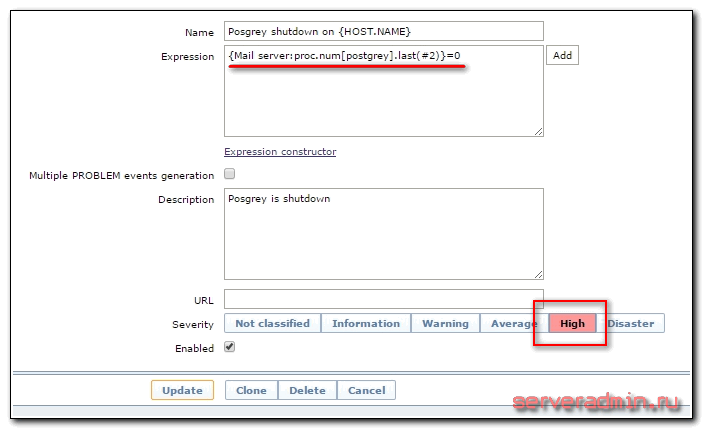
Я настраиваю триггер в шаблоне, поэтому сразу для удобства в названии триггера указываю маску для имени, чтобы было понятно в оповещении, на каком хосте сработал триггер. Как обычно, проверить поступаемые значения можно в Latest data.
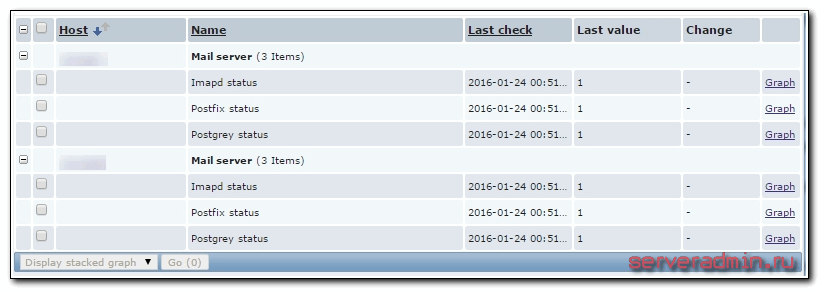
Вот и все. Мы настроили мониторинг локальных служб linux в заббиксе.
Заключение
В своем материале я рассмотрел два различных способа, с помощью которых можно мониторить любой удаленный сервис по протоколу tcp, либо локальную службу на сервере linux. Конкретно в моих примерах можно было воспользоваться вторым способом в обоих случаях. Я этого не сделал, потому что первым способом я не просто проверяю, что служба запущена, я еще и обращаюсь к ней по сети и проверяю ее корректную работу для удаленного пользователя.
Разница тут получается вот в чем. Допустим, сервер squid у вас запущен и работает на сервере. Проверка работы локальной службы показывает, что сервис работает и возвращает значение 1. Но к примеру, вы настраивали firewall и где-то ошиблись. Сервис стал недоступен по сети, пользователи не могут им пользоваться. При этом мониторинг будет показывать, что все в порядке, служба запущена, хотя реально она не может обслужить запросы пользователей. В таком случай только удаленная проверка покажет, что с доступностью сервиса проблемы и надо что-то делать.
Из этого можно сделать вывод, что система мониторинга zabbix предоставляет огромные возможности по мониторингу. Какой тип наблюдения и сбора данных подойдет в конкретном случае нужно решать на месте, исходя из сути сервиса, за которым вы наблюдаете.
Источник
Zabbix Documentation 5.4
Sidebar
Table of Contents
8. Service monitoring
Overview
Service monitoring functionality is intended for those who want to get a high-level (business) view of monitored infrastructure. In many cases, we are not interested in low-level details, like the lack of disk space, high processor load, etc. What we are interested in is the availability of service provided by our IT department. We can also be interested in identifying weak places of IT infrastructure, SLA of various IT services, the structure of existing IT infrastructure, and other information of a higher level.
Zabbix service monitoring provides answers to all mentioned questions.
Services is a hierarchy representation of monitored data.
A very simple service structure may look like:
Each node of the structure has attribute status. The status is calculated and propagated to upper levels according to the selected algorithm. At the lowest level of services are triggers. The status of individual nodes is affected by the status of their triggers.
Configuration
To configure services, go to: Configuration → Services.
On this screen you can build a hierarchy of your monitored infrastructure. The highest-level parent service is ‘root’. You can build your hierarchy downward by adding lower-level parent services and then individual nodes to them.

Click on Add child to add services. To edit an existing service, click on its name. A form is displayed where you can edit the service attributes.
Configuring a service
The Service tab contains general service attributes:

All mandatory input fields are marked with a red asterisk.
| Parameter | Description |
|---|---|
| Name | Service name. |
| Parent service | Parent service the service belongs to. |
| Status calculation algorithm | Method of calculating service status: Do not calculate — do not calculate service status Problem, if at least one child has a problem — problem status, if at least one child service has a problem Problem, if all children have problems — problem status, if all child services are having problems |
| Calculate SLA | Enable SLA calculation and display. |
| Acceptable SLA (in %) | SLA percentage that is acceptable for this service. Used for reporting. |
| Trigger | Linkage to trigger: None — no linkage trigger name — linked to the trigger, thus depends on the trigger status Services of the lowest level must be linked to triggers. (Otherwise their state will not be represented accurately.) When triggers are linked, their state prior to linking is not counted. |
| Sort order | Sort order for display, lowest comes first. |
The Dependencies tab contains services the service depends on. Click on Add to add a service from those that are configured.

Hard and soft dependency
Availability of a service may depend on several other services, not just one. The first option is to add all those directly as child services.
However, if some service is already added somewhere else in the services tree, it cannot be simply moved out of there to a child service here. How to create a dependency on it? The answer is “soft” linking. Add the service and mark the Soft check box. That way the service can remain in its original location in the tree, yet be depended upon from several other services. Services that are “soft-linked” are displayed in gray in the tree. Additionally, if a service has only “soft” dependencies, it can be deleted directly, without deleting child services first.
The Time tab contains the service time specification.
Источник
Zabbix Documentation 5.4
Sidebar
Table of Contents
2 Agent
Overview
Zabbix agent is deployed on a monitoring target to actively monitor local resources and applications (hard drives, memory, processor statistics etc).
The agent gathers operational information locally and reports data to Zabbix server for further processing. In case of failures (such as a hard disk running full or a crashed service process), Zabbix server can actively alert the administrators of the particular machine that reported the failure.
Zabbix agents are extremely efficient because of use of native system calls for gathering statistical information.
Passive and active checks
Zabbix agents can perform passive and active checks.
In a passive check the agent responds to a data request. Zabbix server (or proxy) asks for data, for example, CPU load, and Zabbix agent sends back the result.
Active checks require more complex processing. The agent must first retrieve a list of items from Zabbix server for independent processing. Then it will periodically send new values to the server.
Whether to perform passive or active checks is configured by selecting the respective monitoring item type. Zabbix agent processes items of type ‘Zabbix agent’ or ‘Zabbix agent (active)’.
Supported platforms
Zabbix agent is supported for:
Agent on UNIX-like systems
Zabbix agent on UNIX-like systems is run on the host being monitored.
Installation
See the package installation section for instructions on how to install Zabbix agent as package.
Alternatively see instructions for manual installation if you do not want to use packages.
If installed as package
Zabbix agent runs as a daemon process. The agent can be started by executing:
This will work on most of GNU/Linux systems. On other systems you may need to run:
Similarly, for stopping/restarting/viewing status of Zabbix agent, use the following commands:
Start up manually
If the above does not work you have to start it manually. Find the path to the zabbix_agentd binary and execute:
Agent on Windows systems
Zabbix agent on Windows runs as a Windows service.
Preparation
Zabbix agent is distributed as a zip archive. After you download the archive you need to unpack it. Choose any folder to store Zabbix agent and the configuration file, e. g.
Copy bin\zabbix_agentd.exe and conf\zabbix_agentd.conf files to c:\zabbix.
Edit the c:\zabbix\zabbix_agentd.conf file to your needs, making sure to specify a correct “Hostname” parameter.
Installation
After this is done use the following command to install Zabbix agent as Windows service:
Now you should be able to configure “Zabbix agent” service normally as any other Windows service.
See more details on installing and running Zabbix agent on Windows.
Other agent options
It is possible to run multiple instances of the agent on a host. A single instance can use the default configuration file or a configuration file specified in the command line. In case of multiple instances each agent instance must have its own configuration file (one of the instances can use the default configuration file).
The following command line parameters can be used with Zabbix agent:
| Parameter | Description |
|---|---|
| UNIX and Windows agent | |
| -c —config | Path to the configuration file. You may use this option to specify a configuration file that is not the default one. On UNIX, default is /usr/local/etc/zabbix_agentd.conf or as set by compile-time variables —sysconfdir or —prefix On Windows, default is c:\zabbix_agentd.conf |
| -p —print | Print known items and exit. Note: To return user parameter results as well, you must specify the configuration file (if it is not in the default location). |
| -t —test | Test specified item and exit. Note: To return user parameter results as well, you must specify the configuration file (if it is not in the default location). |
| -h —help | Display help information |
| -V —version | Display version number |
| UNIX agent only | |
| -R —runtime-control | Perform administrative functions. See runtime control . |
| Windows agent only | |
| -m —multiple-agents | Use multiple agent instances (with -i,-d,-s,-x functions). To distinguish service names of instances, each service name will include the Hostname value from the specified configuration file. |
| Windows agent only (functions) | |
| -i —install | Install Zabbix Windows agent as service |
| -d —uninstall | Uninstall Zabbix Windows agent service |
| -s —start | Start Zabbix Windows agent service |
| -x —stop | Stop Zabbix Windows agent service |
Specific examples of using command line parameters:
Runtime control
With runtime control options you may change the log level of agent processes.
| Option | Description | Target |
|---|---|---|
| log_level_increase[= ] | Increase log level. If target is not specified, all processes are affected. | Target can be specified as: process type — all processes of specified type (e.g., listener) See all agent process types. process type,N — process type and number (e.g., listener,3) pid — process identifier (1 to 65535). For larger values specify target as ‘process-type,N’. |
| log_level_decrease[= ] | Decrease log level. If target is not specified, all processes are affected. |
Agent process types
The agent log file can be used to observe these process types.
Process user
Zabbix agent on UNIX is designed to run as a non-root user. It will run as whatever non-root user it is started as. So you can run agent as any non-root user without any issues.
If you will try to run it as ‘root’, it will switch to a hardcoded ‘zabbix’ user, which must be present on your system. You can only run agent as ‘root’ if you modify the ‘AllowRoot’ parameter in the agent configuration file accordingly.
Configuration file
For details on configuring Zabbix agent see the configuration file options for zabbix_agentd or Windows agent.
Locale
Note that the agent requires a UTF-8 locale so that some textual agent items can return the expected content. Most modern Unix-like systems have a UTF-8 locale as default, however, there are some systems where that may need to be set specifically.
Exit code
Before version 2.2 Zabbix agent returned 0 in case of successful exit and 255 in case of failure. Starting from version 2.2 and higher Zabbix agent returns 0 in case of successful exit and 1 in case of failure.
Источник


