Мониторинг лог файла в Zabbix

Zabbix умет анализировать любой лог файл, сохранять его в свою базу, рассылать алерты по каким-то событиям. Я решил использовать эту возможность для анализа лог файла утилиты acpupsd для отправки оповещений об отключении электричества. Решается данная задача стандартным функционалом заббикса, описанного в документации.
Введение
Ранее я рассказывал об использовании утилиты управления упсами марки apc — apcupsd. Я показал, как установить apcupsd на hyper-v и xenserver для корректного завершения работы при отключении электричества. Рекомендую ознакомиться, если вас интересует этот вопрос. Его не всегда получается быстро и удобно решить. На помощь приходит apcupsd.
Указанные конфигурации у меня успешно работают, проверено годами. Я решил настроить отправку оповещений на почту через zabbix при пропадании электричества. Да и просто хочется хранить информацию об инцидентах в одном месте. Почтовые сообщения не всегда будут доставлены, нужно следить, чтобы на резервное питание были подключены все устройства, которые обеспечивают связь с интернетом. Частенько бывает, что при выключении электричества у провайдера так же выключается оборудование и связи нет. Либо ваш свитч, к которому подключен сервер, выключится и сообщение не будет доставлено.
Заранее позаботьтесь об этих вещах. Пишу об этом, потому что сам недавно на одном объекте все запитал от упсов, но забыл про свитч. В итоге об отключении электричества я узнал уже после того, как его вернули назад и сервера автоматически поднялись. Если у вас еще не настроен сервер мониторинга, рекомендую мою подробную статью с видео об установке и настройке zabbix на centos 9 или установка zabbix 3.4 на debian 9.
Настройка мониторинга логов
Для того, чтобы мониторить лог файл, на сервере должен быть установлен zabbix agent, а сам сервер добавлен в панель мониторинга. Я буду следить за логом программы apcupsd, который располагается по пути /var/log/apcupsd.events. Идем в веб интерфейс заббикса и добавляем новый итем к интересующему нас хосту. Если у вас таких будет несколько, то создавайте сразу шаблон. В моем случае у меня один сервер, поэтому я буду добавлять новый элемент сразу на него.
Создаем новый итем со следующими параметрами:
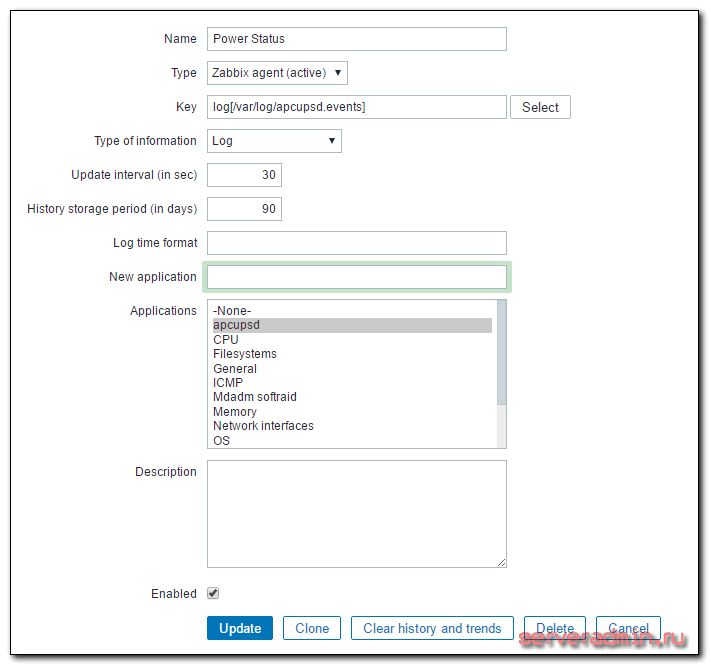
| Name | Имя нового итема. Можете указать любое название. |
| Type | Тип элемента. Обязательно выбираем Zabbix agent (active). По-умолчанию будет другой тип стоять. |
| Key | Ключ данных, log — тип, в квадратных скобках путь до лог файла. |
| Type of information | Указываем тип информации, поступающей в итем. |
Остальные параметры оставляете на свое усмотрение. Рекомендую время обновления итема ставить поменьше, чтобы оперативно получить информацию об инциденте. У меня стоит 30 секунд.
После того, как вы сохраните новый итем, через несколько минут начнут поступать данные. Проверять их как обычно в Latest data. В данной конфигурации будут сохраняться все строки из файла. В моем случае это не страшно, так как записей будет очень мало. Они создаются только по событиям в электро сети, а они случаются редко, поэтому я не стал делать фильтр по строкам или словам.
Но это только пол дела. Мы стали собирать логи, теперь нам нужно настроить отправку оповещения при пропадании электричества.
Создание триггера на событие из лога
Мы будем слать оповещение не только в момент отключения электричества, но и тогда, когда оно снова появится. Так что в триггере будут два условия:
- Условие активации события.
- И условие его прекращения.
Открываем вкладку с триггерами хоста и добавляем туда новый триггер со следующими параметрами:
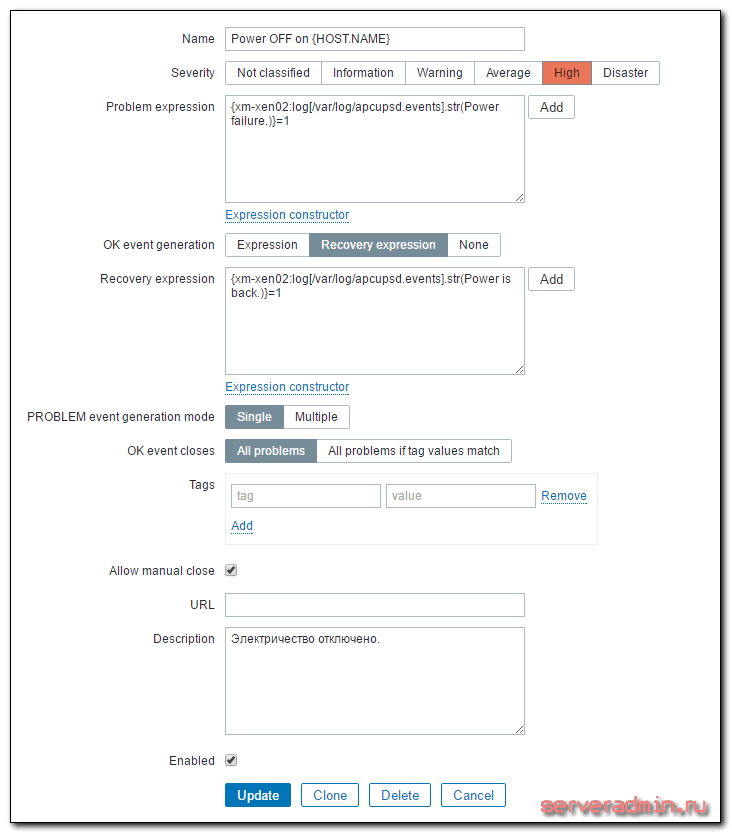
| Name | Имя триггера. Может быть любым. |
| Problem expression | |
| Recovery expression |
Рассказываю подробнее, что тут написано. xm-xen02 — имя сервера. Power failure. — строка в лог файле, которая появляется при отключении электричества. Когда оно возвращается, появляется запись Power is back. В общем виде лог выглядит примерно следующим образом:
Становится понятно, почему я взял именно эти строки. На этом все. После сохранения триггера он начнет работать и следить за итемом, который собирает строки из лога. Как только появятся строки, попадающие под условие, вы получите оповещение.
Заключение
Отладить работу оповещения об отключении электричества достаточно трудно, так как дергать по этому поводу шнур с питанием не хочется. Я пошел другим путем. Во время отладки использовал общий лог файл /var/log/messages и останавливал службу chronyd. Во время остановки, она пишет информацию об этом в лог файл, а при запуске так же сообщает, что запустилась. Я просто настроил итем и триггер на нужные строки и убедился, что все работает как надо. После этого уже сделал по аналогии итемы и триггеры для apcupsd. Рекомендую поступить похожим образом и потестировать функционал.
Zabbix Documentation 3.0
Sidebar
Table of Contents
Windows-specific item keys
Item keys
The table provides details on the item keys that you can use with Zabbix Windows agent only.
| Key | ||||
|---|---|---|---|---|
| Description | Return value | Parameters | Comments | |
| eventlog[name, , , , , , ] | ||||
| Event log monitoring. | Log | name — name of event log regexp — regular expression describing the required pattern severity — regular expression describing severity This parameter accepts the following values: “Information”, “Warning”, “Error”, “Critical”, “Verbose” (since Zabbix 2.2.0 running on Windows Vista or newer) source — regular expression describing source identifier (regular expression is supported since Zabbix 2.2.0) eventid — regular expression describing the event identifier(s) maxlines — maximum number of new lines per second the agent will send to Zabbix server or proxy. This parameter overrides the value of ‘MaxLinesPerSecond’ in zabbix_agentd.win.conf mode — possible values: all (default), skip — skip processing of older data (affects only newly created items). | The item must be configured as an active check. | |
Examples:
⇒ eventlog[Application]
⇒ eventlog[Security,,»Failure Audit»,,^(529|680)$]
⇒ eventlog[System,,»Warning|Error»]
⇒ eventlog[System. ^1$]
⇒ eventlog[System. @TWOSHORT] — here a custom regular expression named TWOSHORT is referenced (defined as a Result is TRUE type, the expression itself being ^1$|^70$ ).
Note that the agent is unable to send in events from the «Forwarded events» log.
The mode parameter is supported since Zabbix 2.0.0.
“Windows Eventing 6.0” is supported since Zabbix 2.2.0.
Note that selecting a non-Log type of information for this item will lead to the loss of local timestamp, as well as log severity and source information.
See also additional information on log monitoring.
Note that enabling/disabling some components may change their ordering in the Windows interface name.
Some Windows versions (for example, Server 2008) might require the latest updates installed to support non-ASCII characters in interface names.
interval — last N seconds for storing the average value.
The interval must be between 1 and 900 seconds (included) and the default value is 1.
See also: Windows performance counters.
attribute — requested process attribute
type — representation type (meaningful when more than one process with the same name exists)
vmsize (default) — size of process virtual memory in Kbytes
wkset — size of process working set (amount of physical memory used by process) in Kbytes
pf — number of page faults
ktime — process kernel time in milliseconds
utime — process user time in milliseconds
io_read_b — number of bytes read by process during I/O operations
io_read_op — number of read operation performed by process
io_write_b — number of bytes written by process during I/O operations
io_write_op — number of write operation performed by process
io_other_b — number of bytes transferred by process during operations other than read and write operations
io_other_op — number of I/O operations performed by process, other than read and write operations
gdiobj — number of GDI objects used by process
userobj — number of USER objects used by process
Valid types are:
avg (default) — average value for all processes named
min — minimum value among all processes named
max — maximum value among all processes named
sum — sum of values for all processes named
Examples:
⇒ proc_info[iexplore.exe,wkset,sum] — to get the amount of physical memory taken by all Internet Explorer processes
⇒ proc_info[iexplore.exe,pf,avg] — to get the average number of page faults for Internet Explorer processes
Note that on a 64-bit system, a 64-bit Zabbix agent is required for this item to work correctly.
Note: io_*, gdiobj and userobj attributes are available only on Windows 2000 and later versions of Windows, not on Windows NT 4.0.
]
String — with param as displayname, path, user
Text — with param as description
Specifically for state:
0 — running,
1 — paused,
2 — start pending,
3 — pause pending,
4 — continue pending,
5 — stop pending,
6 — stopped,
7 — unknown,
255 — no such service
Specifically for startup:
0 — automatic,
1 — automatic delayed,
2 — manual,
3 — disabled,
4 — unknown
param — state (default), displayname, path, user, startup or description
⇒ service.info[SNMPTRAP] — state of the SNMPTRAP service
⇒ service.info[SNMP Trap] — state of the same service, but with display name specified
⇒ service.info[EventLog,startup] — startup type of the EventLog service
Items service.info[service,state] and service.info[service] will return the same information.
Note that only with param as state this item returns a value for non-existing services (255).
This item is supported since Zabbix 3.0.0. It should be used instead of the deprecated service_state[service] item.
Text — list of services separated by a newline
state — all (default), stopped, started, start_pending, stop_pending, running, continue_pending, pause_pending or paused
exclude — services to exclude from the result. Excluded services should be listed in double quotes, separated by comma, without spaces.
⇒ services[,started] — list of started services
⇒ services[automatic, stopped] — list of stopped services, that should be run
⇒ services[automatic, stopped, «service1,service2,service3»] — list of stopped services, that should be run, excluding services with names service1, service2 and service3
The exclude parameter is supported since Zabbix 1.8.1.
query — WMI query returning a single object
⇒ wmi.get[root\cimv2,select status from Win32_DiskDrive where Name like ‘%PHYSICALDRIVE0%’] — returns the status of the first physical disk.
This key is supported since Zabbix 2.2.0.
Float — for percentage
available (available virtual memory), pavailable (available virtual memory, in percent), pused (used virtual memory, in percent), total (total virtual memory, default), used (used virtual memory)
⇒ vm.vmemory.size[pavailable] → available virtual memory, in percentage
Monitoring of virtual memory statistics is based on:
* Total virtual memory on Windows (total physical + page file size);
* The maximum amount of memory Zabbix agent can commit;
* The current committed memory limit for the system or Zabbix agent, whichever is smaller.
This key is supported since Zabbix 3.0.7.
Monitoring Windows services
This tutorial provides step-by-step instructions for setting up the monitoring of Windows services. It is assumed that Zabbix server and agent are configured and operational.
Step 1
Get the service name.
You can get that name by going to MMC Services snap-in and bringing up the properties of the service. In the General tab you should see a field called ‘Service name’. The value that follows is the name you will use when setting up an item for monitoring.
For example, if you wanted to monitor the “workstation” service then your service might be: lanmanworkstation.
Step 2
Configure an item for monitoring the service.
The item service.info[service,
] retrieves the information about a particular service. Depending on the information you need, specify the param option which accepts the following values: displayname, state, path, user, startup or description. The default value is state if param is not specified (service.info[service]).
The type of return value depends on chosen param: integer for state and startup; character string for displayname, path and user; text for description.
Two value maps are available Windows service state and Windows service startup type to map a numerical value to a text representation in the Frontend.
Discovery of Windows services
Low-level discovery provides a way to automatically create items, triggers, and graphs for different entities on a computer. Zabbix can automatically start monitoring Windows services on your machine, without the need to know the exact name of a service or create items for each service manually. A filter can be used to generate real items, triggers, and graphs only for services of interest.


