Сегодня мы расскажем о том, как мы ведем мониторинг Windows систем (в скором времени планируем такой же обзор про Linux и как обычно с доступным шаблоном).
Наш путь начался, как часто бывает, со штатного шаблона Zabbix «Template OS Windows Active» для мониторинга Windows-клиентов (рабочие станции и сервера), но ровно через неделю активного использования поняли, в нем много чего не хватает.
Так мы и начали его кардинальную переделку, часть оставили и добавили много чего нового.
Общая концепция
1. Отдельные настройки шаблона в файле os_windows_active.conf
2. Отдельный скрипт PowerShell — os_windows_active.ps1 для работы шаблона, при этом скрипт должен быть универсальным и работать на большинстве операционных систем с минимумом внешних зависимостей.
3. Шаблон должен быть не зависимым от языка операционной системы, поэтому лучше всего снимать данные со счётчиков используя либо WMI, либо скрипт + zabbix trapper.
4. Шаблон должен давать максимум полезной информации по своему назначению, поэтому он объединяется как мониторинг физических параметров оборудования, так и операционной системы и даже инвентаризации.
Основные возможности
логических дисков;
физических дисков;
сетевых адаптеров;
системных сервисов.
Triggers
Мы включили и оттестировали, только самые критичные триггеры, которые реально показывают проблемы. Но добавили и некоторых других, для более детальной информации.
Продолжительная нагрузка на процессор в течении часа.
Physical Memory
Объём доступной физической памяти меньше заданного лимита;
Объём Commited памяти больше физической.
Physical disk
Скорость доступа к дискам на чтение и запись.
Logical disk
Критический объём дисков с возможностью прогноза на 12 часов.
Network
Смена MAC-адреса сетевого адаптера (для виртуальных машин очень актуально, если не поставили статический MAC-адрес);
Отключение Link-а сетевого адаптера;
Отброшенные пакеты на сетевом адаптере.
Operation system
Дата последней установки обновлений Windows
Изменение статуса Firewall
Инвентаризация
Так как клиенты имеют разные компьютеры, нам требуется получать краткую инвентаризацию по ним, поэтому мы добавили в шаблон сбор данных о компьютере, и этими данными заполняем стандартные поля Zabbix Inventory:
OS
tag
Chassis
Desktop
Model
HW architecture
Vendor
Host networks
Графики
Мы сделали несколько полезных общих графиков, чтобы наглядно видеть общее состояние клиента и отдельных его подсистем.
OS overview performance
OS detail performance
Где скачать
Данный шаблон и скрипт вы можете бесплатно скачать с GitHub, а также в Zabbix Share.
Наши шаблоны мы продолжим выкладываем в открытый доступ в наш репозитарий Zabbix.
Системное администрирование серверов и DevOps
Шаблоны Windows в ZABBIX
Шаблоны Windows в ZABBIX отличаются главным образом использованием специфическими для этой ОС счетчиками производительности. Счетчики представляют из себя встроенное средство анализа основных показателей операционной системы, некоторого программного обеспечения, а также аппаратных ресурсов. Подавляющее большинство серьезных систем мониторинга умеют использовать эти счетчики, вот и ZABBIX не исключение . В этой статье я постараюсь рассказать об основных «подводных камнях», встретившихся мне при работе с этим инструментом.
Вводная статья по шаблонам мониторинга ZABBIX — Шаблоны ZABBIX.
Если вам интересна тематика ZABBIX, рекомендую обратиться к основной статье — Система мониторинга ZABBIX, в ней вы найдете дополнительную информацию.
Шаблоны Windows — нюансы
Прочитав документацию ZABBIX касательно настройки счетчиков (кому интересно, глава «6 Счетчики производительности Windows«), я поразился насколько все просто и был удивлен столь богатой функциональностью, но не тут то было… Поначалу я пользовался встроенными в систему шаблонами, но в итоге на некоторых узлах сети счетчики у меня работали, а на некоторых данные просто не приходили не по одному ключу. В конечном счете я решил пройти процесс создания ключа данных с использованием счетчика Windoows с самого начала и до момента пока не увижу красивые графики с необходимой мне информацией.
В руководстве все просто:
Вы можете эффективно мониторить счетчики производительности Windows используя ключ perf_counter[]. Например: perf_counter[«\Processor(0)\Interrupts/sec»] или perf_counter[«\Processor(0)\Interrupts/sec», 10]
Но почему счетчики работают не на каждом узле сети? Ответ тоже прост:
В зависимости от настроек местоположения, именования счетчиков производительности могут быть разными на разных серверах Windows. Это может ввести определенные проблемы при создании шаблонов для Windows, имеющих разные настройки местоположения. Каждый счетчик производительности может быть переведен в цифровую форму, которая является уникальной и независимой от языковых настроек, так что вы можете использовать числовое представление, а не строковое. Для того чтобы найти цифровые эквиваленты, выполните regedit, а затем найдите HKEY_LOCAL_MACHINE\SOFTWARE\Microsoft\Windows NT\CurrentVersion\Perflib\009.
Напрашивается следующий вывод: буквенное представление счетчиков работает только на системе с языком, который аналогичен языку счетчиков в вашем шаблоне. В итоге я решил использовать только цифровое представление и перевести все необходимые мне данные на эту форму.
С переводом все элементарно: просто ищем необходимый ключ реестра (см. выше), выгружаем данные в любой текстовый файл и ищем необходимые ключи:
Здесь вы можете найти соответствующие числа для каждой части строки счетчика производительности, как для ‘\System\% Processor Time’: System -> 2 % Processor Time -> 6 Затем используйте эти числа для преобразования пути в числа: \2\6
UPD: 2016.05.19: есть некоторые неприятные нюансы, подробнее см. в Изменения счетчиков производительности CPU
Но тут меня ждал сюрприз: на некоторых серверах с использованием большого количества ролей я находил в этом файле несколько ключей данных! Какой из них выбрать, какой будет правильным? Я определил для себя следующие правила: поскольку счетчик состоит из двух параметров, надо найти сначала первый (ваш Кэп), запомнить примерное месторасположение в файле, а потом найти второй и если он будет выше первого по месторасположению, то игнорировать его; если же сразу после месторасположения первого мы найдем ниже него несколько одинаковых вторых ключей, то нам будет нужен ближайший к первому второй ключ. Подобная логика должна вам помочь выбрать правильный ключ данных. В противном случае получаемая информация будет некорректная или в ней не будет смысла, либо вы вообще не получите никаких данных. Нигде в интернете этого я почему-то не нашел, видимо авторы статей не слишком сильно углублялись в мониторинг счетчиков.
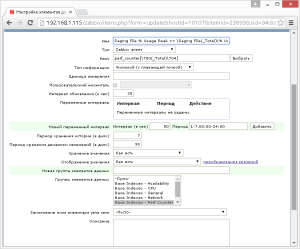
Далее. Следующий неприятный момент в этой системе мониторинга — это типы данных элементов мониторинга. В принципе все просто, но вы должны помнить, что тип данных автоматически не определяется и вы должны определить его самостоятельно и, что самое главное, при неправильном выборе вы останетесь без данных, они просто не будут приниматься. В случае со счетчиками производительности вам будет нужен исключительно «Числовой (с плавающей точкой)» как показано на скриншоте ниже:
Чтобы уяснить это простое правило, несколько лет назад у меня ушла куча времени и я дошел почти до отчаяния, ведь не знал ни основные проблемы при настройке, ни методики «траблшутинга». В таких случаях есть одно проверенное средство — zabbix_get, рекомендую использовать его всякий раз. когда вы находитесь в тупике.
В принципе это все, что я и хотел сказать. В интернете куча статей на тему «zabbix счетчики производительности» и копировать я их не намерен, я лишь хочу поделиться основным опытом в решении ранее казалось бы тупиковых проблем. Мало кто ставит целью не изобретение велосипеда, а описание рассуждений и логики мышления при решении обыденных для них задач, но ведь информации в интернете сейчас масса, а вырабатыванию подхода не учит почти никто.
Zabbix + Windows
Windows
Microsoft Windows is a group of several graphical operating system families, all of which are developed, marketed, and sold by Microsoft.
Available solutions
Windows CPU by Zabbix agent
Overview
For Zabbix version: 5.4 and higher
Setup
Refer to the vendor documentation.
Zabbix configuration
No specific Zabbix configuration is required.
Macros used
The critical threshold of the % Interrupt Time counter.
The threshold of the % Privileged Time counter.
The threshold of the Processor Queue Length counter.
The critical threshold of the CPU utilization in %.
Template links
There are no template links in this template.
Discovery rules
Items collected
Group
Name
Description
Type
Key and additional info
CPU
CPU utilization
CPU utilization in %
ZABBIX_PASSIVE
system.cpu.util
CPU
CPU interrupt time
The Processor Information\% Interrupt Time is the time the processor spends receiving and servicing
hardware interrupts during sample intervals. This value is an indirect indicator of the activity of
devices that generate interrupts, such as the system clock, the mouse, disk drivers, data communication
lines, network interface cards and other peripheral devices. This is an easy way to identify a potential
hardware failure. This should never be higher than 20%.
Context Switches/sec is the combined rate at which all processors on the computer are switched from one thread to another.
Context switches occur when a running thread voluntarily relinquishes the processor, is preempted by a higher priority ready thread, or switches between user-mode and privileged (kernel) mode to use an Executive or subsystem service.
It is the sum of Thread\Context Switches/sec for all threads running on all processors in the computer and is measured in numbers of switches.
There are context switch counters on the System and Thread objects. This counter displays the difference between the values observed in the last two samples, divided by the duration of the sample interval.
ZABBIX_PASSIVE
perf_counter_en[«\System\Context Switches/sec»]
CPU
CPU privileged time
The Processor Information\% Privileged Time counter shows the percent of time that the processor is spent
executing in Kernel (or Privileged) mode. Privileged mode includes services interrupts inside Interrupt
Service Routines (ISRs), executing Deferred Procedure Calls (DPCs), Device Driver calls and other kernel-mode
The Processor Information\% User Time counter shows the percent of time that the processor(s) is spent executing
ZABBIX_PASSIVE
perf_counter_en[«\Processor Information(_total)\% User Time»]
CPU
Number of cores
The number of logical processors available on the computer.
ZABBIX_PASSIVE
wmi.get[root/cimv2,»Select NumberOfLogicalProcessors from Win32_ComputerSystem»]
CPU
CPU queue length
The Processor Queue Length shows the number of threads that are observed as delayed in the processor Ready Queue
and are waiting to be executed.
ZABBIX_PASSIVE
perf_counter_en[«\System\Processor Queue Length»]
Triggers
Name
Description
Expression
Severity
Dependencies and additional info
High CPU utilization (over <$CPU.UTIL.CRIT>% for 5m)
CPU utilization is too high. The system might be slow to respond.
>
WARNING
CPU interrupt time is too high (over <$CPU.INTERRUPT.CRIT.MAX>% for 5m)
«The CPU Interrupt Time in the last 5 minutes exceeds <$CPU.INTERRUPT.CRIT.MAX>%.»
The Processor Information\% Interrupt Time is the time the processor spends receiving and servicing
hardware interrupts during sample intervals. This value is an indirect indicator of the activity of
devices that generate interrupts, such as the system clock, the mouse, disk drivers, data communication
lines, network interface cards and other peripheral devices. This is an easy way to identify a potential
hardware failure. This should never be higher than 20%.
Depends on:
— High CPU utilization (over <$CPU.UTIL.CRIT>% for 5m)
CPU privileged time is too high (over <$CPU.PRIV.CRIT.MAX>% for 5m)
The CPU privileged time in the last 5 minutes exceeds <$CPU.PRIV.CRIT.MAX>%.
Depends on:
— CPU interrupt time is too high (over <$CPU.INTERRUPT.CRIT.MAX>% for 5m)
— High CPU utilization (over <$CPU.UTIL.CRIT>% for 5m)
CPU queue length is too high (over <$CPU.QUEUE.CRIT.MAX>for 5m)
The CPU Queue Length in the last 5 minutes exceeds <$CPU.QUEUE.CRIT.MAX>. According to actual observations, PQL should not exceed the number of cores * 2. To fine-tune the conditions, use the macro <$CPU.QUEUE.CRIT.MAX >.
Depends on:
— High CPU utilization (over <$CPU.UTIL.CRIT>% for 5m)
Feedback
Please report any issues with the template at https://support.zabbix.com
Windows memory by Zabbix agent
Overview
For Zabbix version: 5.4 and higher
Setup
Refer to the vendor documentation.
Zabbix configuration
No specific Zabbix configuration is required.
Macros used
The warning threshold of the Memory Pages/sec counter.
The warning threshold of the Free System Page Table Entries counter.
This indicates the number of page table entries not currently in use by the system. If the number is less
than 5,000, there may well be a memory leak or you running out of memory.
ZABBIX_PASSIVE
perf_counter_en[«\Memory\Free System Page Table Entries»]
Memory
Memory page faults per second
Page Faults/sec is the average number of pages faulted per second. It is measured in number of pages
faulted per second because only one page is faulted in each fault operation, hence this is also equal
to the number of page fault operations. This counter includes both hard faults (those that require
disk access) and soft faults (where the faulted page is found elsewhere in physical memory.) Most
processors can handle large numbers of soft faults without significant consequence. However, hard faults,
which require disk access, can cause significant delays.
ZABBIX_PASSIVE
perf_counter_en[«\Memory\Page Faults/sec»]
Memory
Memory pages per second
This measures the rate at which pages are read from or written to disk to resolve hard page faults.
If the value is greater than 1,000, as a result of excessive paging, there may be a memory leak.
ZABBIX_PASSIVE
perf_counter_en[«\Memory\Pages/sec»]
Memory
Memory pool non-paged
This measures the size, in bytes, of the non-paged pool. This is an area of system memory for objects
that cannot be written to disk but instead must remain in physical memory as long as they are allocated.
There is a possible memory leak if the value is greater than 175MB (or 100MB with the /3GB switch).
A typical Event ID 2019 is recorded in the system event log.
ZABBIX_PASSIVE
perf_counter_en[«\Memory\Pool Nonpaged Bytes»]
Triggers
Name
Description
Expression
Severity
Dependencies and additional info
High memory utilization (><$MEMORY.UTIL.MAX>% for 5m)
The system is running out of free memory.
>
AVERAGE
High swap space usage (less than <$SWAP.PFREE.MIN.WARN>% free)
This trigger is ignored, if there is no swap configured
Depends on:
— High memory utilization (><$MEMORY.UTIL.MAX>% for 5m)
Number of free system page table entries is too low (less <$MEM.PAGE_TABLE_CRIT.MIN>for 5m)
The Memory Free System Page Table Entries is less than <$MEM.PAGE_TABLE_CRIT.MIN>for 5 minutes. If the number is less than 5,000, there may well be a memory leak.
Depends on:
— High memory utilization (><$MEMORY.UTIL.MAX>% for 5m)
The Memory Pages/sec is too high (over <$MEM.PAGE_SEC.CRIT.MAX>for 5m)
The Memory Pages/sec in the last 5 minutes exceeds <$MEM.PAGE_SEC.CRIT.MAX>. If the value is greater than 1,000, as a result of excessive paging, there may be a memory leak.
Depends on:
— High memory utilization (><$MEMORY.UTIL.MAX>% for 5m)
Feedback
Please report any issues with the template at https://support.zabbix.com
Windows filesystems by Zabbix agent
Overview
For Zabbix version: 5.4 and higher
Setup
Refer to the vendor documentation.
Zabbix configuration
No specific Zabbix configuration is required.
Macros used
This macro is used in filesystems discovery. Can be overridden on the host or linked template level.
This macro is used in filesystems discovery. Can be overridden on the host or linked template level.
This macro is used in filesystems discovery. Can be overridden on the host or linked template level.
This macro is used in filesystems discovery. Can be overridden on the host or linked template level.
This macro is used in filesystems discovery. Can be overridden on the host or linked template level.
This macro is used in filesystems discovery. Can be overridden on the host or linked template level.
The critical threshold of the filesystem utilization in percent.
The warning threshold of the filesystem utilization in percent.
Template links
There are no template links in this template.
Discovery rules
Name
Description
Type
Key and additional info
Mounted filesystem discovery
Discovery of file systems of different types.
ZABBIX_PASSIVE
vfs.fs.discovery
Filter:
Items collected
Group
Name
Description
Type
Key and additional info
Filesystems
<#FSNAME>: Used space
Used storage in Bytes
ZABBIX_PASSIVE
vfs.fs.size[<#FSNAME>,used]
Filesystems
<#FSNAME>: Total space
Total space in Bytes
ZABBIX_PASSIVE
vfs.fs.size[<#FSNAME>,total]
Filesystems
<#FSNAME>: Space utilization
Space utilization in % for
ZABBIX_PASSIVE
vfs.fs.size[<#FSNAME>,pused]
Triggers
Name
Description
Expression
Severity
Dependencies and additional info
<#FSNAME>: Disk space is critically low (used > <$VFS.FS.PUSED.MAX.CRIT:"<#FSNAME>«>%)
Two conditions should match: First, space utilization should be above <$VFS.FS.PUSED.MAX.CRIT:"<#FSNAME>«>.
Second condition should be one of the following:
— The disk free space is less than 5G.
— The disk will be full in less than 24 hours.
,pused].last()>><$VFS.FS.PUSED.MAX.CRIT:"<#FSNAME>«> and ((,total].last()>-,used].last()>)
AVERAGE
Manual close: YES
Two conditions should match: First, space utilization should be above <$VFS.FS.PUSED.MAX.WARN:"<#FSNAME>«>.
Second condition should be one of the following:
— The disk free space is less than 10G.
— The disk will be full in less than 24 hours.
,pused].last()>><$VFS.FS.PUSED.MAX.WARN:"<#FSNAME>«> and ((,total].last()>-,used].last()>)
WARNING
Manual close: YES
Depends on:
Feedback
Please report any issues with the template at https://support.zabbix.com
Windows physical disks by Zabbix agent
Overview
For Zabbix version: 5.4 and higher
Setup
Refer to the vendor documentation.
Zabbix configuration
No specific Zabbix configuration is required.
Macros used
This macro is used in physical disks discovery. Can be overridden on the host or linked template level.
This macro is used in physical disks discovery. Can be overridden on the host or linked template level.
Disk read average response time (in s) before the trigger would fire.
The warning threshold of disk time utilization in percent.
Disk write average response time (in s) before the trigger would fire.
Current average disk queue, the number of requests outstanding on the disk at the time the performance data is collected.
ZABBIX_PASSIVE
perf_counter_en[«\PhysicalDisk(<#DEVNAME>)\Current Disk Queue Length»,60]
Storage
<#DEVNAME>: Disk utilization
This item is the percentage of elapsed time that the selected disk drive was busy servicing read or writes requests.
ZABBIX_PASSIVE
perf_counter_en[«\PhysicalDisk(<#DEVNAME>)\% Disk Time»,60]
Storage
<#DEVNAME>: Disk read request avg waiting time
The average time for read requests issued to the device to be served. This includes the time spent by the requests in queue and the time spent servicing them.
ZABBIX_PASSIVE
perf_counter_en[«\PhysicalDisk(<#DEVNAME>)\Avg. Disk sec/Read»,60]
Storage
<#DEVNAME>: Disk write request avg waiting time
The average time for write requests issued to the device to be served. This includes the time spent by the requests in queue and the time spent servicing them.
ZABBIX_PASSIVE
perf_counter_en[«\PhysicalDisk(<#DEVNAME>)\Avg. Disk sec/Write»,60]
Storage
<#DEVNAME>: Average disk read queue length
Average disk read queue, the number of requests outstanding on the disk at the time the performance data is collected.
ZABBIX_PASSIVE
perf_counter_en[«\PhysicalDisk(<#DEVNAME>)\Avg. Disk Read Queue Length»,60]
Storage
<#DEVNAME>: Average disk write queue length
Average disk write queue, the number of requests outstanding on the disk at the time the performance data is collected.
ZABBIX_PASSIVE
perf_counter_en[«\PhysicalDisk(<#DEVNAME>)\Avg. Disk Write Queue Length»,60]
Triggers
Name
Description
Expression
Severity
Dependencies and additional info
<#DEVNAME>: Disk is overloaded (util > <$VFS.DEV.UTIL.MAX.WARN>% for 15m)
The disk appears to be under heavy load
Manual close: YES
Depends on:
— <#DEVNAME>: Disk read request responses are too high (read > <$VFS.DEV.READ.AWAIT.WARN:"<#DEVNAME>«>s for 15m
— <#DEVNAME>: Disk write request responses are too high (write > <$VFS.DEV.WRITE.AWAIT.WARN:"<#DEVNAME>«>s for 15m)
<#DEVNAME>: Disk read request responses are too high (read > <$VFS.DEV.READ.AWAIT.WARN:"<#DEVNAME>«>s for 15m
This trigger might indicate disk <#DEVNAME>saturation.
)\Avg. Disk sec/Read»,60].min(15m)> > <$VFS.DEV.READ.AWAIT.WARN:"<#DEVNAME>«>
WARNING
Manual close: YES
<#DEVNAME>: Disk write request responses are too high (write > <$VFS.DEV.WRITE.AWAIT.WARN:"<#DEVNAME>«>s for 15m)
This trigger might indicate disk <#DEVNAME>saturation.
)\Avg. Disk sec/Write»,60].min(15m)> > <$VFS.DEV.WRITE.AWAIT.WARN:"<#DEVNAME>«>
WARNING
Manual close: YES
Feedback
Please report any issues with the template at https://support.zabbix.com
Windows generic by Zabbix agent
Overview
For Zabbix version: 5.4 and higher
Setup
Refer to the vendor documentation.
Zabbix configuration
No specific Zabbix configuration is required.
Macros used
The threshold for difference of system time in seconds.
Template links
There are no template links in this template.
Discovery rules
Items collected
Group
Name
Description
Type
Key and additional info
General
System local time
System local time of the host.
ZABBIX_PASSIVE
system.localtime
General
System name
System host name.
ZABBIX_PASSIVE
system.hostname
Preprocessing:
System description of the host.
ZABBIX_PASSIVE
system.uname
Preprocessing:
The number of processes.
ZABBIX_PASSIVE
proc.num[]
General
Number of threads
The number of threads used by all running processes.
ZABBIX_PASSIVE
perf_counter_en[«\System\Threads»]
Inventory
Operating system architecture
Operating system architecture of the host.
ZABBIX_PASSIVE
system.sw.arch
Preprocessing:
System uptime in ‘N days, hh:mm:ss’ format.
ZABBIX_PASSIVE
system.uptime
Triggers
Name
Description
Expression
Severity
Dependencies and additional info
System time is out of sync (diff with Zabbix server > <$SYSTEM.FUZZYTIME.MAX>s)
The host system time is different from the Zabbix server time.
Manual close: YES
System name has changed (new name: )
System name has changed. Ack to close.
Manual close: YES
Host has been restarted (uptime
WARNING
Manual close: YES
Feedback
Please report any issues with the template at https://support.zabbix.com
Windows network by Zabbix agent
Overview
For Zabbix version: 5.4 and higher
Setup
Refer to the vendor documentation.
Zabbix configuration
No specific Zabbix configuration is required.
Macros used
This macro is used in Network interface discovery. Can be overridden on the host or linked template level.
This macro is used in Network interface discovery. Can be overridden on the host or linked template level.
This macro is used in Network interface discovery. Can be overridden on the host or linked template level.
This macro is used in Network interface discovery. Can be overridden on the host or linked template level.
This macro is used in Network interface discovery. Can be overridden on the host or linked template level.
This macro is used in Network interface discovery. Can be overridden on the host or linked template level.
wmi.getall[root\cimv2,»select Name,Description,NetConnectionID,Speed,AdapterTypeId,NetConnectionStatus from win32_networkadapter where PhysicalAdapter=True and NetConnectionStatus>0″]
Triggers
Name
Description
Expression
Severity
Dependencies and additional info
Interface <#IFNAME>(<#IFALIAS>): High bandwidth usage (> <$IF.UTIL.MAX:"<#IFNAME>«>% )
The network interface utilization is close to its estimated maximum bandwidth.
(«].avg(15m)>>(<$IF.UTIL.MAX:"<#IFNAME>«>/100)*«].last()> or «].avg(15m)>>(<$IF.UTIL.MAX:"<#IFNAME>«>/100)*«].last()>) and «].last()>>0
«].avg(15m)>
WARNING
Manual close: YES
Depends on:
Interface <#IFNAME>(<#IFALIAS>): High error rate (> <$IF.ERRORS.WARN:"<#IFNAME>«> for 5m)
Recovers when below 80% of <$IF.ERRORS.WARN:"<#IFNAME>«> threshold
«,errors].min(5m)>><$IF.ERRORS.WARN:"<#IFNAME>«> or «,errors].min(5m)>><$IF.ERRORS.WARN:"<#IFNAME>«>
«,errors].max(5m)>
WARNING
Manual close: YES
Depends on:
Interface <#IFNAME>(<#IFALIAS>): Ethernet has changed to lower speed than it was before
This Ethernet connection has transitioned down from its known maximum speed. This might be a sign of autonegotiation issues. Ack to close.
Manual close: YES
Depends on:
This trigger expression works as follows:
1. Can be triggered if operations status is down.
2. <$IFCONTROL:\"<#IFNAME>\»>=1 — user can redefine Context macro to value — 0. That marks this interface as not important.
No new trigger will be fired if this interface is down.
3. =1) — trigger fires only if operational status is different from Connected(2).
WARNING: if closed manually — won’t fire again on next poll, because of .diff.
<$IFCONTROL:"<#IFNAME>«>=1 and («].last()><>2 and «].diff()>=1)
«].last()>=2 or <$IFCONTROL:"<#IFNAME>«>=0
AVERAGE
Manual close: YES
Feedback
Please report any issues with the template at https://support.zabbix.com
Windows services by Zabbix agent
Overview
For Zabbix version: 5.4 and higher Special version of services template that is required for Windows OS.
Setup
Refer to the vendor documentation.
Zabbix configuration
No specific Zabbix configuration is required.
Macros used
This macro is used in Service discovery. Can be overridden on the host or linked template level.
This macro is used in Service discovery. Can be overridden on the host or linked template level.
Context Switches/sec is the combined rate at which all processors on the computer are switched from one thread to another.
Context switches occur when a running thread voluntarily relinquishes the processor, is preempted by a higher priority ready thread, or switches between user-mode and privileged (kernel) mode to use an Executive or subsystem service.
It is the sum of Thread\Context Switches/sec for all threads running on all processors in the computer and is measured in numbers of switches.
There are context switch counters on the System and Thread objects. This counter displays the difference between the values observed in the last two samples, divided by the duration of the sample interval.
ZABBIX_ACTIVE
perf_counter_en[«\System\Context Switches/sec»]
CPU
CPU privileged time
The Processor Information\% Privileged Time counter shows the percent of time that the processor is spent
executing in Kernel (or Privileged) mode. Privileged mode includes services interrupts inside Interrupt
Service Routines (ISRs), executing Deferred Procedure Calls (DPCs), Device Driver calls and other kernel-mode
The Processor Information\% User Time counter shows the percent of time that the processor(s) is spent executing
ZABBIX_ACTIVE
perf_counter_en[«\Processor Information(_total)\% User Time»]
CPU
Number of cores
The number of logical processors available on the computer.
ZABBIX_ACTIVE
wmi.get[root/cimv2,»Select NumberOfLogicalProcessors from Win32_ComputerSystem»]
CPU
CPU queue length
The Processor Queue Length shows the number of threads that are observed as delayed in the processor Ready Queue
and are waiting to be executed.
ZABBIX_ACTIVE
perf_counter_en[«\System\Processor Queue Length»]
Triggers
Name
Description
Expression
Severity
Dependencies and additional info
High CPU utilization (over <$CPU.UTIL.CRIT>% for 5m)
CPU utilization is too high. The system might be slow to respond.
>
WARNING
CPU interrupt time is too high (over <$CPU.INTERRUPT.CRIT.MAX>% for 5m)
«The CPU Interrupt Time in the last 5 minutes exceeds <$CPU.INTERRUPT.CRIT.MAX>%.»
The Processor Information\% Interrupt Time is the time the processor spends receiving and servicing
hardware interrupts during sample intervals. This value is an indirect indicator of the activity of
devices that generate interrupts, such as the system clock, the mouse, disk drivers, data communication
lines, network interface cards and other peripheral devices. This is an easy way to identify a potential
hardware failure. This should never be higher than 20%.
Depends on:
— High CPU utilization (over <$CPU.UTIL.CRIT>% for 5m)
CPU privileged time is too high (over <$CPU.PRIV.CRIT.MAX>% for 5m)
The CPU privileged time in the last 5 minutes exceeds <$CPU.PRIV.CRIT.MAX>%.
Depends on:
— CPU interrupt time is too high (over <$CPU.INTERRUPT.CRIT.MAX>% for 5m)
— High CPU utilization (over <$CPU.UTIL.CRIT>% for 5m)
CPU queue length is too high (over <$CPU.QUEUE.CRIT.MAX>for 5m)
The CPU Queue Length in the last 5 minutes exceeds <$CPU.QUEUE.CRIT.MAX>. According to actual observations, PQL should not exceed the number of cores * 2. To fine-tune the conditions, use the macro <$CPU.QUEUE.CRIT.MAX >.
Depends on:
— High CPU utilization (over <$CPU.UTIL.CRIT>% for 5m)
Feedback
Please report any issues with the template at https://support.zabbix.com
Windows memory by Zabbix agent active
Overview
For Zabbix version: 5.4 and higher
Setup
Refer to the vendor documentation.
Zabbix configuration
No specific Zabbix configuration is required.
Macros used
The warning threshold of the Memory Pages/sec counter.
The warning threshold of the Free System Page Table Entries counter.
This indicates the number of page table entries not currently in use by the system. If the number is less
than 5,000, there may well be a memory leak or you running out of memory.
ZABBIX_ACTIVE
perf_counter_en[«\Memory\Free System Page Table Entries»]
Memory
Memory page faults per second
Page Faults/sec is the average number of pages faulted per second. It is measured in number of pages
faulted per second because only one page is faulted in each fault operation, hence this is also equal
to the number of page fault operations. This counter includes both hard faults (those that require
disk access) and soft faults (where the faulted page is found elsewhere in physical memory.) Most
processors can handle large numbers of soft faults without significant consequence. However, hard faults,
which require disk access, can cause significant delays.
ZABBIX_ACTIVE
perf_counter_en[«\Memory\Page Faults/sec»]
Memory
Memory pages per second
This measures the rate at which pages are read from or written to disk to resolve hard page faults.
If the value is greater than 1,000, as a result of excessive paging, there may be a memory leak.
ZABBIX_ACTIVE
perf_counter_en[«\Memory\Pages/sec»]
Memory
Memory pool non-paged
This measures the size, in bytes, of the non-paged pool. This is an area of system memory for objects
that cannot be written to disk but instead must remain in physical memory as long as they are allocated.
There is a possible memory leak if the value is greater than 175MB (or 100MB with the /3GB switch).
A typical Event ID 2019 is recorded in the system event log.
ZABBIX_ACTIVE
perf_counter_en[«\Memory\Pool Nonpaged Bytes»]
Triggers
Name
Description
Expression
Severity
Dependencies and additional info
High memory utilization (><$MEMORY.UTIL.MAX>% for 5m)
The system is running out of free memory.
>
AVERAGE
High swap space usage (less than <$SWAP.PFREE.MIN.WARN>% free)
This trigger is ignored, if there is no swap configured
Depends on:
— High memory utilization (><$MEMORY.UTIL.MAX>% for 5m)
Number of free system page table entries is too low (less <$MEM.PAGE_TABLE_CRIT.MIN>for 5m)
The Memory Free System Page Table Entries is less than <$MEM.PAGE_TABLE_CRIT.MIN>for 5 minutes. If the number is less than 5,000, there may well be a memory leak.
Depends on:
— High memory utilization (><$MEMORY.UTIL.MAX>% for 5m)
The Memory Pages/sec is too high (over <$MEM.PAGE_SEC.CRIT.MAX>for 5m)
The Memory Pages/sec in the last 5 minutes exceeds <$MEM.PAGE_SEC.CRIT.MAX>. If the value is greater than 1,000, as a result of excessive paging, there may be a memory leak.
Depends on:
— High memory utilization (><$MEMORY.UTIL.MAX>% for 5m)
Feedback
Please report any issues with the template at https://support.zabbix.com
Windows filesystems by Zabbix agent active
Overview
For Zabbix version: 5.4 and higher
Setup
Refer to the vendor documentation.
Zabbix configuration
No specific Zabbix configuration is required.
Macros used
This macro is used in filesystems discovery. Can be overridden on the host or linked template level.
This macro is used in filesystems discovery. Can be overridden on the host or linked template level.
This macro is used in filesystems discovery. Can be overridden on the host or linked template level.
This macro is used in filesystems discovery. Can be overridden on the host or linked template level.
This macro is used in filesystems discovery. Can be overridden on the host or linked template level.
This macro is used in filesystems discovery. Can be overridden on the host or linked template level.
The critical threshold of the filesystem utilization in percent.
The warning threshold of the filesystem utilization in percent.
Template links
There are no template links in this template.
Discovery rules
Name
Description
Type
Key and additional info
Mounted filesystem discovery
Discovery of file systems of different types.
ZABBIX_ACTIVE
vfs.fs.discovery
Filter:
Items collected
Group
Name
Description
Type
Key and additional info
Filesystems
<#FSNAME>: Used space
Used storage in Bytes
ZABBIX_ACTIVE
vfs.fs.size[<#FSNAME>,used]
Filesystems
<#FSNAME>: Total space
Total space in Bytes
ZABBIX_ACTIVE
vfs.fs.size[<#FSNAME>,total]
Filesystems
<#FSNAME>: Space utilization
Space utilization in % for
ZABBIX_ACTIVE
vfs.fs.size[<#FSNAME>,pused]
Triggers
Name
Description
Expression
Severity
Dependencies and additional info
<#FSNAME>: Disk space is critically low (used > <$VFS.FS.PUSED.MAX.CRIT:"<#FSNAME>«>%)
Two conditions should match: First, space utilization should be above <$VFS.FS.PUSED.MAX.CRIT:"<#FSNAME>«>.
Second condition should be one of the following:
— The disk free space is less than 5G.
— The disk will be full in less than 24 hours.
,pused].last()>><$VFS.FS.PUSED.MAX.CRIT:"<#FSNAME>«> and ((,total].last()>-,used].last()>)
AVERAGE
Manual close: YES
Two conditions should match: First, space utilization should be above <$VFS.FS.PUSED.MAX.WARN:"<#FSNAME>«>.
Second condition should be one of the following:
— The disk free space is less than 10G.
— The disk will be full in less than 24 hours.
,pused].last()>><$VFS.FS.PUSED.MAX.WARN:"<#FSNAME>«> and ((,total].last()>-,used].last()>)
WARNING
Manual close: YES
Depends on:
Feedback
Please report any issues with the template at https://support.zabbix.com
Windows physical disks by Zabbix agent active
Overview
For Zabbix version: 5.4 and higher
Setup
Refer to the vendor documentation.
Zabbix configuration
No specific Zabbix configuration is required.
Macros used
This macro is used in physical disks discovery. Can be overridden on the host or linked template level.
This macro is used in physical disks discovery. Can be overridden on the host or linked template level.
Disk read average response time (in s) before the trigger would fire.
The warning threshold of disk time utilization in percent.
Disk write average response time (in s) before the trigger would fire.
Current average disk queue, the number of requests outstanding on the disk at the time the performance data is collected.
ZABBIX_ACTIVE
perf_counter_en[«\PhysicalDisk(<#DEVNAME>)\Current Disk Queue Length»,60]
Storage
<#DEVNAME>: Disk utilization
This item is the percentage of elapsed time that the selected disk drive was busy servicing read or writes requests.
ZABBIX_ACTIVE
perf_counter_en[«\PhysicalDisk(<#DEVNAME>)\% Disk Time»,60]
Storage
<#DEVNAME>: Disk read request avg waiting time
The average time for read requests issued to the device to be served. This includes the time spent by the requests in queue and the time spent servicing them.
ZABBIX_ACTIVE
perf_counter_en[«\PhysicalDisk(<#DEVNAME>)\Avg. Disk sec/Read»,60]
Storage
<#DEVNAME>: Disk write request avg waiting time
The average time for write requests issued to the device to be served. This includes the time spent by the requests in queue and the time spent servicing them.
ZABBIX_ACTIVE
perf_counter_en[«\PhysicalDisk(<#DEVNAME>)\Avg. Disk sec/Write»,60]
Storage
<#DEVNAME>: Average disk read queue length
Average disk read queue, the number of requests outstanding on the disk at the time the performance data is collected.
ZABBIX_ACTIVE
perf_counter_en[«\PhysicalDisk(<#DEVNAME>)\Avg. Disk Read Queue Length»,60]
Storage
<#DEVNAME>: Average disk write queue length
Average disk write queue, the number of requests outstanding on the disk at the time the performance data is collected.
ZABBIX_ACTIVE
perf_counter_en[«\PhysicalDisk(<#DEVNAME>)\Avg. Disk Write Queue Length»,60]
Triggers
Name
Description
Expression
Severity
Dependencies and additional info
<#DEVNAME>: Disk is overloaded (util > <$VFS.DEV.UTIL.MAX.WARN>% for 15m)
The disk appears to be under heavy load
Manual close: YES
Depends on:
— <#DEVNAME>: Disk read request responses are too high (read > <$VFS.DEV.READ.AWAIT.WARN:"<#DEVNAME>«>s for 15m
— <#DEVNAME>: Disk write request responses are too high (write > <$VFS.DEV.WRITE.AWAIT.WARN:"<#DEVNAME>«>s for 15m)
<#DEVNAME>: Disk read request responses are too high (read > <$VFS.DEV.READ.AWAIT.WARN:"<#DEVNAME>«>s for 15m
This trigger might indicate disk <#DEVNAME>saturation.
)\Avg. Disk sec/Read»,60].min(15m)> > <$VFS.DEV.READ.AWAIT.WARN:"<#DEVNAME>«>
WARNING
Manual close: YES
<#DEVNAME>: Disk write request responses are too high (write > <$VFS.DEV.WRITE.AWAIT.WARN:"<#DEVNAME>«>s for 15m)
This trigger might indicate disk <#DEVNAME>saturation.
)\Avg. Disk sec/Write»,60].min(15m)> > <$VFS.DEV.WRITE.AWAIT.WARN:"<#DEVNAME>«>
WARNING
Manual close: YES
Feedback
Please report any issues with the template at https://support.zabbix.com
Windows generic by Zabbix agent active
Overview
For Zabbix version: 5.4 and higher
Setup
Refer to the vendor documentation.
Zabbix configuration
No specific Zabbix configuration is required.
Macros used
The threshold for difference of system time in seconds.
Template links
There are no template links in this template.
Discovery rules
Items collected
Group
Name
Description
Type
Key and additional info
General
System local time
System local time of the host.
ZABBIX_ACTIVE
system.localtime
General
System name
System host name.
ZABBIX_ACTIVE
system.hostname
Preprocessing:
System description of the host.
ZABBIX_ACTIVE
system.uname
Preprocessing:
The number of processes.
ZABBIX_ACTIVE
proc.num[]
General
Number of threads
The number of threads used by all running processes.
ZABBIX_ACTIVE
perf_counter_en[«\System\Threads»]
Inventory
Operating system architecture
Operating system architecture of the host.
ZABBIX_ACTIVE
system.sw.arch
Preprocessing:
System uptime in ‘N days, hh:mm:ss’ format.
ZABBIX_ACTIVE
system.uptime
Triggers
Name
Description
Expression
Severity
Dependencies and additional info
System time is out of sync (diff with Zabbix server > <$SYSTEM.FUZZYTIME.MAX>s)
The host system time is different from the Zabbix server time.
Manual close: YES
System name has changed (new name: )
System name has changed. Ack to close.
Manual close: YES
Host has been restarted (uptime
WARNING
Manual close: YES
Feedback
Please report any issues with the template at https://support.zabbix.com
Windows network by Zabbix agent active
Overview
For Zabbix version: 5.4 and higher
Setup
Refer to the vendor documentation.
Zabbix configuration
No specific Zabbix configuration is required.
Macros used
This macro is used in Network interface discovery. Can be overridden on the host or linked template level.
This macro is used in Network interface discovery. Can be overridden on the host or linked template level.
This macro is used in Network interface discovery. Can be overridden on the host or linked template level.
This macro is used in Network interface discovery. Can be overridden on the host or linked template level.
This macro is used in Network interface discovery. Can be overridden on the host or linked template level.
This macro is used in Network interface discovery. Can be overridden on the host or linked template level.
wmi.getall[root\cimv2,»select Name,Description,NetConnectionID,Speed,AdapterTypeId,NetConnectionStatus from win32_networkadapter where PhysicalAdapter=True and NetConnectionStatus>0″]
Triggers
Name
Description
Expression
Severity
Dependencies and additional info
Interface <#IFNAME>(<#IFALIAS>): High bandwidth usage (> <$IF.UTIL.MAX:"<#IFNAME>«>% )
The network interface utilization is close to its estimated maximum bandwidth.
(«].avg(15m)>>(<$IF.UTIL.MAX:"<#IFNAME>«>/100)*«].last()> or «].avg(15m)>>(<$IF.UTIL.MAX:"<#IFNAME>«>/100)*«].last()>) and «].last()>>0
«].avg(15m)>
WARNING
Manual close: YES
Depends on:
Interface <#IFNAME>(<#IFALIAS>): High error rate (> <$IF.ERRORS.WARN:"<#IFNAME>«> for 5m)
Recovers when below 80% of <$IF.ERRORS.WARN:"<#IFNAME>«> threshold
«,errors].min(5m)>><$IF.ERRORS.WARN:"<#IFNAME>«> or «,errors].min(5m)>><$IF.ERRORS.WARN:"<#IFNAME>«>
«,errors].max(5m)>
WARNING
Manual close: YES
Depends on:
Interface <#IFNAME>(<#IFALIAS>): Ethernet has changed to lower speed than it was before
This Ethernet connection has transitioned down from its known maximum speed. This might be a sign of autonegotiation issues. Ack to close.
Manual close: YES
Depends on:
This trigger expression works as follows:
1. Can be triggered if operations status is down.
2. <$IFCONTROL:\"<#IFNAME>\»>=1 — user can redefine Context macro to value — 0. That marks this interface as not important.
No new trigger will be fired if this interface is down.
3. =1) — trigger fires only if operational status is different from Connected(2).
WARNING: if closed manually — won’t fire again on next poll, because of .diff.
<$IFCONTROL:"<#IFNAME>«>=1 and («].last()><>2 and «].diff()>=1)
«].last()>=2 or <$IFCONTROL:"<#IFNAME>«>=0
AVERAGE
Manual close: YES
Feedback
Please report any issues with the template at https://support.zabbix.com
Windows services by Zabbix agent active
Overview
For Zabbix version: 5.4 and higher Special version of services template that is required for Windows OS.
Setup
Refer to the vendor documentation.
Zabbix configuration
No specific Zabbix configuration is required.
Macros used
This macro is used in Service discovery. Can be overridden on the host or linked template level.
This macro is used in Service discovery. Can be overridden on the host or linked template level.
This macro is used in Service discovery. Can be overridden on the host or linked template level.
This macro is used in Service discovery. Can be overridden on the host or linked template level.
^manual|disabled$
Template links
There are no template links in this template.
Discovery rules
Name
Description
Type
Key and additional info
Windows services discovery
Discovery of Windows services of different types as defined in template’s macros.
ZABBIX_ACTIVE
service.discovery
Filter:
Items collected
Group
Name
Description
Type
Key and additional info
Services
State of service «<#SERVICE.NAME>» (<#SERVICE.DISPLAYNAME>)
ZABBIX_ACTIVE
service.info[«<#SERVICE.NAME>«,state]
Triggers
Name
Description
Expression
Severity
Dependencies and additional info
«<#SERVICE.NAME>» (<#SERVICE.DISPLAYNAME>) is not running (startup type <#SERVICE.STARTUPNAME>)
The service has a state other than «Running» for the last three times.
«,state].min(#3)><>0
AVERAGE
Feedback
Please report any issues with the template at https://support.zabbix.com
Windows by Zabbix agent active
Overview
For Zabbix version: 5.4 and higher New official Windows template. Requires agent of Zabbix 4.4 and newer.
This template was tested on:
Windows, version 7 and newer.
Windows Server, version 2008 R2 and newer.
Setup
Install Zabbix agent on Windows OS according to Zabbix documentation.
Zabbix configuration
No specific Zabbix configuration is required.
Template links
Name
Windows CPU by Zabbix agent active
Windows filesystems by Zabbix agent active
Windows generic by Zabbix agent active
Windows memory by Zabbix agent active
Windows network by Zabbix agent active
Windows physical disks by Zabbix agent active
Windows services by Zabbix agent active
Zabbix agent
Discovery rules
Items collected
Group
Name
Description
Type
Key and additional info
Triggers
Name
Description
Expression
Severity
Dependencies and additional info
Feedback
Please report any issues with the template at https://support.zabbix.com
You can also provide a feedback, discuss the template or ask for help with it at ZABBIX forums.
Windows SNMP
Overview
For Zabbix version: 5.2 and higher
Setup
Refer to the vendor documentation.
Zabbix configuration
No specific Zabbix configuration is required.
Template links
Name
Generic SNMP
HOST-RESOURCES-MIB SNMP
Interfaces Windows SNMP
Discovery rules
Items collected
Group
Name
Description
Type
Key and additional info
Triggers
Name
Description
Expression
Severity
Dependencies and additional info
Feedback
Please report any issues with the template at https://support.zabbix.com
Known Issues
Description: Doesn’t support In/Out 64 bit counters even though IfxTable is present: Currently, Windows gets it’s interface status from MIB-2. Since these 64bit SNMP counters (ifHCInOctets, ifHCOutOctets, etc.) are defined as an extension to IF-MIB, Microsoft has not implemented it. https://social.technet.microsoft.com/Forums/windowsserver/en-US/07b62ff0-94f6-40ca-a99d-d129c1b33d70/windows-2008-r2-snmp-64bit-counters-support?forum=winservergen